
A New Way for Incorporating GCM Information into Water Shortage Projections

Abstract
:1. Introduction
2. Materials and Methods
2.1. Previous Methodology
2.1.1. Water Vision 2020: The National Water Resources Planning Report in Korea

| Report | Water Vision 2020 a | The Strategic Report b |
|---|---|---|
| Target year | 2020 | 2040s (2031 ~ 2060) |
| Maximum water shortage (106 m3) | 862 | 3300 |
2.1.2. An Example of Water Balance Analysis Using Climate Change Information

2.2. New Approach
2.2.1. Overview
2.2.2. Weighting Scheme
2.2.3. Procedure
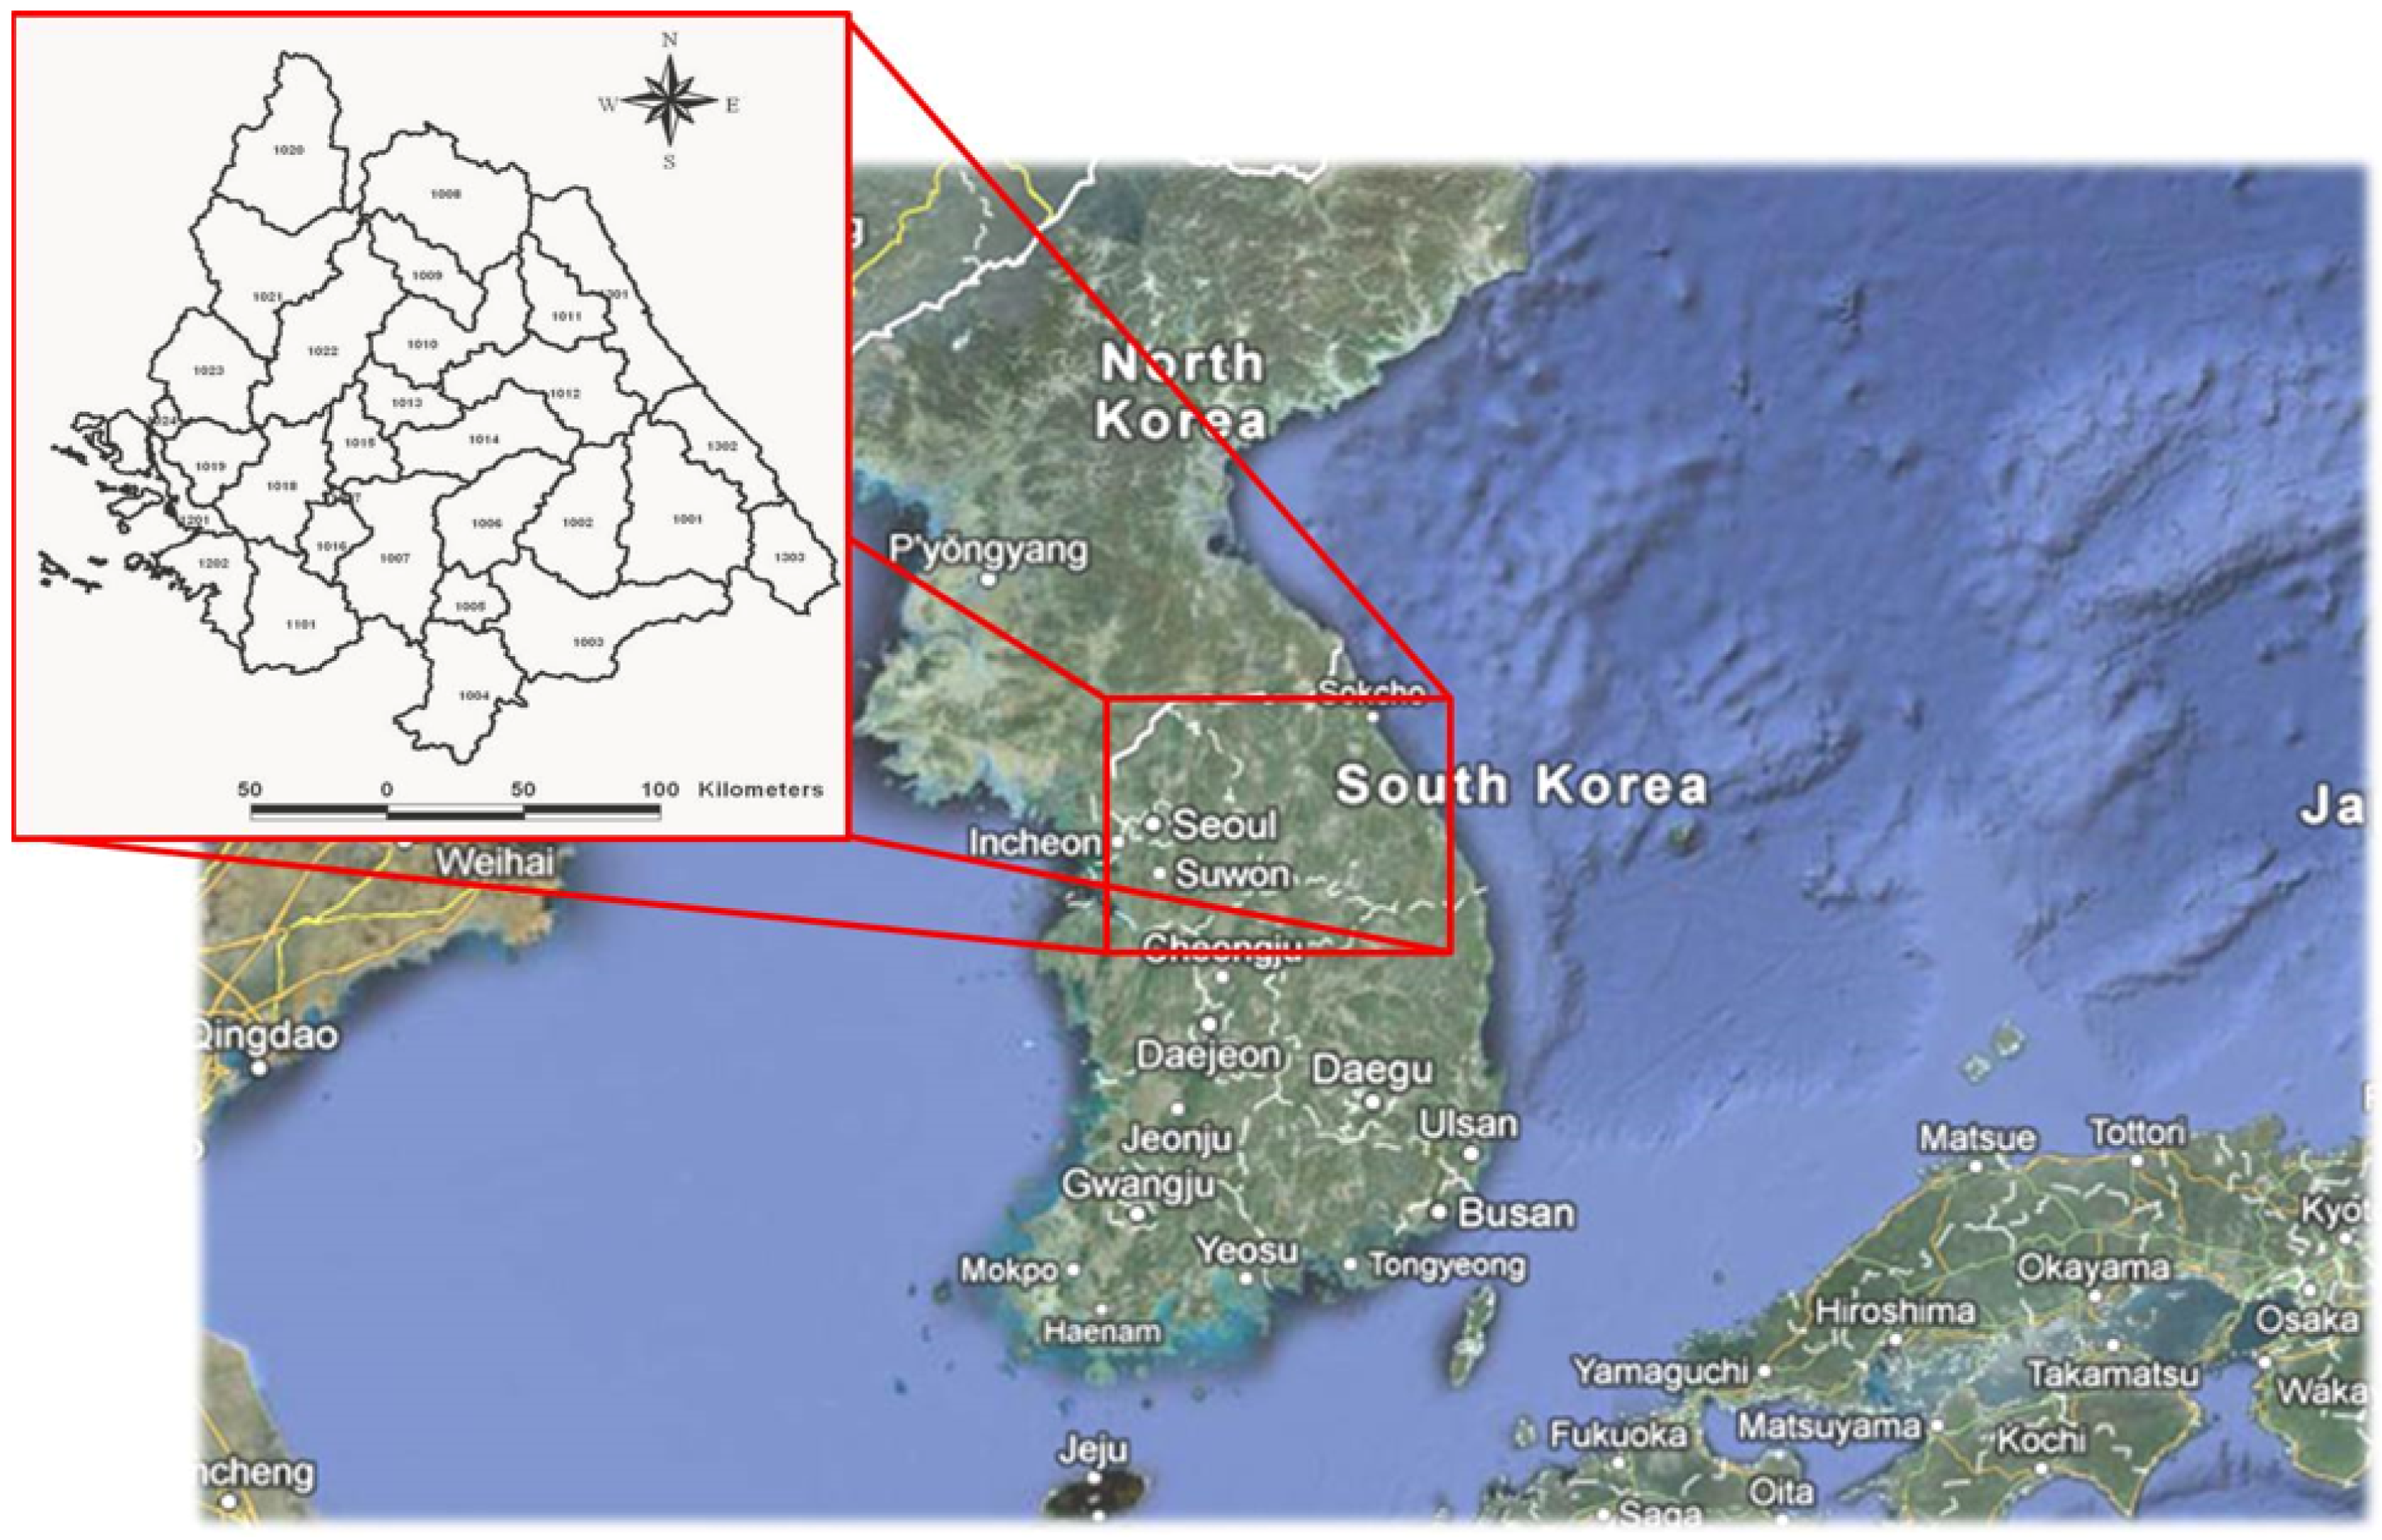
2.3. Study Basin

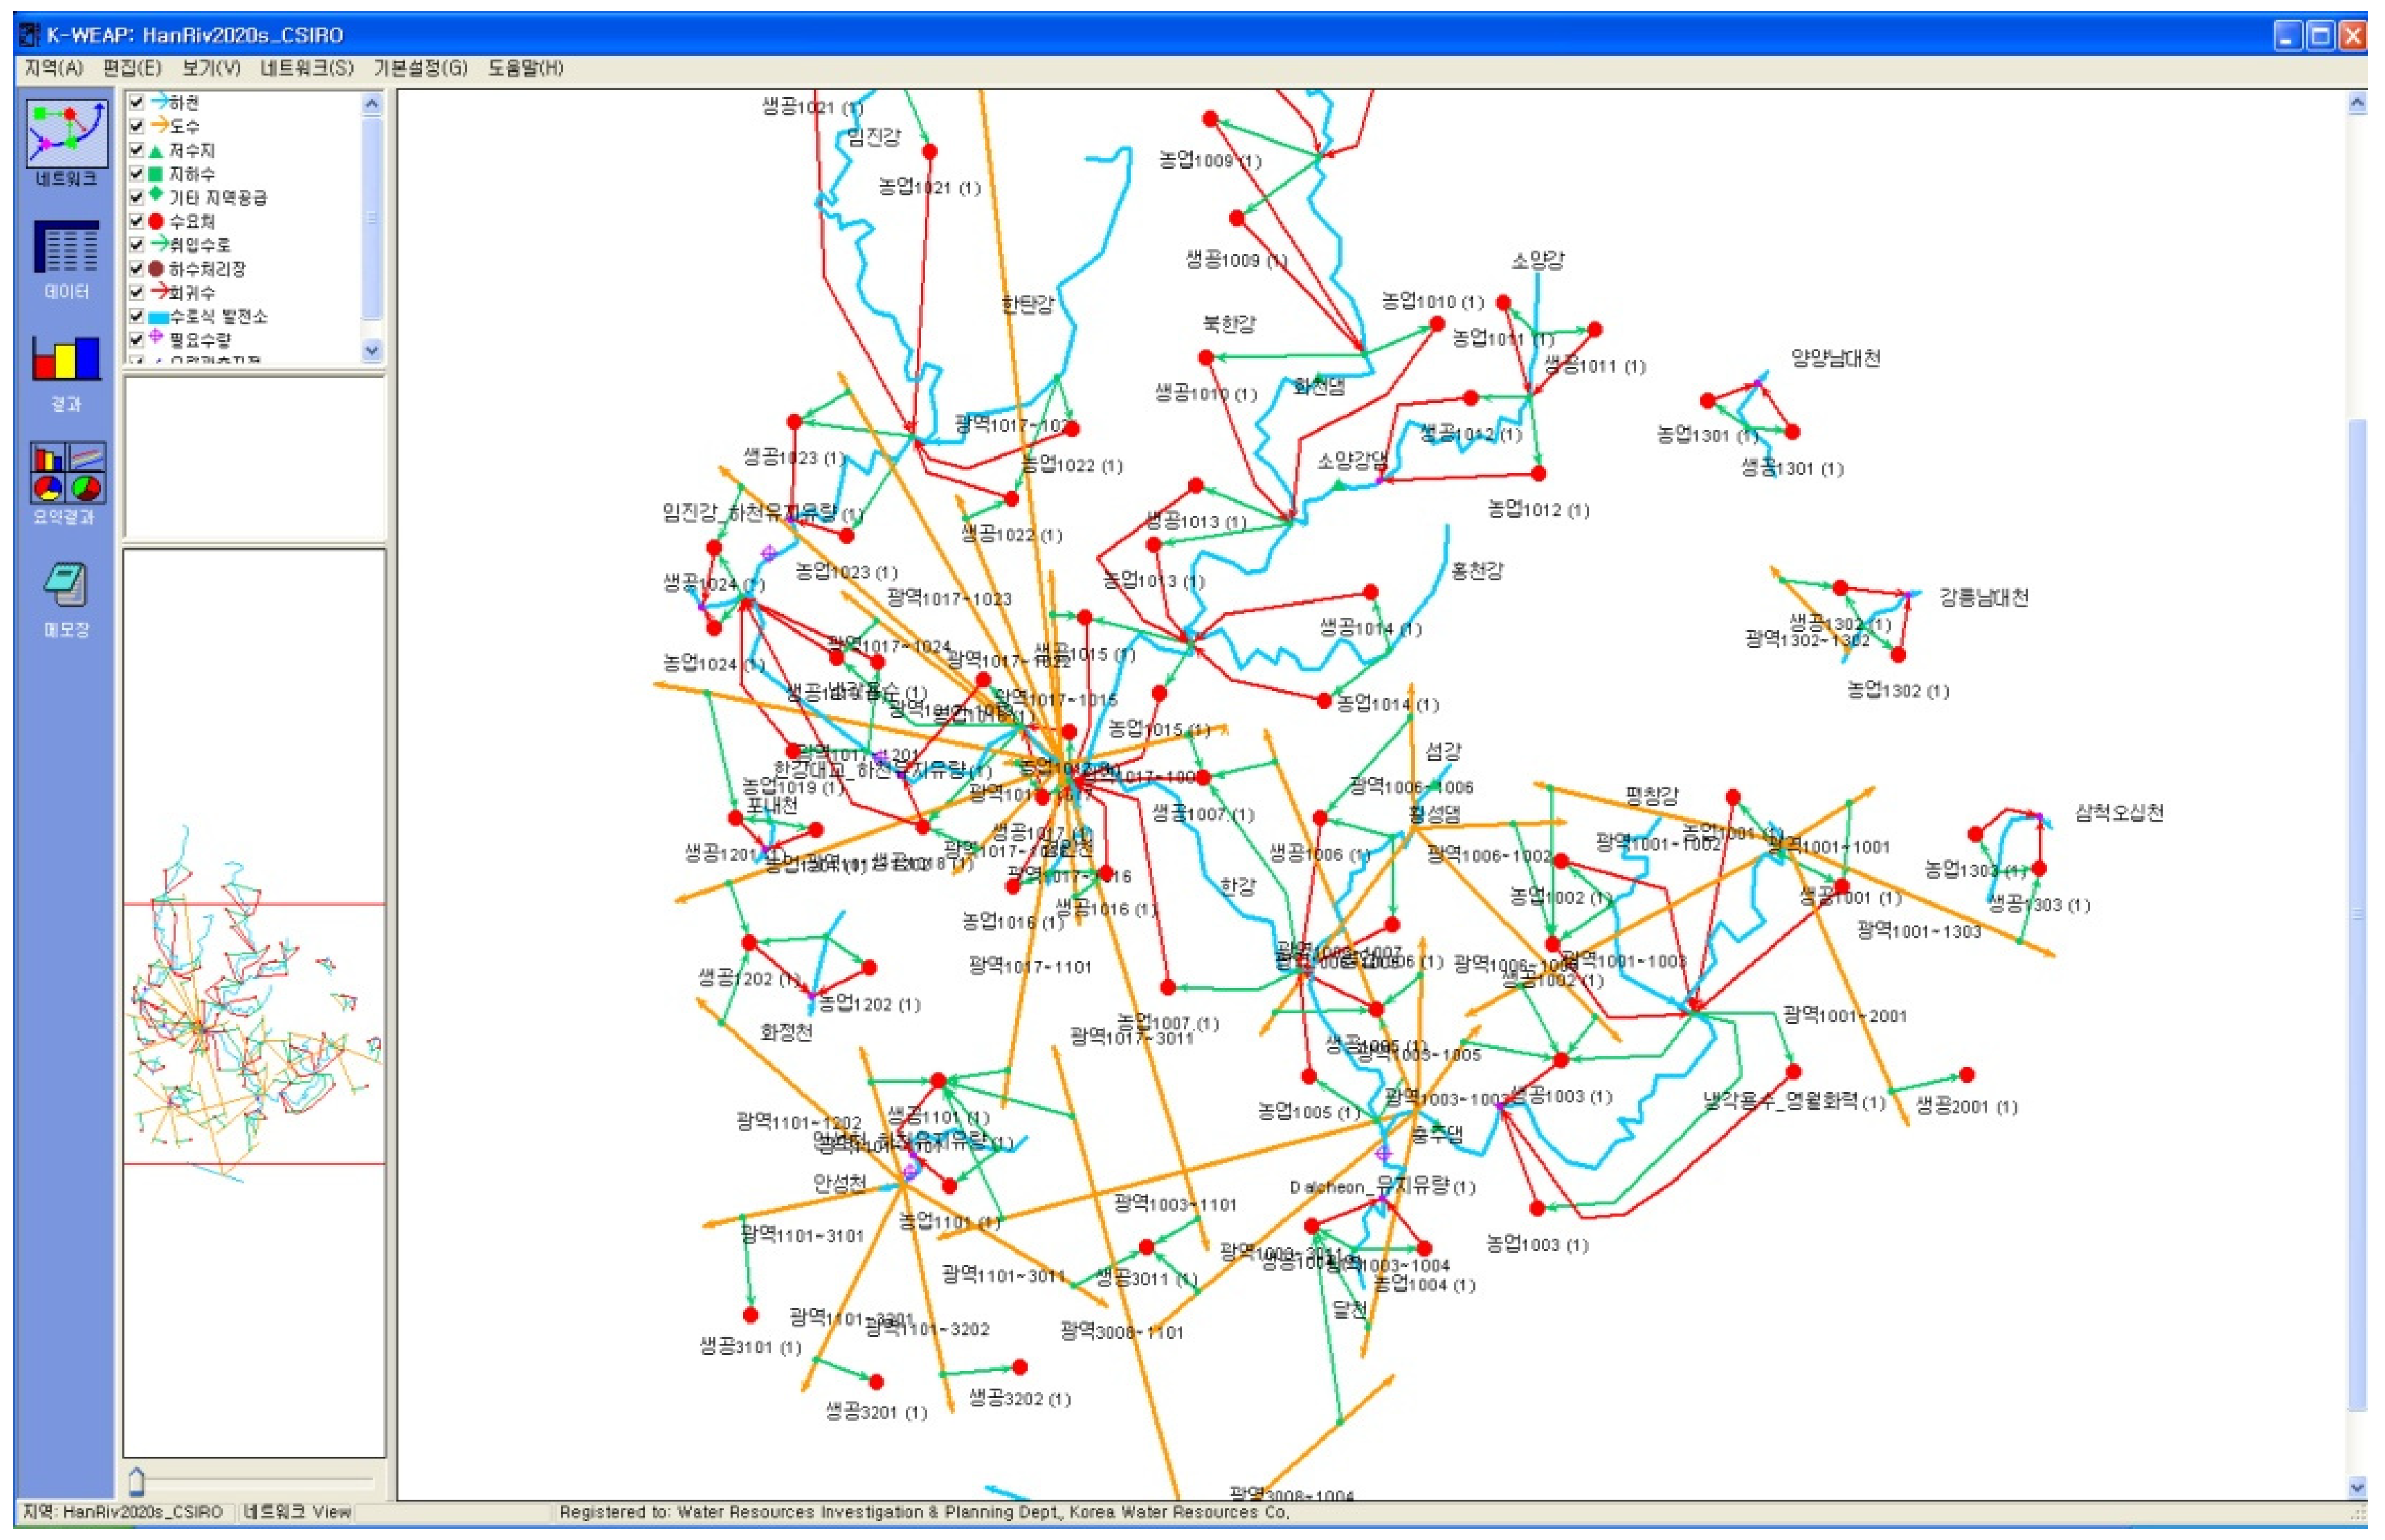
2.4. Water Balance Model

2.5. Climate Change Scenarios
| No. | Model (Agency: Version) | Abbreviation | Country | Resolution (km) | |
|---|---|---|---|---|---|
| Atmosphere | Ocean | ||||
| 1 | CSIRO: MK3.0 | CSR | Australia | 192 × 96 | 192 × 189 |
| 2 | CNRM: CM3 | GNR | France | 128 × 64 | 182 × 152 |
| 3 | CONS: ECHO-G | MIU | Germany/Korea | 96 × 48 | 128 × 117 |
| 4 | UKMO: HadCM3 | UKC | United Kingdom | 192 × 144 | 360 × 216 |

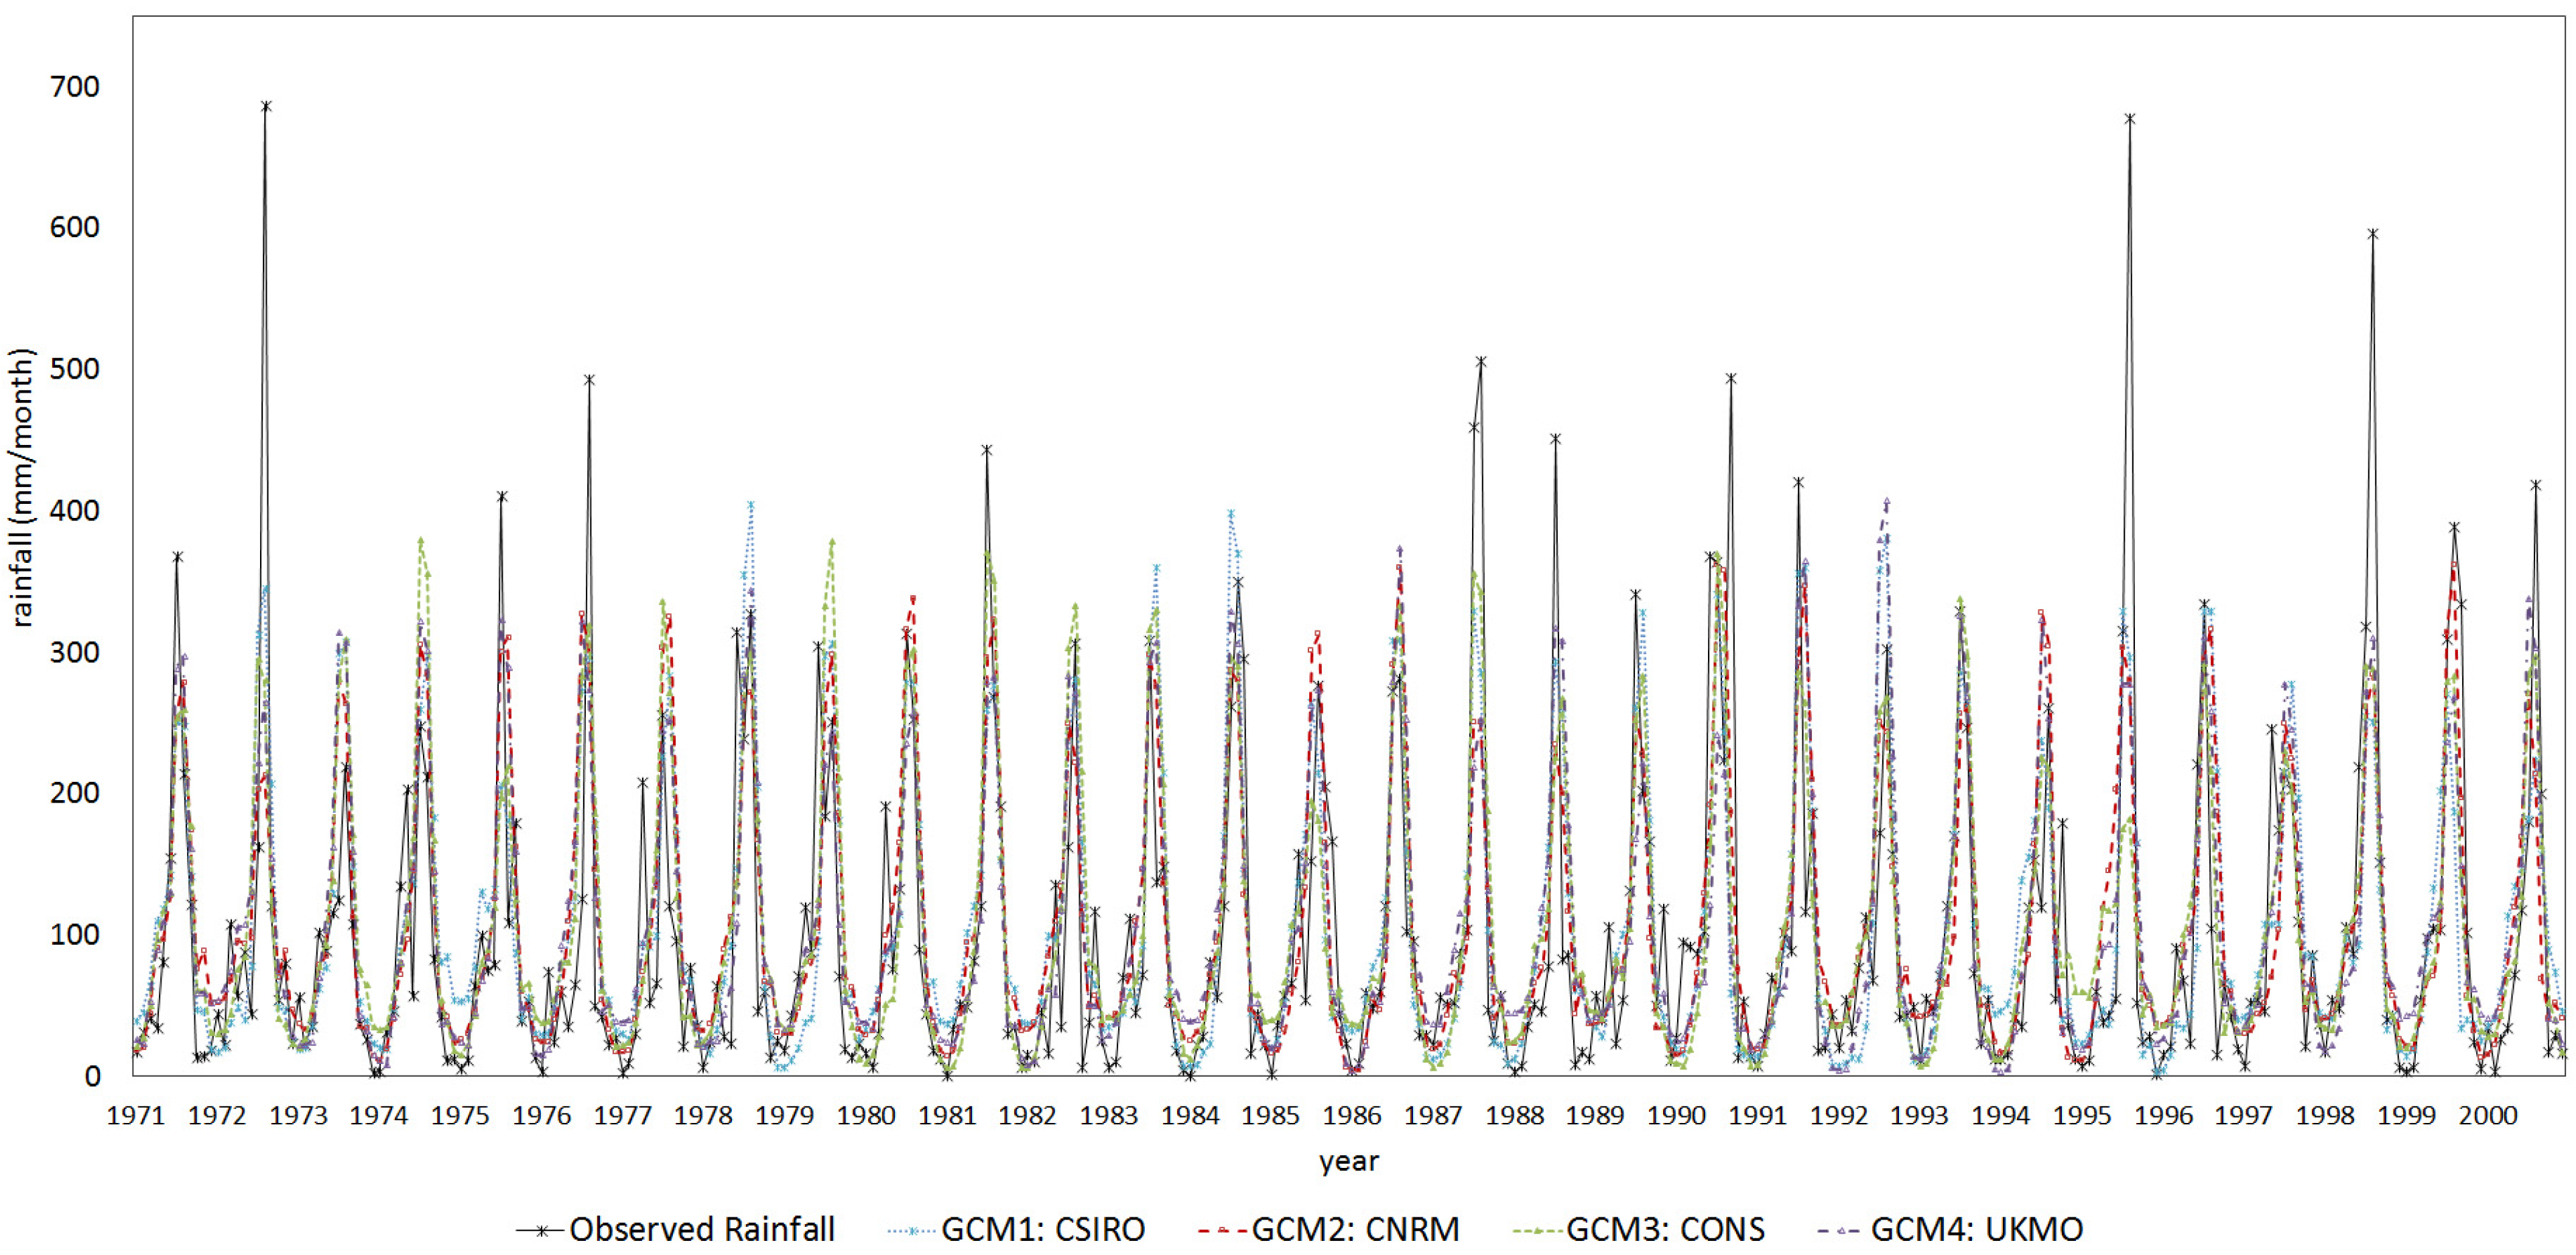
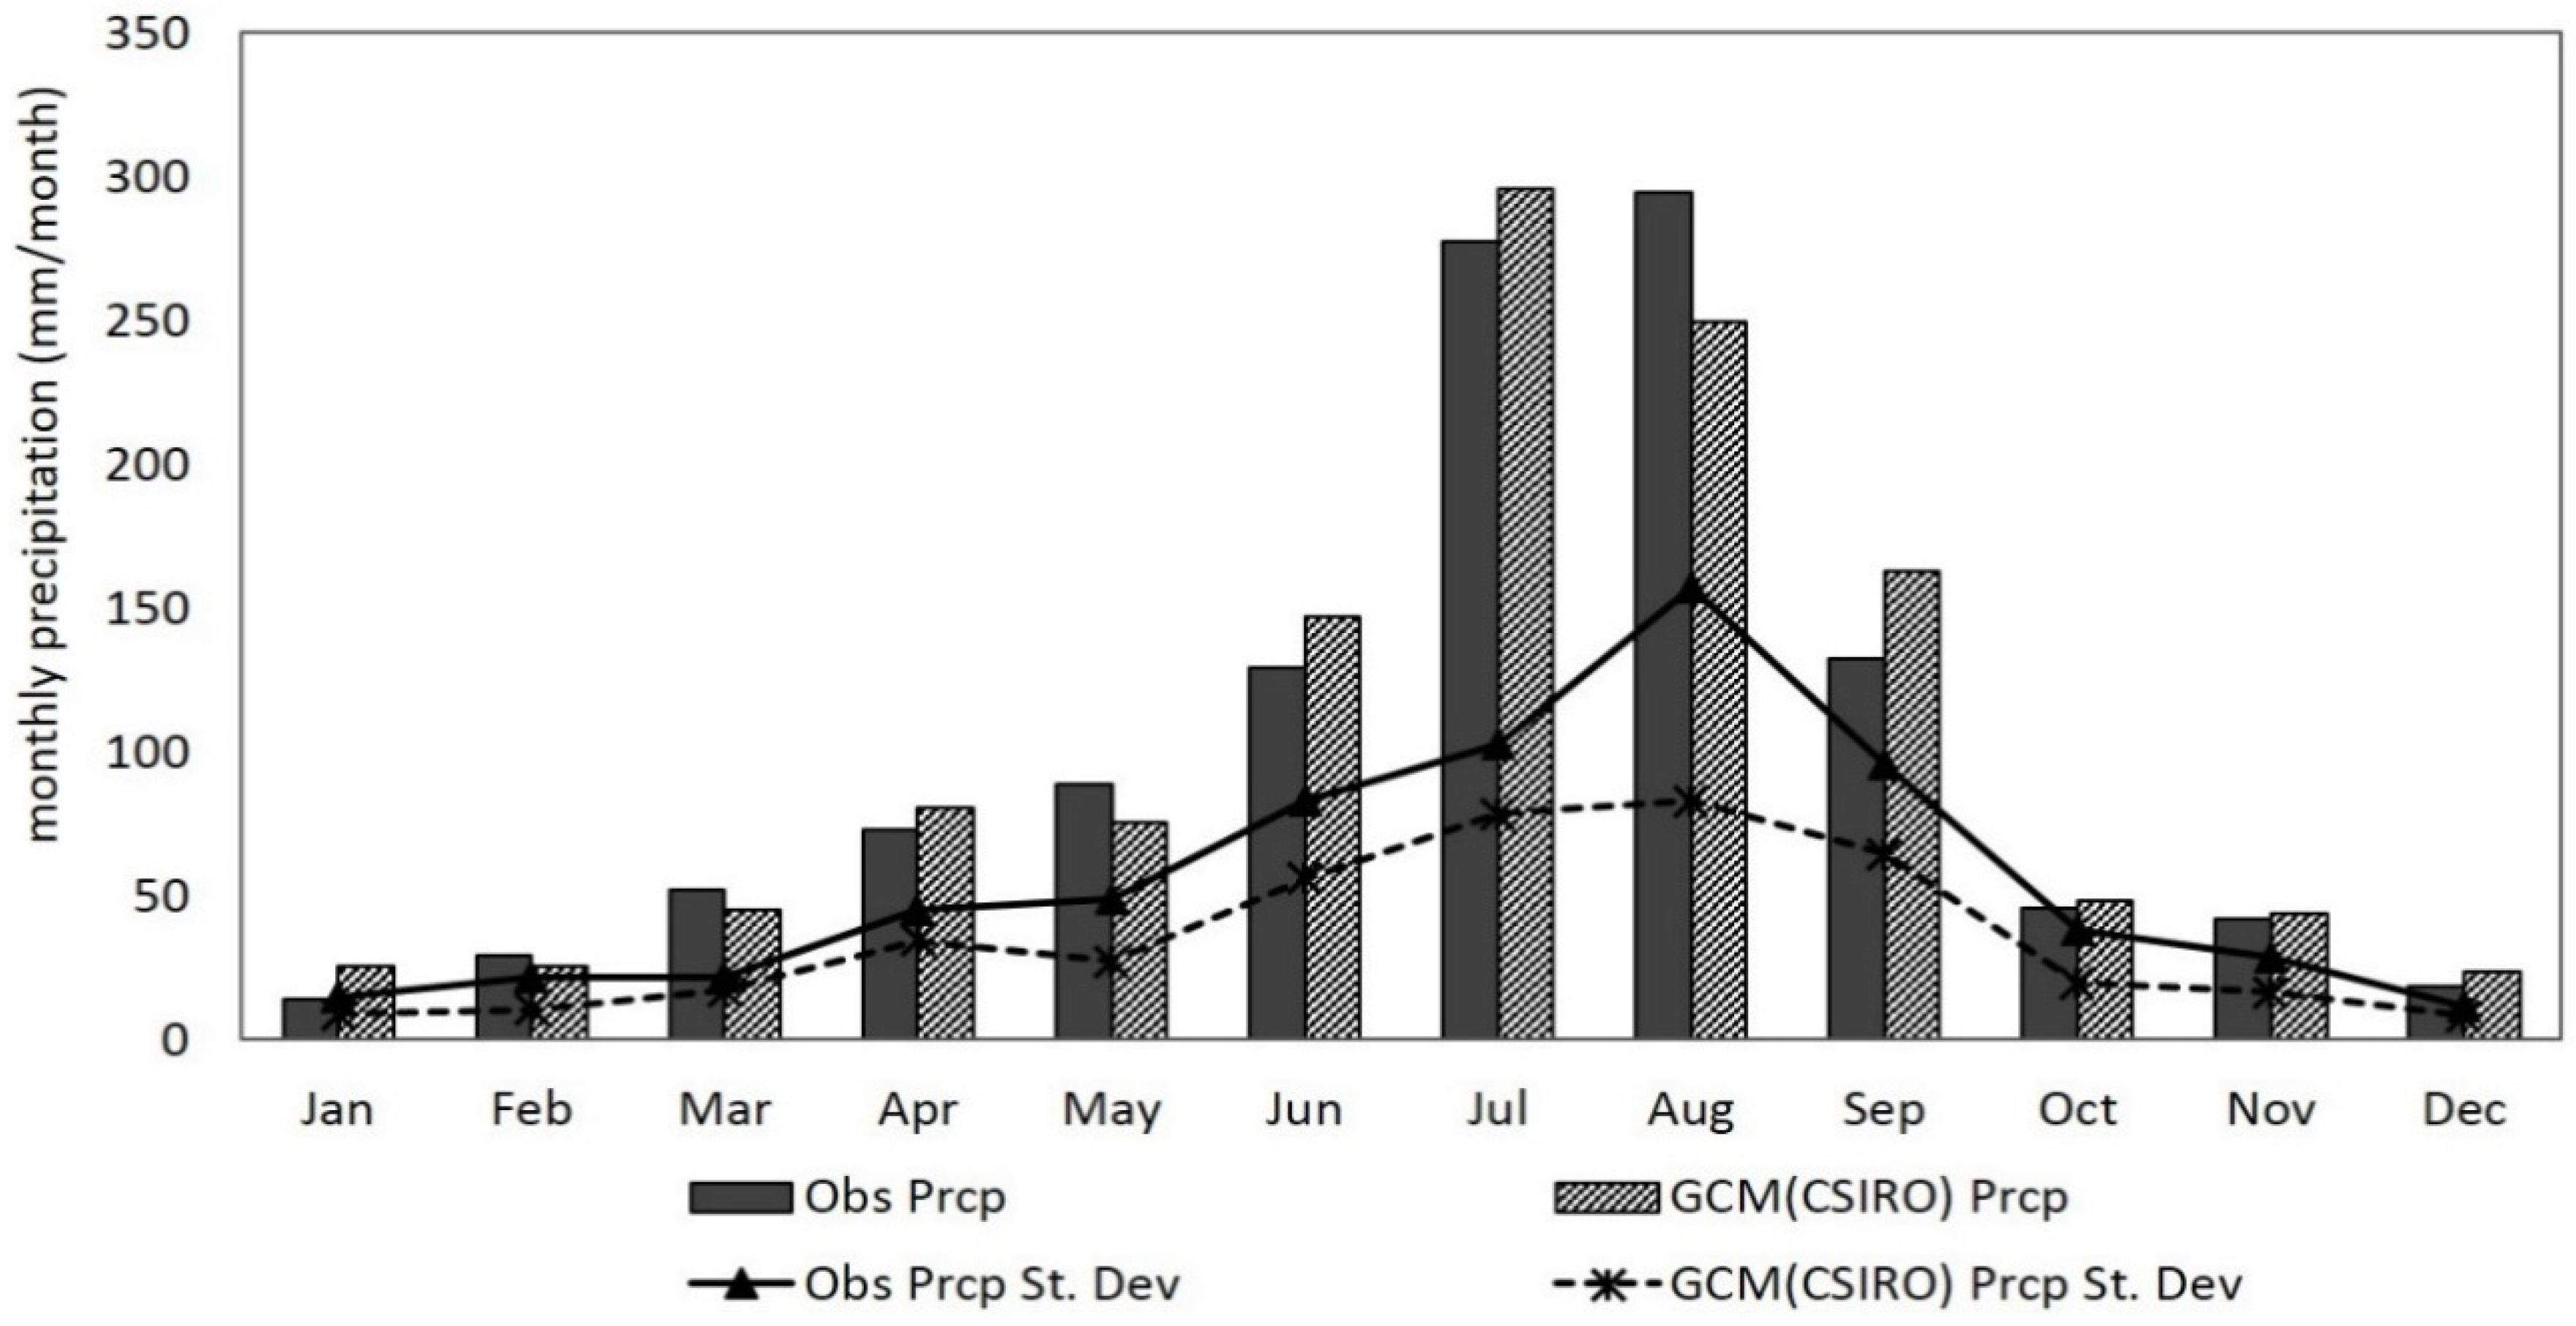
2.6. Bias Correction
3. Results
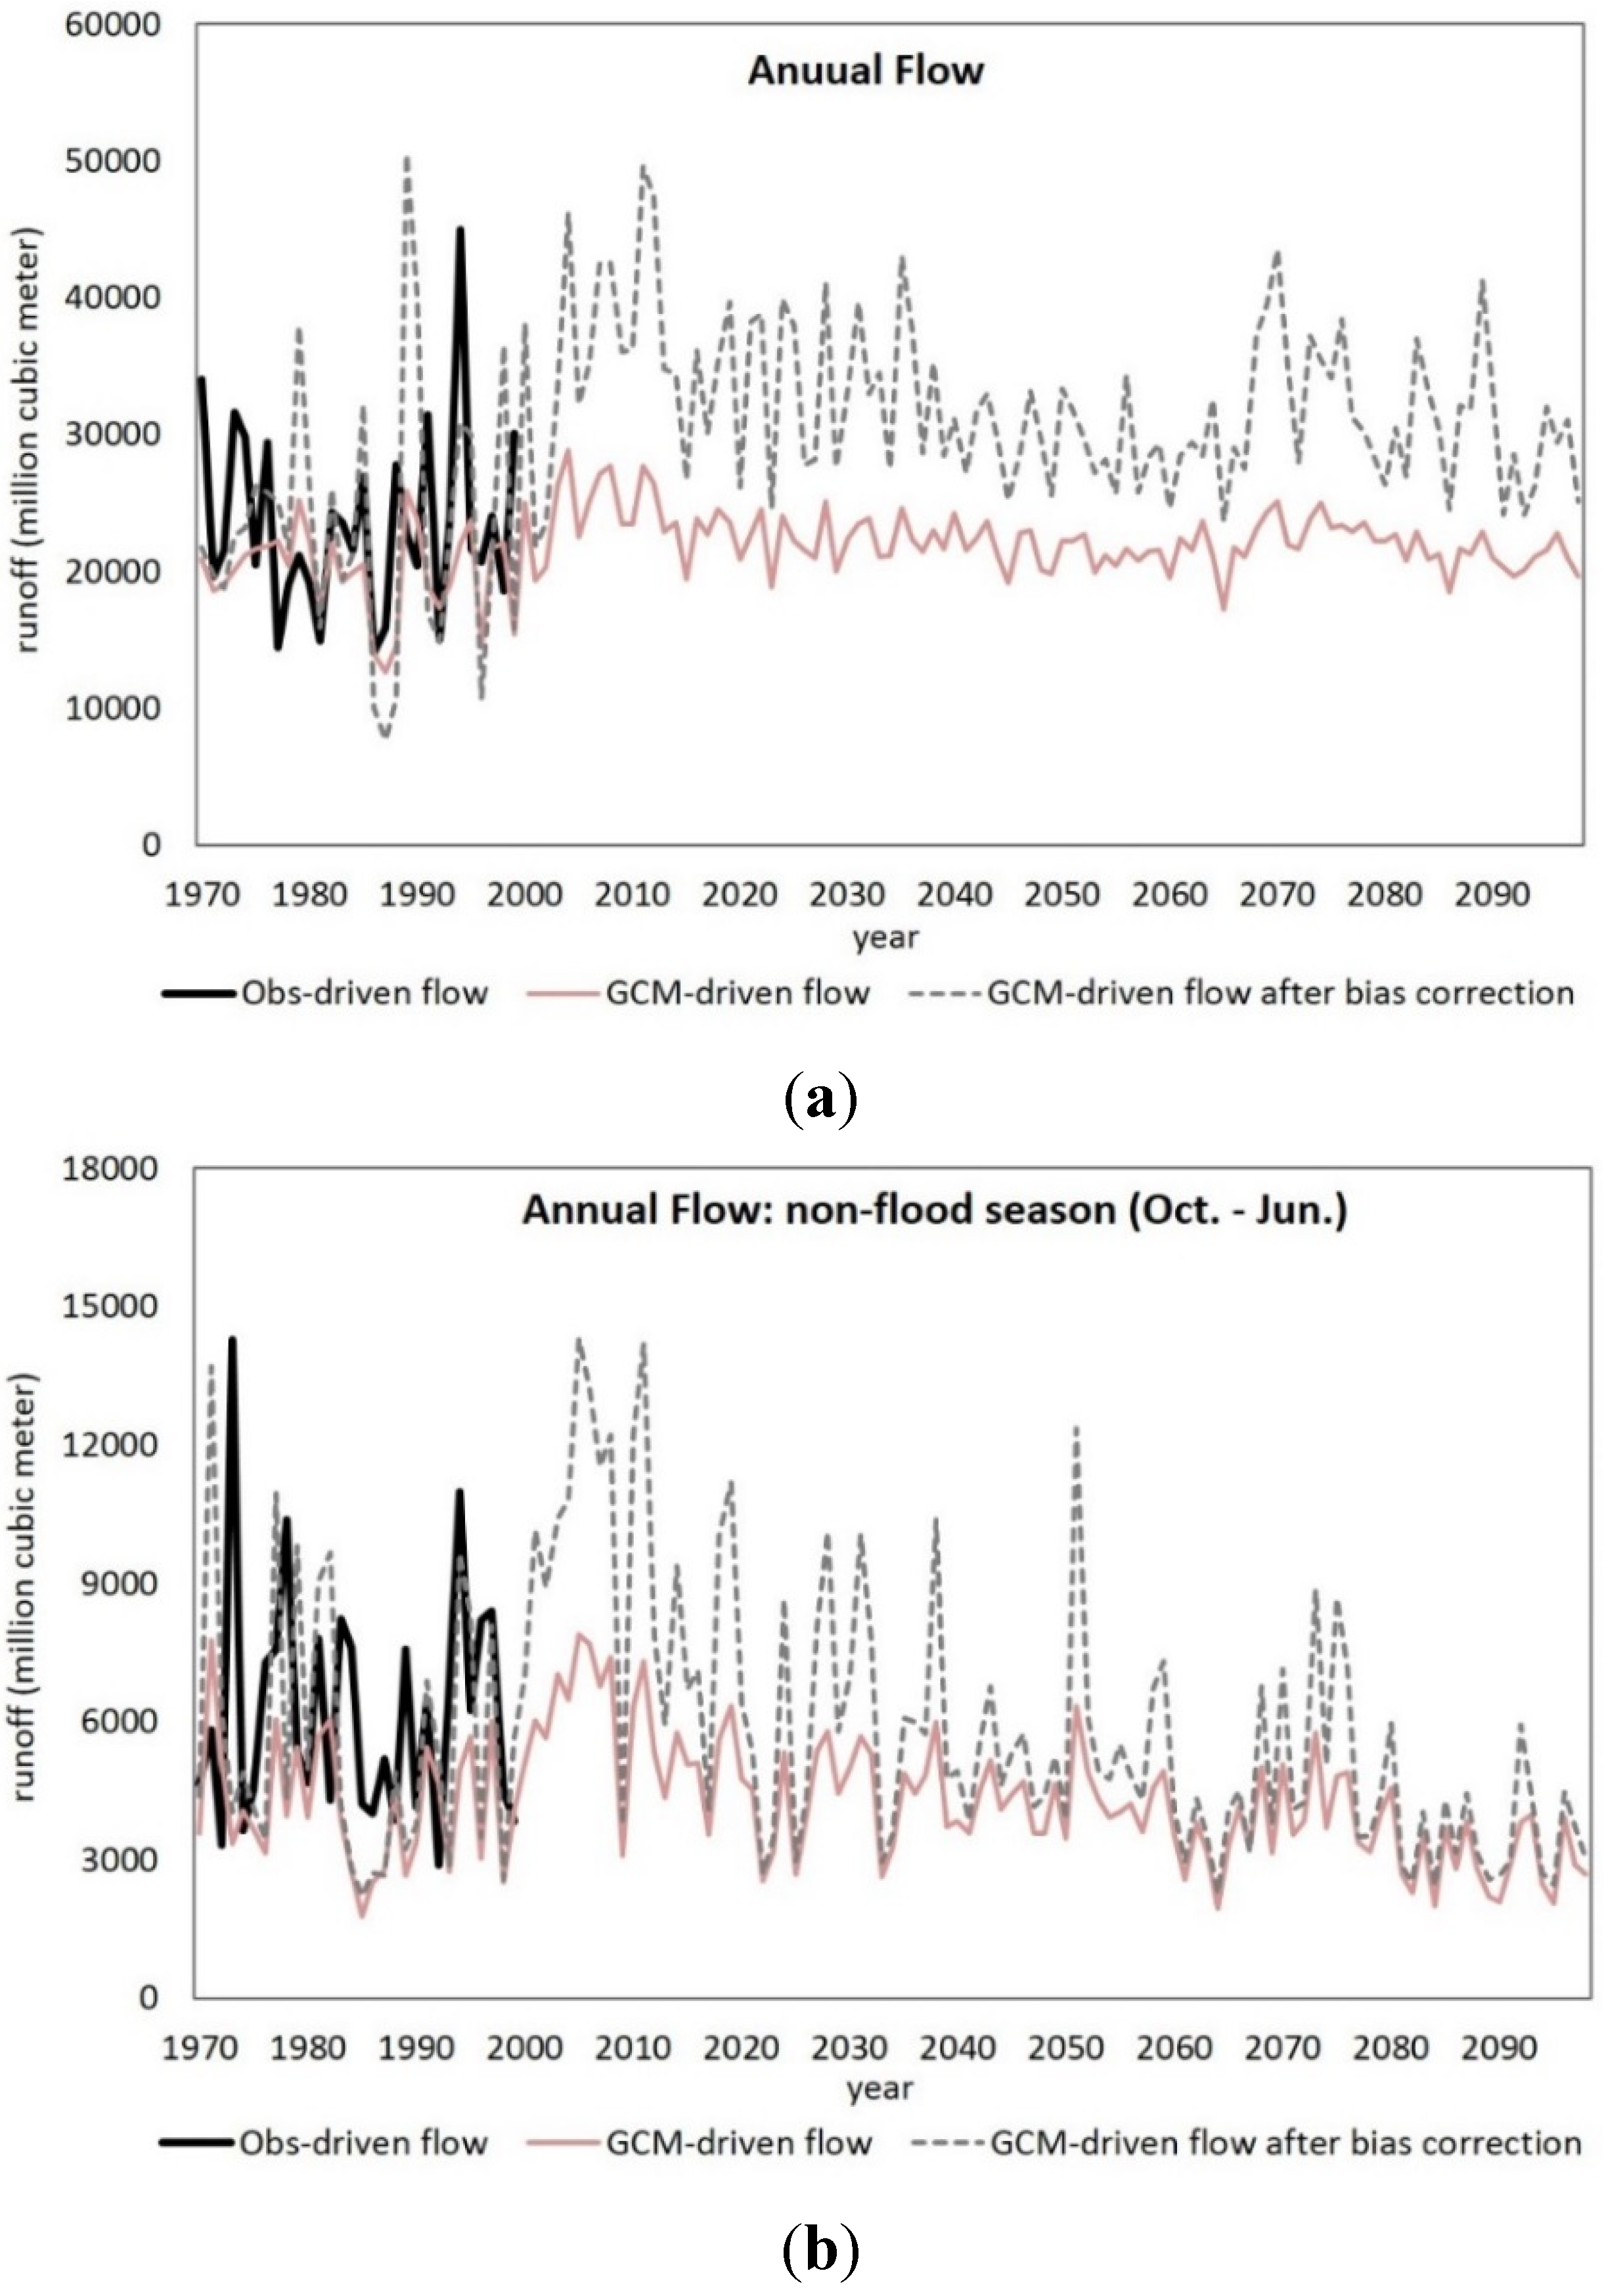
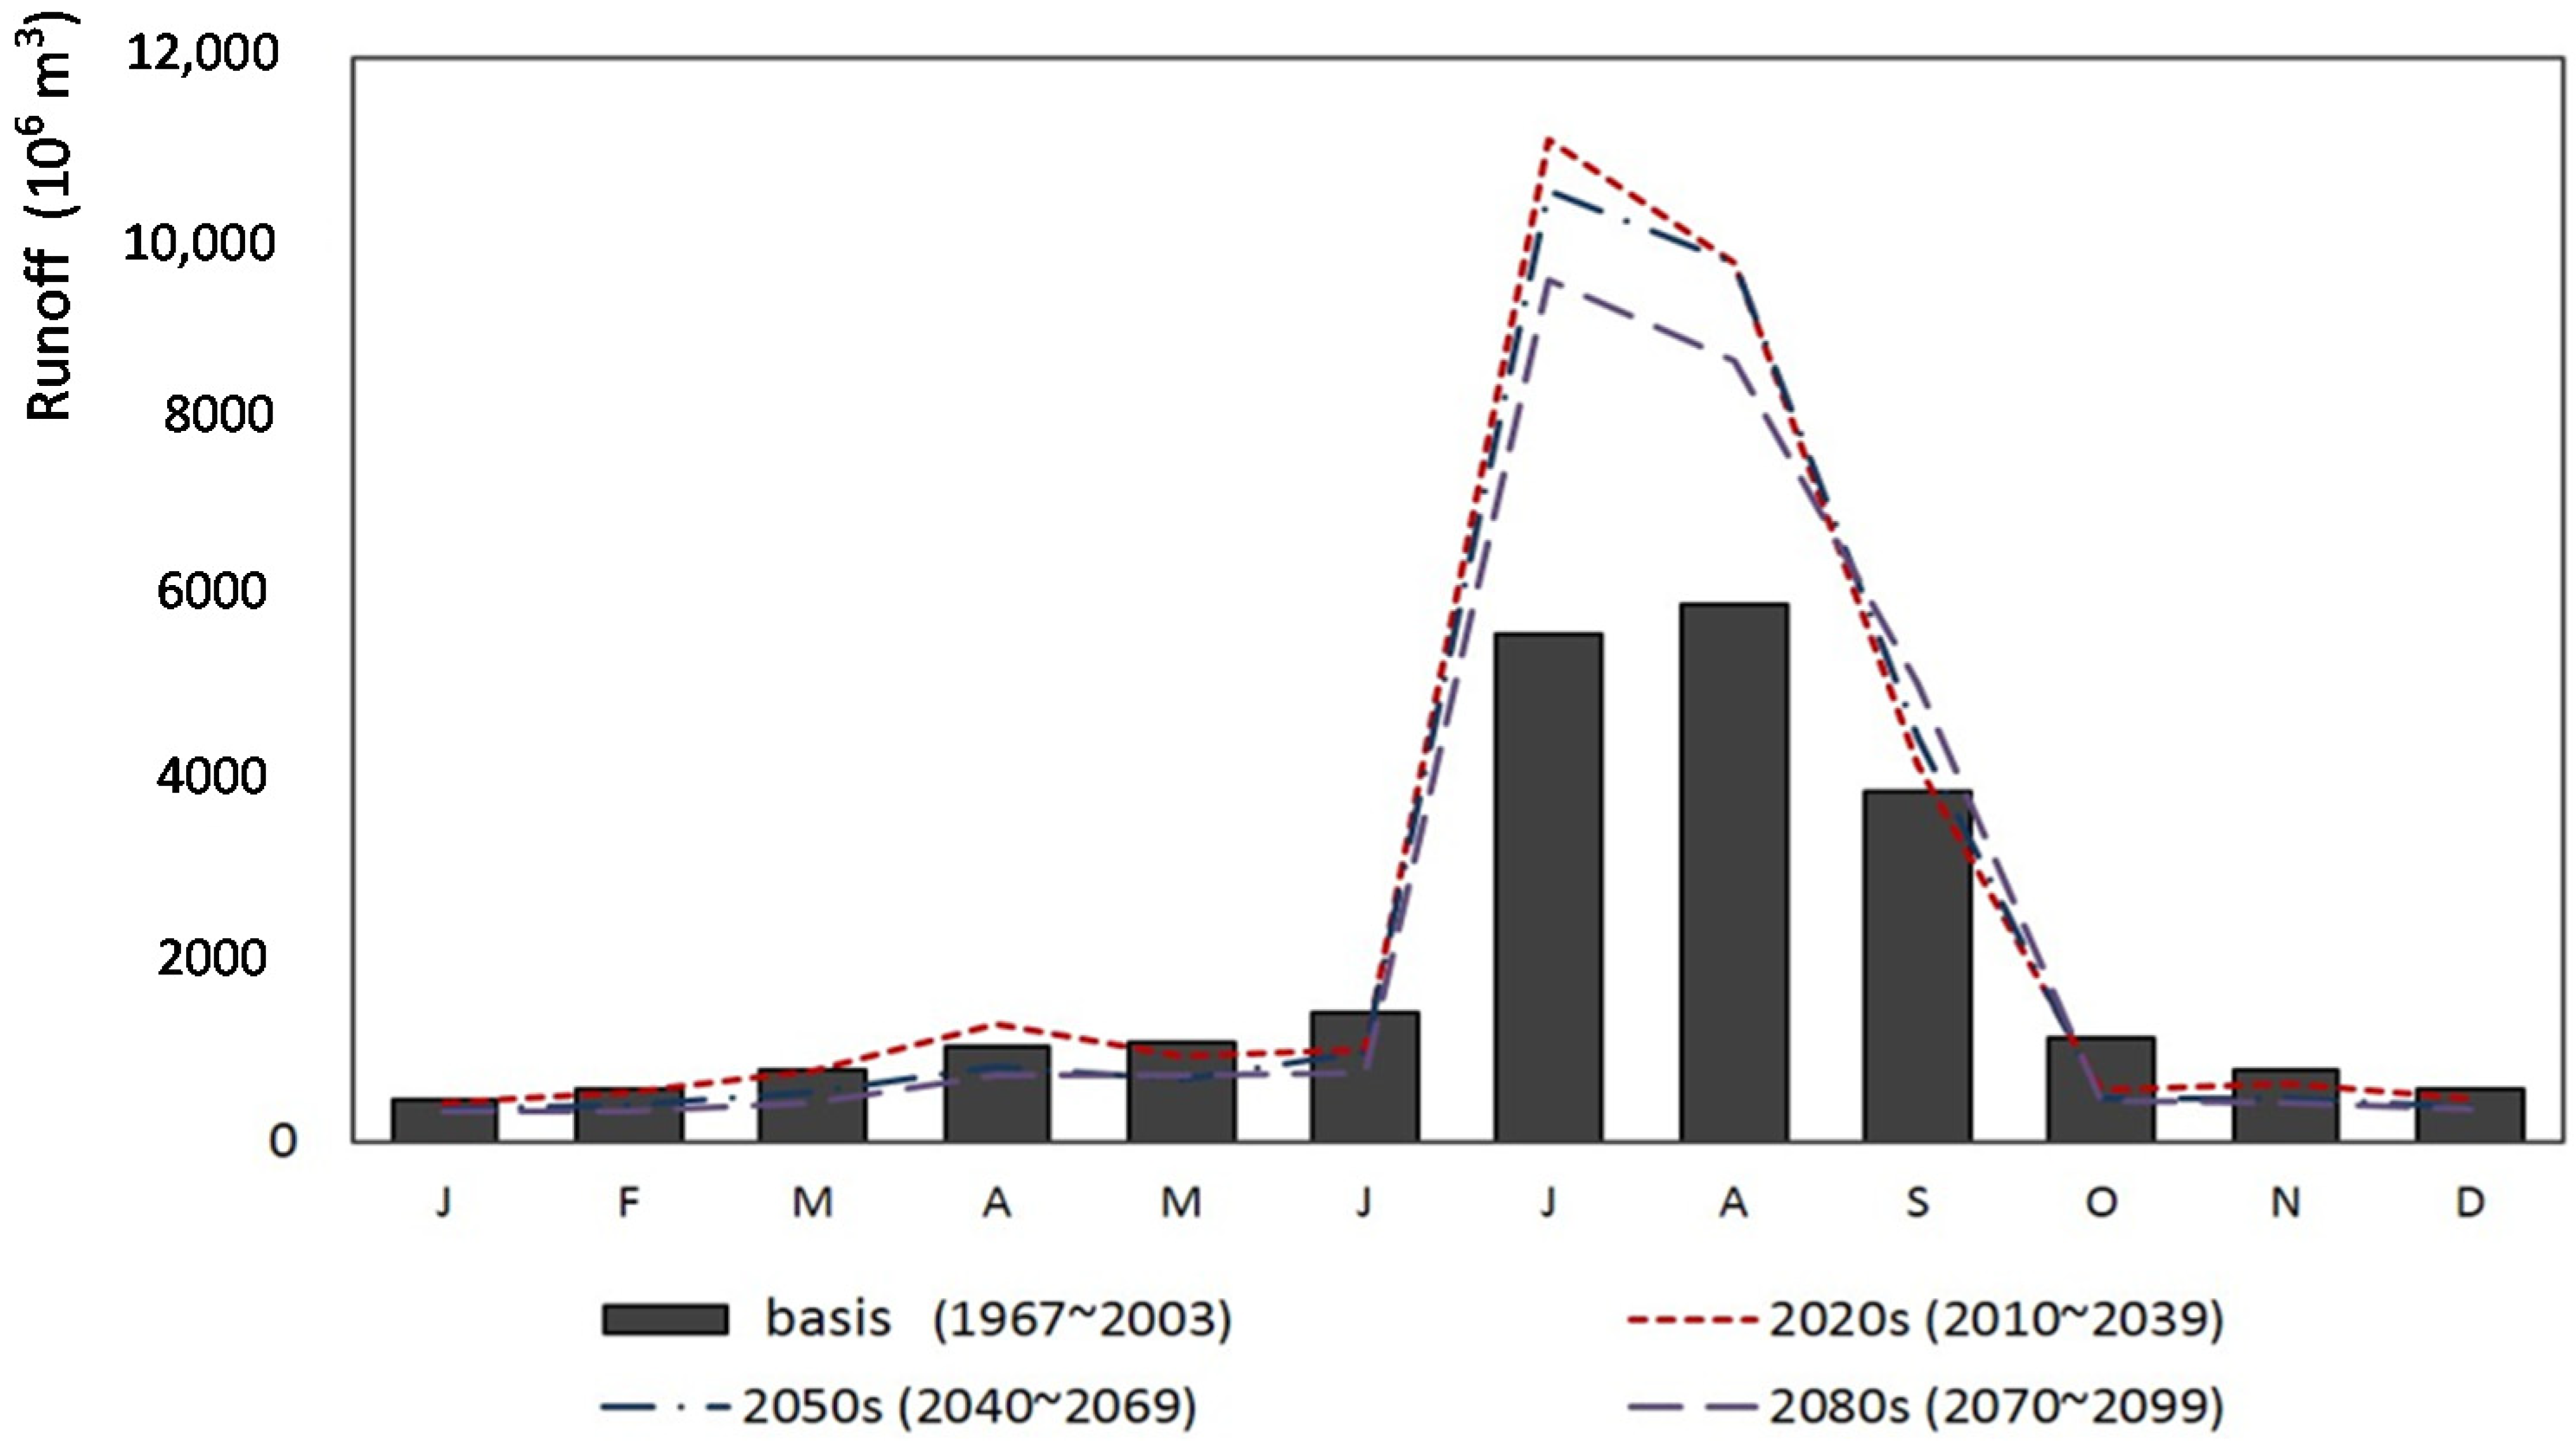
3.1. Flow Projections
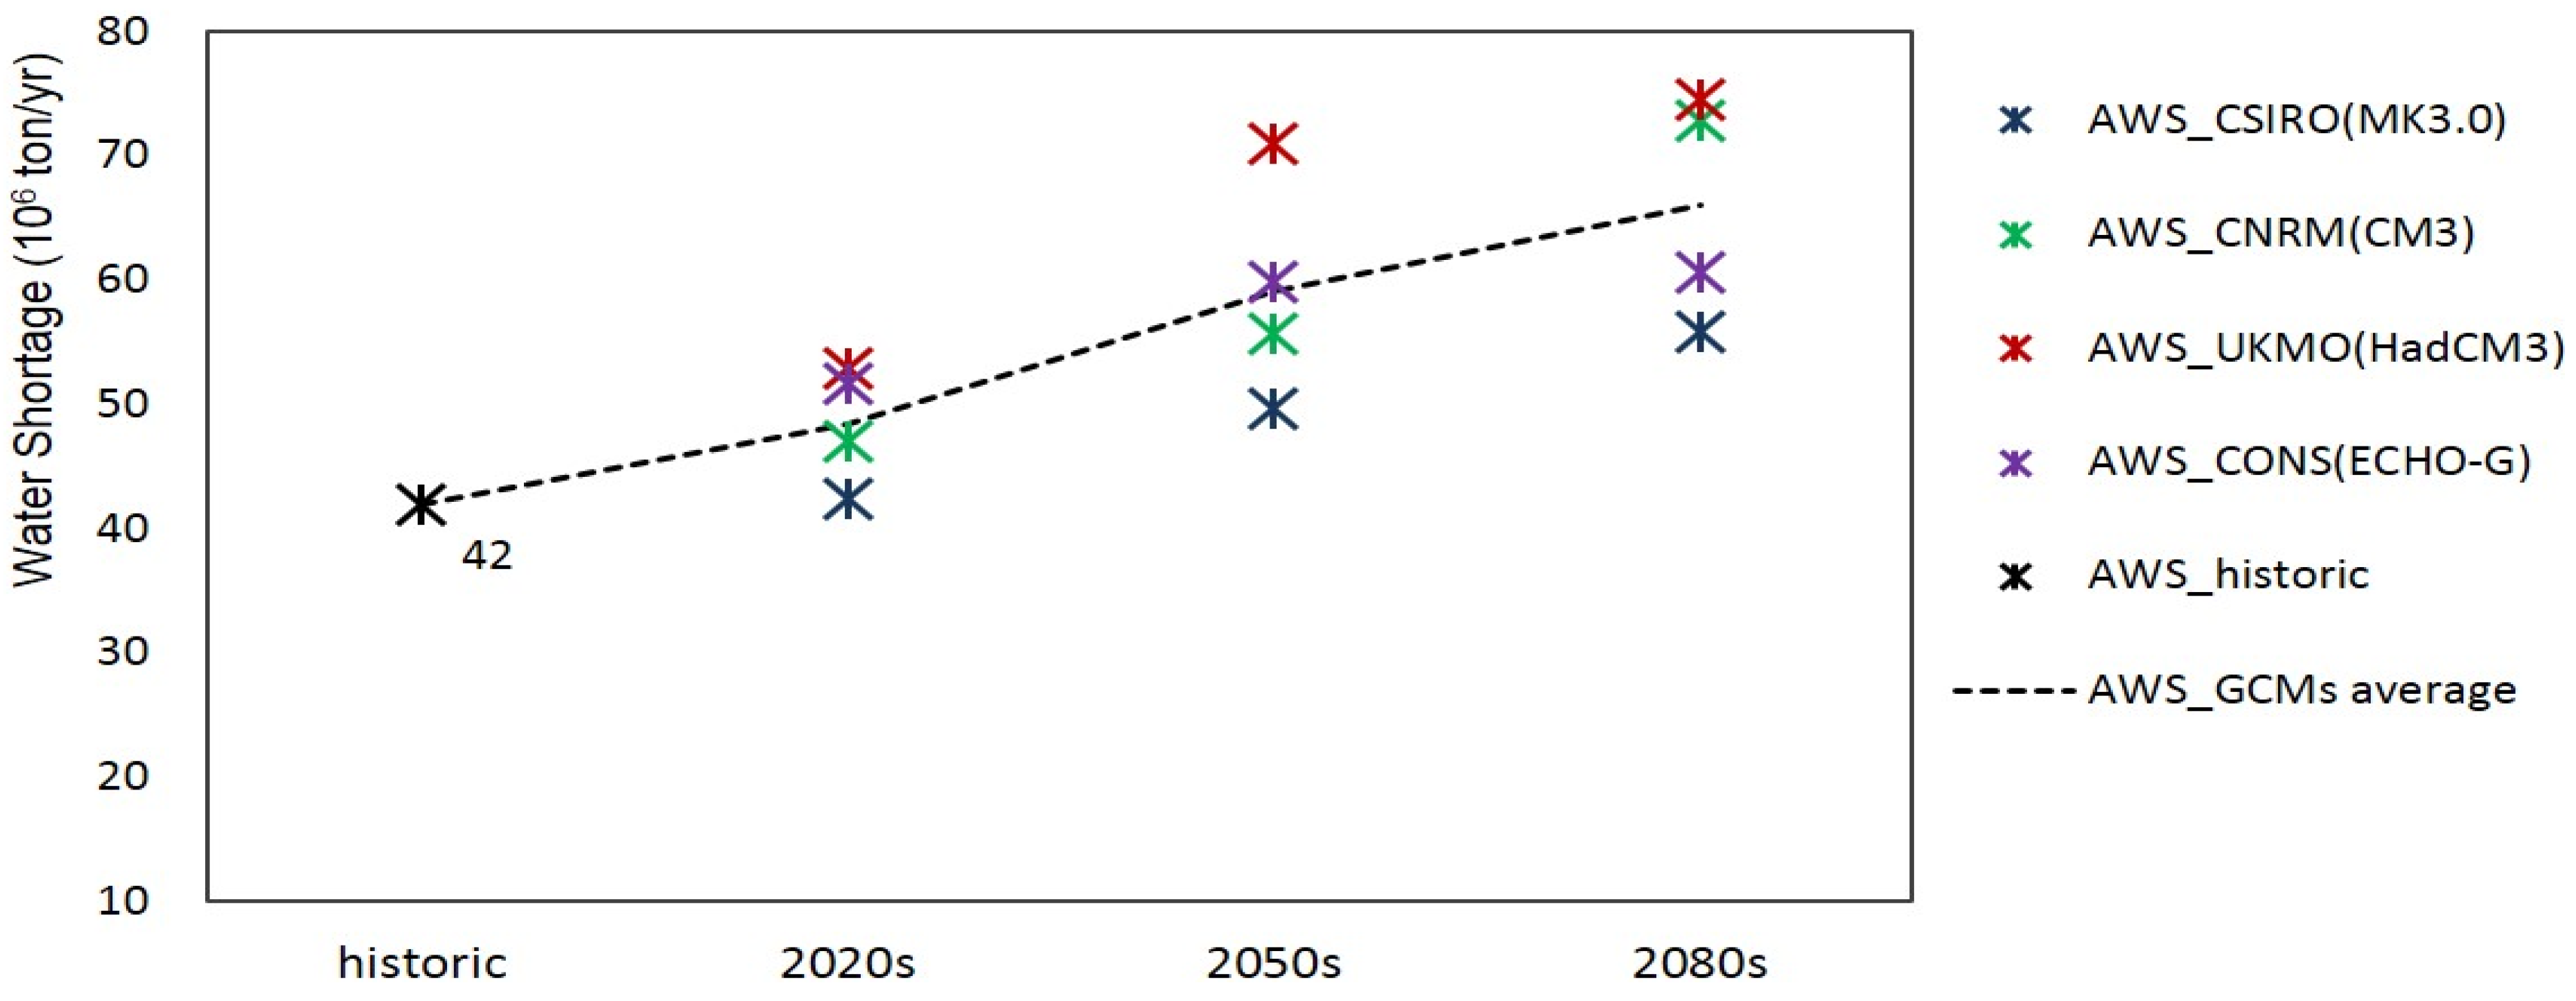
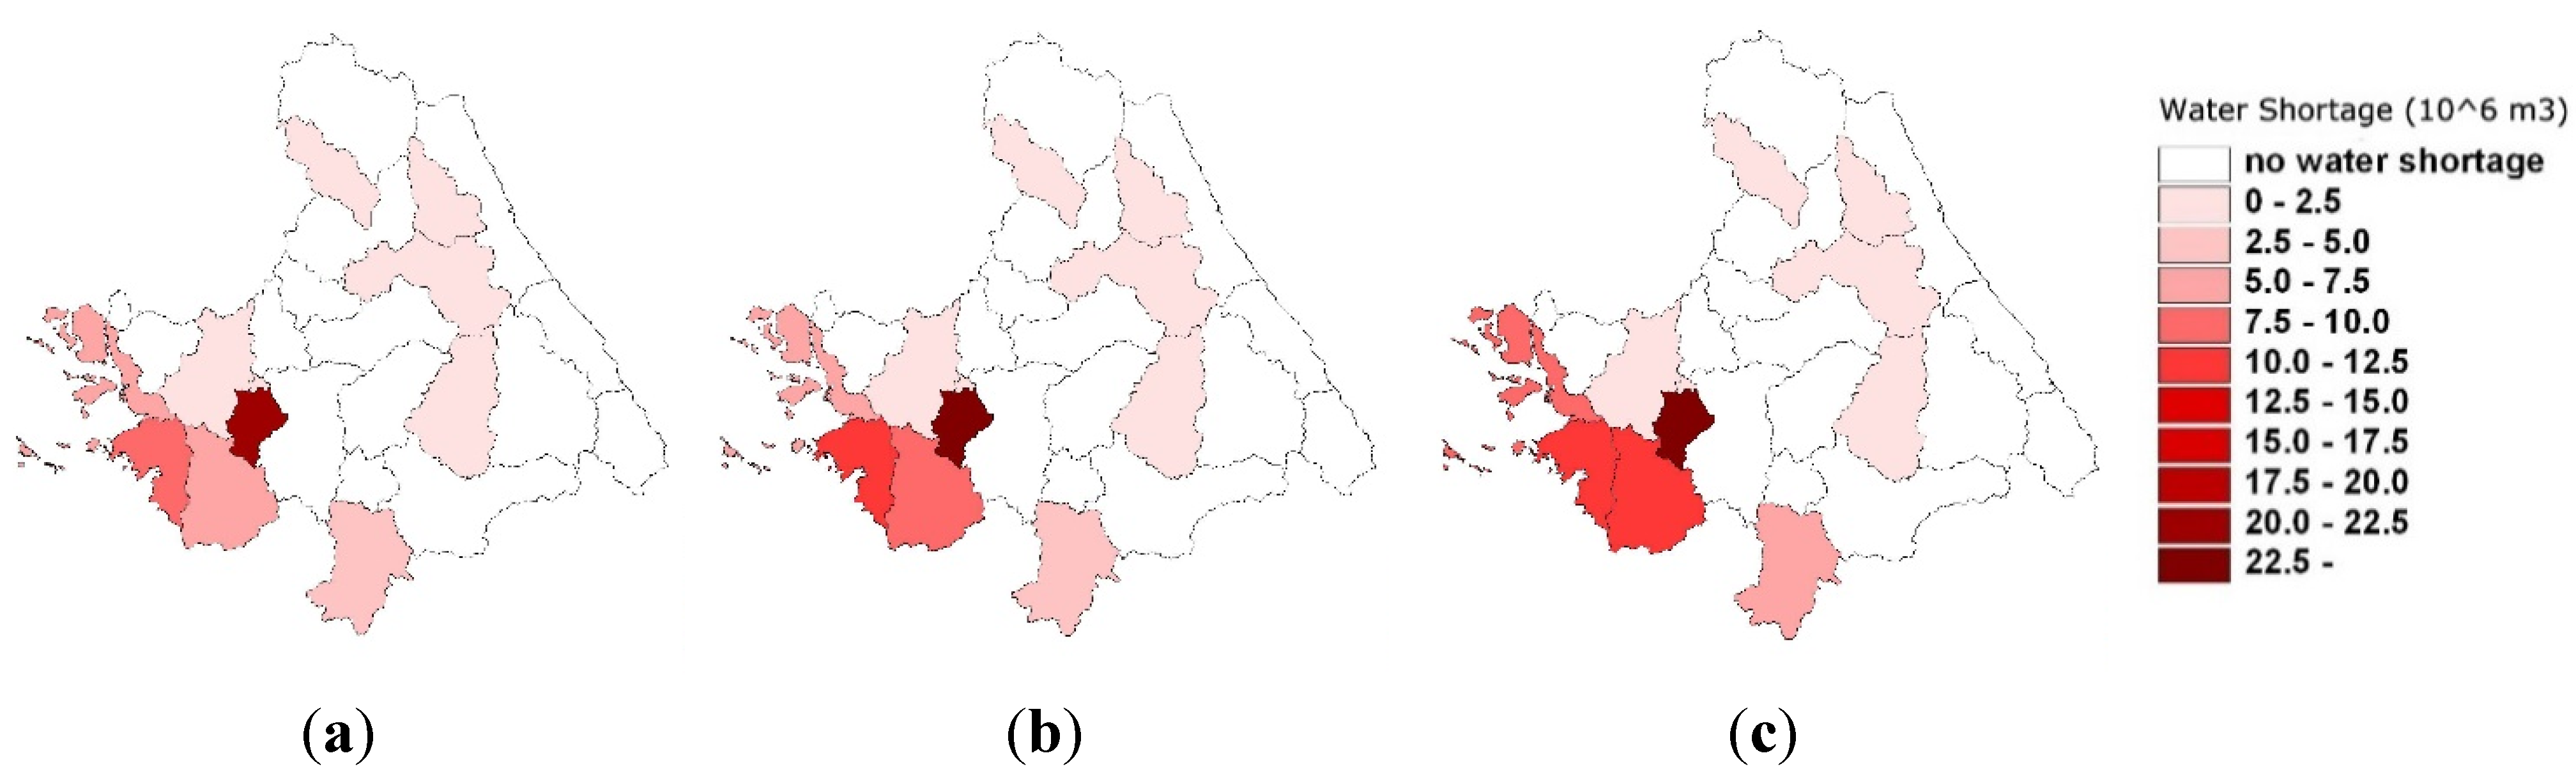
3.2. Water Shortage Projections


| Water Vision 2020 a (Target Year: 2020) | Future Projection | |||
|---|---|---|---|---|
| GCM Models | 2020s | 2050s | 2080s | |
| 42.0 | CSIRO: MK3.0 | 42.3 | 49.6 | 55.8 |
| CNRM: CM3 | 47.1 | 55.7 | 72.8 | |
| UKMO: HadCM3 | 52.9 | 70.9 | 74.6 | |
| CONS: ECHO-G | 51.6 | 59.8 | 60.6 | |
| Average | 48.5 | 59.0 | 65.4 | |
| (increase ratio from the current) | (15% ↑) | (40% ↑) | (56% ↑) | |


3.3. Comparison with the Previous Methodology
4. Conclusions
| Water Vision 2020 a (Target Year: 2020) | Future Projection (Target Period: 2020s) | ||
|---|---|---|---|
| GCM Models | Proposed Methodology | Previous Methodology b | |
| 42.0 | CSIRO: MK3.0 | 42.3 | 63.5 |
| CNRM: CM3 | 47.1 | 17.4 | |
| UKMO: HadCM3 | 52.9 | 137.6 | |
| CONS: ECHO-G | 51.6 | 192.2 | |
| Average | 48.5 | 102.7 | |
| (increase ratio from the current) | (15% ↑) | (144% ↑) | |
Acknowledgments
Author Contributions
Conflicts of Interest
References
- Milly, P.C.D.; Betancourt, J.; Falkenmark, M.; Hirsch, R.M.; Kundzewicz, Z.W.; Lettenmaier, D.P.; Stouffer, R.J. Stationarity is dead: Whither water management? Science 2008, 319, 573–574. [Google Scholar] [CrossRef] [PubMed]
- Christensen, N.S.; Wood, A.W.; Voison, N.; Lettenmaier, D.P.; Palmer, R.N. The effect of climate change on the hydrology and water resources of the Colorado River Basin. Clim. Chang. 2004, 62, 337–363. [Google Scholar] [CrossRef]
- Medellin-Azuara, J.; Harou, J.J.; Olivares, M.A.; Madani, K.; Lund, J.R.; Howitt, R.E.; Tanaka, S.K.; Jenkins, M.W.; Zhu, T. Adaptability and adaptations of California’s water supply system to dry climate warming. Clim. Chang. 2008, 87, 75–90. [Google Scholar] [CrossRef]
- Minville, M.; Brissette, F.; Leconte, R. Impacts and uncertainty of climate change on water resource management of the Peribonka River System (Canada). J. Water Resour. Plan. Manag. 2010, 136, 376–385. [Google Scholar] [CrossRef]
- Islam, M.S.; Aramaki, T.; Hanaki, K. Development and application of an integrated water balance model to study the sensitivity of the Tokyo Metropolitan area water availability scenario to climate changes. Water Resour. Manag. 2005, 19, 423–445. [Google Scholar] [CrossRef]
- Vicuna, S.; Maurer, E.P.; Joyce, B.; Dracup, J.A.; Purkey, D. The sensitivity of California water resources to climate change scenarios. J. Am. Water Resour. Assoc. 2007, 43, 482–498. [Google Scholar] [CrossRef]
- Hoff, H.; Swartz, C.; Yates, D.; Tielborger, K. Water management under extreme water scarcity: Scenario analyses for the Jordan River Basin, using WEAP21. Water Sav. Mediterr. Agric. Future Res. Needs 2007, 2, 321–331. [Google Scholar]
- Purkey, D.R.; Joyce, B.; Vicuna, S.; Hanemann, M.W.; Dale, L.L.; Yates, D.; Dracup, J.A. Robust analysis of future climate change impacts on water for agriculture and other sectors: A case study in the Sacramento Valley. Clim. Chang. 2008, 87, 109–122. [Google Scholar] [CrossRef]
- Wurbs, R.A.; Muttiah, R.S.; Felden, F. Incorporation of climate change in water availability modelling. J. Hydrol. Eng. 2005, 10, 375–385. [Google Scholar] [CrossRef]
- Fowler, H.J.; Kilsby, C.G.; Stunell, J. Modeling the impacts of projected future climate change on water resources in North-West England. Hydrol. Earth Syst. Sci. 2007, 11, 1115–1126. [Google Scholar] [CrossRef]
- Fujihara, Y.; Tanaka, K.; Watanabe, T.; Nagano, T.; Kojiri, T. Assessing the impacts of climate change on the water resources of the Seyhan River Basin in Turkey: Use of dynamically downscaled data for hydrologic simulations. J. Hydrol. 2008, 353, 33–48. [Google Scholar] [CrossRef]
- Kirono, D.G.C.; Podger, G.; Franklin, W.; Siebert, R. Climate change impact on rous water supply. J. Aust. Water Assoc. 2007, 34, 68–72. [Google Scholar]
- Vano, J.A.; Scott, M.; Voisin, N.; Stockle, C.O.; Hamlet, A.F.; Mickelson, K.E.B.; Elsner, M.M.; Lettenmaier, D.P. Climate change impacts on water management and irrigated agriculture in the Yakima River Basin, Washington, USA. Clim. Chang. 2010, 102, 287–217. [Google Scholar] [CrossRef]
- Zhu, T.; Ringler, C. Climate change impacts on water availability and use in the Limpopo River Basin. Water 2012, 4, 63–84. [Google Scholar] [CrossRef]
- Kim, S.J.; Kim, B.S.; Jun, H.D.; Kim, H.S. The evaluation of climate change impacts on the water scarcity of the Han River Basin in South Korea using high resolution RCM data. J. Korea Water Resour. Assoc. 2010, 42, 295–308. (In Korean) [Google Scholar] [CrossRef]
- Kang, S.U.; Rieu, S.Y.; Cheong, T.S.; Ko, I.H. Evaluation water resources in Geum River Basin using generalized water budget analysis model. In Proceedings of the Korea Society of Civil Engineers Conference, Gwangju, Korea, 11 October 2006; Volume 10, pp. 1653–1656. (In Korean)
- Choi, S.J.; Kim, J.H.; Lee, D.Y. Decision of the water shortage mitigation policy using multi-criteria decision analysis. KSCE J. Civ. Eng. 2012, 16, 247–253. [Google Scholar] [CrossRef]
- Ministry of Construction and Traffic. National Water Resources Plan (2006–2020); Ministry of Construction and Transportation: Gwacheon, Korea, 2006. (In Korean)
- Kim, Y.O.; Lee, J.K. Addressing heterogeneities in climate change studies for water resources in Korea. Curr. Sci. 2010, 98, 1077–1083. [Google Scholar]
- Groves, D.G.; Yates, D.; Tebaldi, C. Developing and applying uncertain global climate change projections for regional water management planning. Water Resour. Res. 2008, 44, W12413. [Google Scholar] [CrossRef]
- Sharif, M.; Burn, D.H. Simulating climate change scenarios using an improved K-nearest neighbor model. J. Hydrol. 2006, 325, 179–196. [Google Scholar] [CrossRef]
- Yates, D. A Technique for generating regional climate scenarios using a nearest-neighbor algorithm. Water Resour. Res. 2003, 39, W1199. [Google Scholar] [CrossRef]
- Ministry of Construction and Traffic. National Water Resources Security against Climate Change; Ministry of Land, Transport and Maritime Affairs: Sejong Special Autonomous City, Korea, 2009. (In Korean)
- Korea Institute of Construction Technology. K-WEAP User Guide; Korea Institute of Construction Technology: Goyang, Korea, 2005. (In Korean) [Google Scholar]
- Lee, J.K. Scenario selection and uncertainty quantification for climate change impact assessments in water resources. In Doctoral Dissertation; Seoul National University: Seoul, Korea, 2013. (In Korean) [Google Scholar]
- IPCC Data Distribution Centre: Climate Model Output—AR4 (2007): SRES Scenarios. Available online: http://www.ipcc-data.org/sim/gcm_monthly/SRES_AR4/index.html (accessed on 15 May 2015).
- Bae, D.H.; Jung, I.W.; Lee, B.J. Outlook on variation of water resources in Korea under SRES A2 scenario. J. Korean Water Resour. Assoc. 2007, 40, 921–930. (In Korean) [Google Scholar] [CrossRef]
- Wiley, M.W. Analysis Techniques to Incorporate Climate Change Information into Seattle’s Long Range Water Supply Planning. M.Sc. Thesis, University of Washington, Seattle, WA, USA, 2004. [Google Scholar]
- Hamlet, A.F.; Lettenmaier, D.P. Effects of climate change on hydrology and water resources objectives in the Columbia River Basin. J. Am. Water Resour. Assoc. 1999, 35, 1597–1624. [Google Scholar] [CrossRef]
- Hashino, T.; Bradley, A.A.; Schwartz, S.S. Evaluation of bias-correction methods for ensemble streamflow volume forecasts. Hydrol. Earth Syst. Sci. 2007, 11, 939–950. [Google Scholar] [CrossRef]
- Wood, A.W.; Maurer, E.P.; Kumar, A.; Lettenmaier, D.P. Long-range experimental hydrologic forecasting for the Eastern United States. J. Geophys. Res. Atmos. 2002, 107, 4429–4443. [Google Scholar] [CrossRef]
- Ines, A.V.M.; Hansen, J.W. Bias correction of daily GCM rainfall for crop simulation studies. Agric. For. Meteorol. 2006, 138, 44–53. [Google Scholar] [CrossRef]
- Fabre, J.; Ruelland, D.; Dezetter, A.; Grouillet, B. Simulating past changes in the balance between water demand and availability and assessing their main drivers at the river basin scale. Hydrol. Earth Syst. Sci. 2015, 19, 1263–1285. [Google Scholar] [CrossRef]
- Koutroulis, A.G.; Tsanis, I.K.; Daliakopoulos, I.N.; Jacob, D. Impact of climate change on water resources status: A case study for Crete Island, Greece. J. Hydrol. 2013, 479, 146–158. [Google Scholar] [CrossRef]
© 2015 by the authors; licensee MDPI, Basel, Switzerland. This article is an open access article distributed under the terms and conditions of the Creative Commons Attribution license (http://creativecommons.org/licenses/by/4.0/).
Share and Cite
Seo, S.B.; Kim, Y.-O.; Kim, C.-R. A New Way for Incorporating GCM Information into Water Shortage Projections. Water 2015, 7, 2435-2450. https://doi.org/10.3390/w7052435
Seo SB, Kim Y-O, Kim C-R. A New Way for Incorporating GCM Information into Water Shortage Projections. Water. 2015; 7(5):2435-2450. https://doi.org/10.3390/w7052435
Chicago/Turabian StyleSeo, Seung Beom, Young-Oh Kim, and Cho-Rong Kim. 2015. "A New Way for Incorporating GCM Information into Water Shortage Projections" Water 7, no. 5: 2435-2450. https://doi.org/10.3390/w7052435