

Abstract
It has been theoretically predicted that the thermoelectric properties of silicene can be enhanced by deforming its atomic structure. In CaSi2, calcium-intercalated layered silicene, the silicene structure of the metastable 3R phase is a deformed silicene structure of the stable 6R phase. In this paper, our first-principle calculation reveals that the Seebeck coefficient is enhanced by transformation from stable 6R- to metastable 3R-CaSi2. We experimentally enhance the Seebeck coefficient by endotaxially introducing metastable 3R-CaSi2 into single-crystalline 6R-CaSi2, leading to a high thermoelectric power factor. This study demonstrates that introducing the metastable phase can become an effective way to enhance the thermoelectric power factor.
Export citation and abstract BibTeX RIS
2D and layered materials, such as graphene, have been intensively studied in various fields due to their unique properties. 1–7) Silicene, a 2D honeycomb buckled structure of Si atoms, has a massless Dirac band and is attracting attention as a promising 2D material that can exceed the attributes of graphene because its electronic band structure can be manipulated by deforming this unique buckled structure in silicene. 4,6) Previous first-principle calculations revealed that various properties in silicene, such as carrier mobility, thermal conductivity and thermoelectric properties, could be enhanced due to the deformation of silicene structure by strain and defects. 8–11) Therefore, it is greatly awaited to experimentally demonstrate the enhancement of its electrical properties by deforming the silicene structure. However, this realization has not been achieved due to its instability in air and the difficulty of fabrication on an insulating substrate. 6,12) Therefore, recently, layered materials including silicene have been attracting attention as a stable layered silicene.
CaSi2, calcium-intercalated layered silicene, is a layered crystal composed of alternately-stacked silicene and Ca layers, 13–16) which shows higher oxidative resistance. The most stable phase of CaSi2 is known as 6R-CaSi2, which includes two types of silicene with higher and lower buckling heights, with values of 0.97 and 0.83 Å, respectively [Fig. 1(a)]. 16,17) Due to the high structural stability, it is difficult to deform the silicene structure in 6R-CaSi2. Recently, a fabrication technique using metastable 3R-CaSi2 was developed. 14,16,18,19) Metastable 3R-CaSi2 includes only one type of silicene with a higher buckling height (0.97 Å). 17) The two types of silicene in 6R-CaSi2 are each rotated by 60° on the plane, while the crystal orientation of silicene in 3R-CaSi2 is not rotated [Fig. 1(a)]. Thus, metastable 3R-CaSi2 can be considered a crystal structure having a deformed silicene structure compared to that of stable 6R-CaSi2. This implies that the electrical properties of 3R-CaSi2 vary from that of 6R-CaSi2. Actually, our calculation predicts that 3R-CaSi2 exhibits a higher Seebeck coefficient (S) than that of 6R-CaSi2, indicating that the electrical properties can be drastically changed by only sub-angstrom deformation of buckling height (Fig. 1). Therefore, we focus on the thermoelectric property enhancement related to the deformation of buckled structure in silicene by introducing metastable 3R-CaSi2 into stable 6R-CaSi2, with the aim of paving the way to eco-friendly Si-based thermoelectric material realization. 20–29)
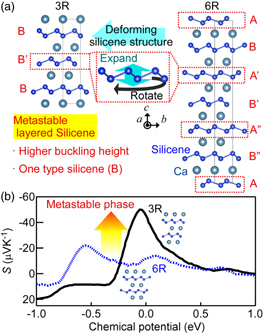
Fig. 1. (Color online) (a) Schematics of the crystal structures of 3R- and 6R-CaSi2 viewed along the [100] direction of CaSi2, illustrated by VESTA software. 30) Layers marked as A and B denote the silicenes with different crystal orientations and buckling heights. Black squares denote the unit cells of CaSi2. (b) Calculated S of 3R- and 6R-CaSi2 as a function of chemical potential.
Download figure:
Standard image High-resolution imageIn this study, we fabricate bulk 6R-CaSi2 containing metastable 3R-CaSi2 and then measure thermoelectric properties [S and electrical conductivity (σ)]. By introducing 3R-CaSi2 into 6R-CaSi2, the experimental S value along the direction parallel to the silicene layer is increased by a factor of ∼1.5. The calculation of energy dispersion relations reveals an originally high S value in 3R-CaSi2 with a different electronic band structure from that of 6R-CaSi2. The experiment observed that a larger S brings twice the enhancement of thermoelectric power factor (S2 σ) in the CaSi2 sample containing 9% 3R-CaSi2. This study demonstrates that introducing a metastable phase with a different silicene structure enhances the thermoelectric properties of stable calcium-intercalated layered silicene.
CaSi2 ingots were synthesized according to the following process. Ca (99.99 wt%) and Si (99.999 wt%) were mixed at the Ca/Si ratio of ∼0.5 in a Ta crucible under an argon atmosphere. The mixed source was melted by a high-frequency induction heating technique at 1353 K. Subsequently, it was cooled down to 773 K at various rates of ∼1–10 K min−1. After the temperature (T) reached 773 K, it was naturally cooled down to RT. Therein, samples with different phases were formed by cooling rate control: 10 K min−1 for the pure single-crystalline bulk 6R-CaSi2 (sample #1) and 1 K min−1 for the bulk 6R-CaSi2 containing metastable 3R-CaSi2 (sample #3). 16) As an additional sample with a different ratio of 3R-CaSi2 to 6R-CaSi2 structures, sample #2 was prepared by annealing sample #3 at 873 K for 30 min in a vacuum.
X-ray diffraction (XRD) measurement was carried out using Cu Kα line with a wavelength of 1.5406 Å (Rigaku RINT2200VK/PC). The σ and S were measured using ZEM-3 (ADVANCE RIKO) in the T range 300–573 K.
The electronic structures of 3R- and 6R-CaSi2 were computed using the Vienna ab initio simulation package (VASP) 31,32) with the Perdew–Burke–Ernzerhof (PBE) functional 33) [Fig. 2(a)]. Structure optimization was performed until the residual force was less than 0.01 eV Å−1. With these settings, the lattice constants of 3R- and 6R-CaSi2 were calculated to be a = 3.842 Å, c = 15.854 Å and a = 3.877 Å, c = 30.371 Å, respectively. These values were consistent with the previous calculations 34–36) and experimental result. 18) For the calculation of thermoelectric properties, the electronic structures were recomputed on dense k-mesh of 480 × 480 × 120 and 480 × 480 × 60 for 3R- and 6R-CaSi2, respectively, by employing the Wannier interpolation technique implemented in the Wannier90 package. 37) As shown in Fig. 2(a), there was no difference between the energy dispersion relations computed by Wannier90 and by VASP, demonstrating the high reproducibility of the energy dispersion relation computed by Wannier90. The thermoelectric properties were calculated by introducing the computed energy dispersion into the BoltzWann module integrated in the Wannier90 package. 38) The transport properties were calculated using a Boltzmann transport equation under the constant relaxation time approximation.
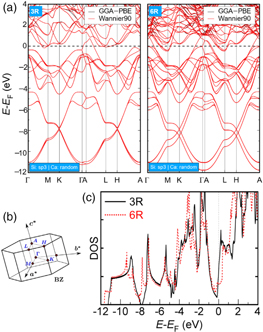
Fig. 2. (Color online) (a) Energy dispersion relations of 3R- (left panel) and 6R-CaSi2 (right panel) computed by two methods: (1) Vienna ab initio simulation package (VASP) with the Perdew–Burke–Ernzerhof (PBE) functional (GGA-PBE: black solid line); (2) interpolated bands by using the Wannier interpolation technique implemented in the Wannier90 package (Wannier90: red line). (b) Brillouin zone. (c) Density of state of 3R- (black solid line) and 6R-CaSi2 (red dotted line) calculated using VASP.
Download figure:
Standard image High-resolution imageAs shown in Figs. 2(a) and 2(b), it was confirmed that both 3R- and 6R-CaSi2 have semimetal band structures. A closer look near E-EF = 0 (E: carrier energy, EF: Fermi level) shows that the bands with electron pockets of 3R-CaSi2 near M and L points are uplifted compared with those of 6R-CaSi2. Previous studies revealed that these bands with electron pockets are formed by the hybridization of Ca and Si bands. 39) Therefore, the hybridization makes these electron bands different in 3R- and 6R-CaSi2, which have different silicene structures [Fig. 1(a)]. On the other hand, the tops of the valence bands of 3R-CaSi2 near EF in the Γ-M, K-Γ and H-A regions move downwards from EF compared with those of 6R-CaSi2. Therefore, it is considered that the hole concentration in 3R-CaSi2 is smaller than that of 6R-CaSi2. In CaSi2 with the negative sign of the Seebeck coefficient [Fig. 1(b)], the dominant carrier for transport is electrons. Then, it is considered that the contribution of bipolar conduction 27) in 3R-CaSi2 is smaller than that in 6R-CaSi2. This indicates that 3R-CaSi2 likely has a higher S than 6R-CaSi2. Figure 2(c) shows the density of states (DOSs) in 3R- (black solid line) and 6R-CaSi2 (red dotted line). Both 3R- and 6R-CaSi2 have steep stair-like DOSs near EF, which are beneficial for high S. The stair-like DOS also exists at E-EF ∼−1 eV, originating from flat bands at ∼−1 eV in the Γ-A region, indicating the quasi-2D property in CaSi2. Thus, it is found that both 3R- and 6R-CaSi2 have quasi-2D DOS that can bring high S. In addition, 3R-CaSi2 likely has higher S than 6R-CaSi2 because of the smaller contribution of bipolar conduction as mentioned above.
Figure 3 shows an XRD 2θ-ω scan of three CaSi2 samples. The 2θ-ω scan of sample #1 displays the diffraction peaks from the (00l) planes (l = 6, 9, 12, 15, 18) of 6R-CaSi2 without those originating from 3R-CaSi2 (squares), whereas samples #2 and #3 exhibit diffraction peaks from the (00l) planes of 3R-CaSi2 (triangles) in addition to those of 6R-CaSi2. In order to acquire the mixing ratio of 3R- and 6R-CaSi2 in each sample quantitatively, reciprocal space mappings (RSMs) were obtained around 00 126R-CaSi2 : 2θ of 33.0–36.0 degrees and Δω of −7 − +7 degrees [Figs. 4(a)–4(c)]. A single peak of 00 126R-CaSi2 was observed in sample #1 [Fig. 4(a)], while diffraction peaks of 00 126R-CaSi2 and 0063R-CaSi2 were observed in sample #2 [Fig. 4(b)] and sample #3 [Fig. 4(c)]. Several 0063R-CaSi2 peaks were observed in sample #3, unlike in sample #2 with a single 0063R-CaSi2 peak. This indicates that 3R-CaSi2 crystals were introduced into 6R-CaSi2 endotaxially in sample #2, 40,41) and that 3R-CaSi2 inclusions in sample #3 were poorly endotaxially introduced because the transformation from 6R- to 3R-CaSi2 with high controllability is very difficult. We analyzed the integrated peak intensities of 3R- and 6R-CaSi2 (I3R and I6R) in RSMs and estimated the mixing ratio of 3R structures as RM = I3R/(I3R + I6R), as shown in Fig. 4(d). As a result, it was found that samples #1–3 had RM values of 0%, 9% and 29%, respectively. The fact that sample #2 had smaller RM values than sample #3 indicated that vacuum annealing decreased the amount of the metastable 3R-CaSi2. 16) Thus, CaSi2 samples with different RM values were formed.
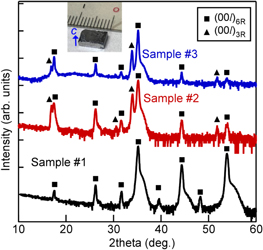
Fig. 3. (Color online) 2θ-ω scan of samples #1–3. Inset image shows the fabricated bulk CaSi2. Solid squares and triangles denote diffraction peaks from (00l) planes of 6R- and 3R-CaSi2, respectively.
Download figure:
Standard image High-resolution image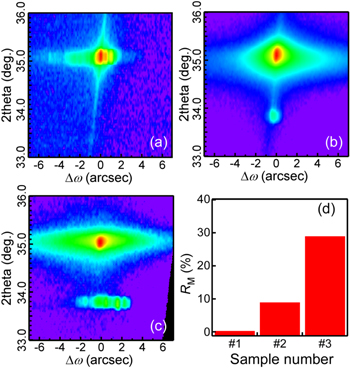
Fig. 4. (Color online) (a)–(c) RSMs around the 00 126R-CaSi2 peak of samples #1–3: (a) sample #1, (b) sample #2 and (c) sample #3. (d) RM values defined as I3R/(I3R + I6R).
Download figure:
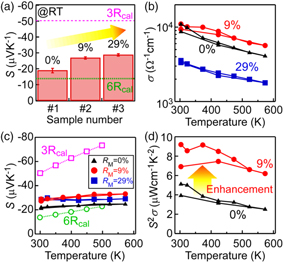
Standard image High-resolution imageFigure 5(a) reveals that both CaSi2 samples with RM of 9% and 29% exhibited about 1.5 times higher S values than the CaSi2 sample with RM of 0%. The calculated S values of 3R- (dashed line) and 6R-CaSi2 (dotted line) at the chemical potential of 0 eV at 300 K are also plotted in Fig. 5(a). Based on this calculation, it is predicted that 3R-CaSi2 has a higher S than 6R-CaSi2 [Fig. 1(b)]. While the S value of the 6R-CaSi2 sample (RM = 0%) was close to the calculated value of 6R-CaSi2, the S of samples with RM = 9% and 29% were higher. This S enhancement is possibly caused by the introduction of 3R-CaSi2 with higher S.
Fig. 5. (Color online) (a) S in samples #1–3 at RT with RM values. Calculated S values of 3R- and 6R-CaSi2 are displayed by dashed and dotted lines, respectively. Bars are statistical errors of multiple measurements. (b, c) T dependences of (b) σ and (c) S in samples #1–3 in the T range 300–573 K. Samples #1–3 are the CaSi2 samples with RM of 0%, 9% and 29%, respectively. In (c), the calculated S values of 3R- (open squares) and 6R-CaSi2 (open circles) at E-EF = 0 are also plotted. (d) T dependences of S2 σ in samples #1 and #2 in the T range 300–573 K.
Download figure:
Standard image High-resolution image
Figures 5(b) and 5(c) show T dependences of σ and S in the CaSi2 samples, respectively. The thermoelectric properties were measured along the direction parallel to the silicene layer. The decreasing tendency of σ against T indicated that the electrical conduction of all the CaSi2 samples was metal-like. Sample #2 with RM of 9% exhibited almost the same σ value as sample #1 with RM of 0%, namely single-phase 6R-CaSi2, which came from the endotaxial introduction of 3R-CaSi2 in sample #2. On the other hand, the σ value of sample #3 with RM of 29% was less than half the value of the other two samples. This σ degradation is likely attributed to the poor endotaxial introduction of 3R-CaSi2 in sample #3 with an RM of 29%, unlike sample #2 with an RM of 9% as mentioned above [Fig. 4(c)]. The endotaxial introduction of metastable phase is key for high σ.
Figure 5(c) shows that the S values of CaSi2 with RM of 0% were similar to the calculated ones in the entire T range. On the other hand, the samples with RM of 9% and 29% exhibited higher S values than sample #1 with an RM of 0% and the calculated ones of 6R-CaSi2, although the S values of the samples with RM of 9% and 29% were lower than the calculated ones of 3R-CaSi2. This highlights that S of 6R-CaSi2 is increased by introducing metastable 3R-CaSi2 with a higher S than that of 6R-CaSi2. Another effect for S enhancement might be the boundary effect between two phases, such as the energy filtering effect. 42,43) However, the introduction of 3R-CaSi2 with higher S into 6R-CaSi2 is an effective way to enhance S. As a result of this S enhancement, sample #2 with an RM of 9% exhibited the maximum S2 σ (9.2 μWcm−1K−2) in Fig. 5(d) near RT. This value was twice as high as the S2 σ of the single-crystalline 6R-CaSi2 sample (RM = 0%). These results demonstrate that the endotaxial introduction of metastable 3R-CaSi2 into 6R-CaSi2 matrix enhances thermoelectric properties.
In conclusion, we fabricated bulk 6R-CaSi2 containing metastable 3R-CaSi2 with a different silicene structure to that of stable 6R-CaSi2. The endotaxial introduction of 3R-CaSi2 into 6R-CaSi2 enhanced the S value by a factor of ∼1.5 and kept the σ value along the direction parallel to the silicene layer. The calculation of energy dispersion relations revealed an originally high S value in 3R-CaSi2 with different electronic band structure to 6R-CaSi2. The experiment observed S enhancement resulted in twice the enhancement of S2 σ. This study demonstrated that endotaxially introducing metastable phase enhances thermoelectric properties in stable calcium-intercalated layered silicene. This paves the way to the realization of eco-friendly silicene thermoelectric material.
Acknowledgments
This work was supported by a Grant-in-Aid for Scientific Research A (Grant No. 19H00853), Exploratory Research (Grant No. 19K22110) and JSPS Research fellow (Grant No. 20J10412) from JSPS KAKENHI, Japan. Part of the reciprocal space mapping in this work was supported by the "Nanotechnology Platform Project (Nanotechnology Open Facilities in Osaka University)" of the Ministry of Education, Culture, Sports, Science and Technology, Japan (Grant No. S-19-OS-0033).