
Abstract
Over the last few years, microblogging has gained prominence as a form of personal broadcasting media where information and opinion are mixed together without an established order, usually tightly linked with current reality. Location awareness and promptness provide researchers using the Internet with the opportunity to create “psychological landscapes”—that is, to detect differences and changes in voiced (twittered) emotions, cognitions, and behaviors. In our article, we present iScience Maps, a free Web service for researchers, available from http://maps.iscience.deusto.es/ and http://tweetminer.eu/. Technologically, the service is based on Twitter’s streaming and search application programming interfaces (APIs), accessed through several PHP libraries, and a JavaScript frontend. This service allows researchers to assess via Twitter the effect of specific events in different places as they are happening and to make comparisons between cities, regions, or countries regarding psychological states and their evolution in the course of an event. In a step-by-step example, it is shown how to replicate a study on affective and personality characteristics inferred from first names (Mehrabian & Piercy, Personality and Social Psychology Bulletin, 19, 755–758 1993) by mining Twitter data with iScience Maps.Results from the original study are replicated in both world regions we tested (the western U.S. and the U.K./Ireland); we also discover base rate of names to be a confound that needs to be controlled for in future research.
Introduction
iScience Maps for Twitter is a set of Web applications designed to help researchers interested in social media analysis—specifically, mining the billions of “tweets” (brief written messages) on Twitter that are written every month, for scientific research. The Web service is available from http://maps.iscience.deusto.es/ and http://tweetminer.eu/.
Social media
a category of Web services that have recently attracted millions of Internet users, have become interesting resources for social-behavioral research. From the traces of information created by the behavior of the masses, the “wisdom of the crowds” emerges. For example, David Crandall and colleagues from Cornell University created maps of world regions from ca. 35 million geotagged photos that had been uploaded to flickr, a social media platform for the exchange of pictures and attached tags (Barras, 2009). These maps show relative interest in motifs and places and may lead to applications in tourism, city planning, ecology, and economics (Reips, in press). City planners may trace such behaviorally driven location maps over long periods and, thus, identify areas to be made accessible via public transportation. In a similar vein, the “wisdom of the crowds of researchers” has been used to identify “hot topics” in psychological research. Reips (2007, in press) reported such analyses from titles and topics of studies on the Web experiment list and the Web survey list, two free Web services for researchers that help in the recruitment of participants and in the archiving of studies (see http://wexlist.net; Reips & Lengler, 2005).
is a Web application where users can post text-based messages of up to 140 characters, called tweets. Apart from this microblogging service, Twitter also works as a social network, allowing its users to follow other users, group them in lists, forward other users’ messages (retweet, in Twitter terminology), or send private messages. Figure 1 shows the Twitter Web site.

The Twitter Website
Twitter has more than 145 million registered users (Van Grove, 2010) and produces a large amount of information each day, 155 million tweets per day (Garrett, 2011). Thus, it is nearly impossible to capture all this information, due to limitations of bandwidth, storage, and rate. The percentage of tweets that contain information about the sender’s location is increasing but still very small (0.23% in January 2010, 0.6% in June 2010). However, rough location can often be inferred from a user’s profile. An analysis of this information by Semiocast (2010) shows large differences of Twitter use between world regions and countries. More than 25% of tweets are generated in the U.S., followed by Japan (18%), Indonesia (12%), Brazil (11%), and the U.K. (6%). About 37% of tweeting happens in Asia, 31% in North America, 15% in South America, 14% in Europe, and about 1.5% each in Africa and Oceania.
Simple Twitter search is available in many browsers and online applications. Such search services are available from Twitter directly or via the Twitter application programming interfaces (APIs).Footnote 1 For instance, Fig. 2 shows a Twitter service that is integrated with a Web browser interface. It automatically searches Twitter space for tweets related to the content of the Website currently on display (in this example, Google search results for “SCiP”) and general trends in Twitter space. Simple Twitter search in the form of monitoring certain terms has been used in research on elections (Mislove, Lehmann, Ahn, Lazer, Lin, Onnela, & Rosenquist, 2010; see http://election.ccs.neu.edu/).

Twitter service that is integrated with a Web browser interface. It automatically searches Twitter space for tweets related to the content of the Website currently on display (in this example, Google search results for “SCiP”) and general trends in Twitter space
Using iScience maps
We developed iScience Maps mainly to implement comparative searches of Twitter space. In iScience Maps, it is possible to combine terms, using Boolean operators, and to compare searches for different locations. The results from some types of searches are visualized on maps—hence, the name “iScience Maps.” The advances implemented in iScience Maps further include the option to download results in several formats. Generally, the tool is targeted at behavioral researchers, while almost all other available tools are designed for personal Twitter users, marketing purposes, or the simple search described above.
Upon arriving at the site, the “Home” tab is displayed (Fig. 3). Here, the visitor finds a description of the site and brief instructions on how to use it. Using tabs, the visitor can move to the two main types of searches, global search and local search, and to an “About” tab. In the present section, we explain how to use the global and local search features available in iScience Maps, using step-by-step examples.

iScience Maps site at http://maps.iscience.deusto.es/ and http://tweetminer.eu/
Global search
Figure 4 shows the screen visible to the site’s visitor in “Global Search”—in this case, after a search for the term “wikileaks” for a date range from October 30 to December 30 of 2010. Any dot in the resulting world map can be clicked to summon a pop-up window with further information about tweets and location. There is also an option for selecting the number of intervals within the selected date range that is used by iScience Maps to play a movie to the user that shows the development over time. In the given example, which the reader may execute and verify at the iScience Maps Website, the frequency of tweets changed dramatically when WikiLeaks suddenly made the headlines all over the world. Figure 4 shows the seventh interval out of ten, as indicated by the large dot located above the movie controls in the lower part of the screen.

Example search for “wikileaks” in iScience Maps’ Global Search tab. The panel at the top shows configuration options for date range, terms (optional: more terms and Boolean operators), number of intervals in resulting animation, and number of tweets found. Any dot in the resulting world map can be clicked to summon a pop-up window (right side) with further information about tweets and location. Buttons at the bottom control the animation
Via “Advanced Search” and using the “+” button, searches can be expanded to any number of terms that are combined by Boolean search operators. For instance, in the example above, one could add terms like “traitor” or “hero” to “wikileaks” and combine them with Boolean operators like “and” or “and not” to find out about relative proportions of positive and negative responses to WikiLeaks.
The layout in Global Search is divided into three panels: one query panel at the top, one dynamic map at the middle, and one results panel at the bottom. The results panel displays the date range, searches, number of intervals chosen for the movie, and the number of tweets found. Results can be copied to the clipboard or downloaded in Comma Separated Values (CSV) or Excel (XLS) format for statistical analysis.
Local search
iScience Maps’ “Local Search” provides two query panels grouped side by side to easily compare searches between places, date ranges, and search terms. Both panels work the same way and can be used simultaneously. Search terms from one panel can be copied to the other by one click. Three parameters have to be defined to perform a query:
-
Where? Location can be defined using the map to set the area range. The area boundaries will be defined by the zoom used in the map widget. The text field above the map can also be used to search for a location that is then displayed in the map widget.
-
When? A horizontal scale with two sliders allows users to define a date range. Twitter provides data only for the last 3–7 days.
-
What? Pressing the “+” button initiates a Boolean search for two search terms. Three operators (and, or, and not) can be defined. Each text field should be used to define exactly one term. The number of terms is not limited, and the search is case insensitive.
There are two APIs to be queried: The Twitter API that is used in Local Search provides more results than its alternative, but has a limit of 1,500 results. This API is slow if there are too many results (15 seconds per query), the date range is limited, and there is a 2,500 km maximum range. The iScience API that is used in Global Search has no result limits, no date range limits, and no distance range limits but shows geotagged tweets only (i.e., there is no profile-based location inference). It draws on a random sample of 1%–10% of all tweets.
Results panel
All queries’ results will be stored in a dynamic table, which can be reordered by clicking the column headers. There are three buttons at the top of the panel to export the results to the clipboard or download them in CSV or Excel format.
A step-by-step example using local search
In this section, we describe how to run a partial replication of a study on affective and personality characteristics inferred from first names, published in 1993 by Mehrabian and Piercy. From Table 2 in their article, we take the first six male names; for three of these, (Alexander, Charles, Kenneth) the connotation of the dimension “successful” was strong, and for three (Otis, Tyrone, Wilbur), it was weak. Successful meant “ambitious,” “intelligent,” and “creative.” If these names’ having the connotation of a personality characteristic really holds, this likely should be apparent when Twitter is mined, because attributions to persons, such as “Charles is an intelligent guy,” frequently appear in text-based message services like Twitter.
Method
To avoid reaching the maximum threshold for number of tweets per search imposed by Twitter (1,500), we search for one name only at a time, and only for a 3-day period. For example, having selected the “Local search” tab, we take the following steps:
-
1.
Define locations in the two map areas: the western U.S. in the left map, the U.K. and Ireland in the right map. Any circular geographical area can be defined precisely by clicking on “Text-based area definition” just below a map, then entering the geographical coordinates of a point and a radius. For example, the western U.S. can be defined aproximately using the coordinates 39.53393 (latitude) and 118.75542 (longitude) and a radius of 1,120 km.
-
2.
Define the date range using the slider “When?” Use the last 3 days.
-
3.
To find and later adjust for the base rate, we first do a simple search for each name. Type “Otis” in the “What?” text field and press “Get Results.” Repeat this step for all of the names.
-
4.
Then we search for each name in combination with an attribute, Fig. 5 shows a search for “Charles” in combination with “intelligent,” comparing the U.S. west coast with the U.K. and Ireland.
Fig. 5 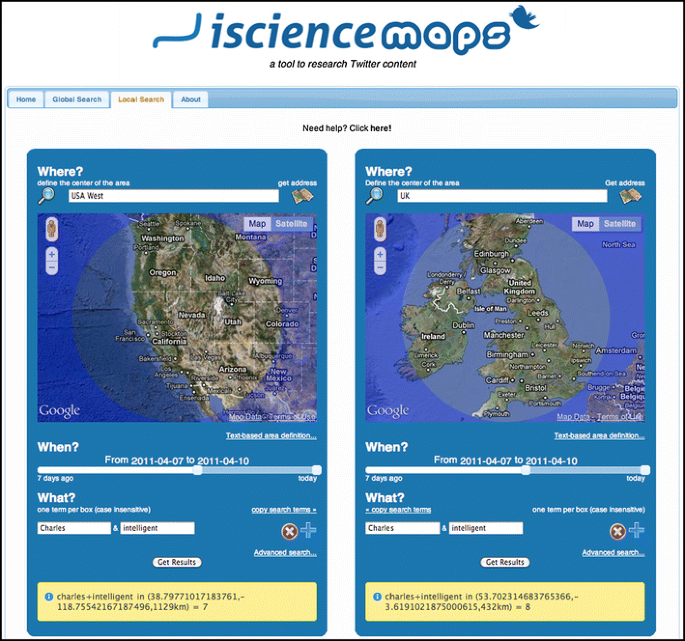
Comparison interface, directly available from http://maps.iscience.deusto.es/local/. The example shows a comparison for the Boolean search “Charles” AND “intelligent” in the western U.S. and the U.K./Ireland
-
5.
Scrolling down reveals the results for direct viewing and download. Clicking on the first item in each row (“Twitter”) connects to Twitter via the Web and shows the actual tweets.

Results
Supporting the original findings for male names in the U.S., we did not find a single combination of the low-connotation names with any of the terms “successful,” “ambitious,” “intelligent,” and “creative.” All the high-connotation names did indeed appear in the same tweets with some of the aforementioned terms; for example, Alexander appeared 6 times with either “creative” or “successful” (out of a base rate of 5,478 appearances overall). Kenneth was tweeted 15 times in combination with “successful” (base rate: 2,005), and Charles 38 times with “creative,” “intelligent,” or “successful” (base rate > 16,760Footnote 2).
These findings replicate for tweets from the U.K.: no tweets for combinations of the four personality characteristics with the low-connotation names, but some combinations for two of the three high-connotation names. Charles appeared 15 times with either “creative” or “intelligent” (base rate: 1,621), and Kenneth 5 times in combination with either “successful” or “intelligent” (base rate: 323). Alexander appeared 1,215 times without any of the terms.
Critically—and this can be derived directly from our Twitter study—the base rate of high-connotation versus low-connotation names (Otis, 1,296; Tyrone, 1,324; Wilbur, 355) appears to be a confounding factor and may also explain findings in the original study, because less frequent names may cognitively be less associated with any personality characteristics. Thus, to control for base rate effects, the study would need to be complemented by searches for combinations of names with opposite connotations—for example, name plus “unsuccessful.” We encourage the reader to use iScience Maps in doing so to further explore and expand on the example.
Features
iScience Maps is targeted to researchers interested in mining Twitter. It provides temporal and geospatial content analysis and a rich set of features for comparative search options. Trends within a date interval can be detected via the Global Search panel and can be visualized as an animated movie using the Scalable Vector Graphics (SVG) based worldwide map’s animations. Local Search provides two query forms and maps to do comparative searches. In both clients (global and local), if the Boolean content search field is empty, all Twitter statuses matching the location and date range will be retrieved. Hence, it is possible to calculate relative proportions of search term combinations in the Twitter space for a given geo location.
Depending on the research question, a researcher may wish to combine the location information with aggregated data available via zip code—for example, from the U.S. Census Web site at http://www.census.gov/epcd/www/zipstats.html. These data can help determine the extent to which tweeting on a particular topic is concentrated in, for example, affluent communities across the U.S.
Each time a researcher receives a result using a query form, a new row is added to the table of results. This table is a dynamic widget; thus, all its content can be easily rearranged by just clicking on the header cells. It also lets one export its content to the clipboard or to CSV or Excel (XLS) format. The tweets can be accessed as well.
The extraordinary success of Twitter has much to do with its APIs. APIs enable third-party services to successfully use a platform without dealing with its implementation details, showing it as a “black box” full of features. All of the Web applications that are part of iScience Maps use Twitter APIs intensively but also provide their own public API with refined results. In this way, researchers can combine raw results from official Twitter APIs with refined results taken from the iScience Maps API and can cross-check trends or proportional ratios. Another interesting feature derived from iScience Maps’ modular architecture is the possibility of linking third-party clients that use iScience Maps’ API in richer ways.
In the next section, we will compare the iScience Maps platform and its main features with other existing services for searching Twitter. Depending on the requirements of a research project, some of these services may complement iScience Maps.
Comparison of iScience maps with other Twitter search services
There are a number of Web services that were developed around the Twitter APIs. Not all of these services were developed specifically for scientific research, but they may be useful in performing certain tasks that may be needed in research projects. For example, during the initial stage of developing a research question, one may want to use Monitter (http://www.monitter.com), which lets one monitor the Twitter world in real time for a set of keywords and watch what Twitter users are writing. In Table 1, we provide an overview of third-party services for searches on Twitter, and we compare their features with those provided by iScience Maps.
A second category of Web service providers do not provide search options but provide APIs that focus on Twitter content. Some of them offer interesting packages like GNIP’s “Premium Twitter feeds” (http://gnip.com/twitter): (1) Twitter Halfhose (~50% of all Twitter content, delivered in realtime), (2) Twitter Decahose (~10% of all Twitter content, similar to Twitter’s “Gardenhose”), (3) Twitter Link Stream (all Twitter statuses containing URLs, delivered in realtime), and (4) Twitter User Mention Stream (all Twitter statuses that mention any user). The main drawback of GNIP’s services is their steep price, which is generally not suitable for low-budget research initiatives. Semiocast (http://semiocast.com/) is another company specializing in Twitter content analysis that provides semantic analysis services through a public API. This API can be used to analyze, filter, and prepare Twitter statuses in terms of their language or location. Semiocast API allows up to 1,024 API calls per day for free. 140kit (http://140kit.com; see Gaffney, Pearce, Darham, & Nanis, 2010) is a free Web service that enables complete data pulls for a set of users or terms on Twitter, with searches running continuously through Twitter streaming API running in their servers. Those data pulls can be downloaded and processed locally, combined with other users’ data pulls, and analyzed online, generating basic visualizations. Most of these features can also be used through their public API.
We developed iScience Maps to work independently, without using third-party services, but in the future we may consider contracting some processes from third parties, if the third-party services become more powerful and less expensive. Like iScience Maps, GNIP provides filtered Twitter’s streaming API content. Although iScience Maps compares favorably with GNIP on the cost dimension, the gathering process of iScience Maps could be outsourced to GNIP if they offered a “Twitter Geotagged Stream,” providing a filtered version of Twitter Firehose with all geotagged statuses. In a similar way, Semiocast services could be added to iScience Maps to filter content more deeply with its location and semantic filters. Since the Semiocast API is a paid service (for more than 1,024 requests per day), iScience Maps’ current version does not use this service for filtering. 140kit is a useful service for performing searches on Twitter, but only for the brief time window of one week. 140kit only provides on-demand Twitter data pulls; thus, a researcher would have to act quickly and ask for a 1-week data pull on this platform. iScience Maps’ Global Search works in a more sustainable way, since all gathered Twitter content can be queried at any moment. Another important difference between 140kit and iScience Maps is that the latter provides location-based filtering, in addition to content-based filtering.
Discussion and outlook
By mining Twitter content using iScience Maps, we replicated the findings of research inferring affective and personality characteristics from first names (Mehrabian & Piercy, 1993). Findings were replicated in two different English-speaking areas of the world, the western U.S. and the U.K./Ireland. Furthermore, we measured the base rates of first names appearing in the same samples of tweets (in only a matter of a few minutes, using iScience Maps). This revealed that a crucial factor, the base rates of first names, appears to have confounded the results in the original study. Base rate neglect is a common cognitive phenomenon (Kahneman & Tversky, 1972; Reips & Waldmann, 2008), and the present results indicate that researchers are not exempt from its effects. Thus, we tacitly conclude that our tool has merits for conducting psychological research.
The iScience Maps Twitter tool will continue to be developed. Currently, we are seeking contact with the developers at Twitter. We are proposing to them a “researcher API” that would make Twitter’s information about tweets much more accessible to researchers. In comparison with Twitter’s current APIs, the one we propose has many benefits, including (1) very little programming work for Twitter, (2) a reduced number of accesses to the current APIs, and (3) helping immensely the community of researchers who would like to use the Twitter stream in their work.
Notes
From a technological point of view, there are three different Twitter APIs: REST API, Search API, and Streaming API. The first two—REST and Search API—are separated for historical reasons (Twitter acquired Summize Inc. and rebranded it as Twitter Search) but work in a similar way. The third one—Streaming API—was designed to provide large amounts of data to third-party applications focused on Twitter content analysis and works in a very different way. The Twitter REST API methods allow developers to interact with the full range of features regarding a specific Twitter account, using Representational State Transfers (REST).
The Twitter API limits the number of results to a maximum of 1,500 per search, so we can provide only a minimum value for this combined result.
References
Barras, G. (2009). Gallery: Flickr users make accidental maps. New Scientist. Retrieved April 27, 2009 from http://www.newscientist.com/article/dn17017-gallery-flickr-user-traces-make-accidental-maps.html
Gaffney, D., Pearce, I., Darham, M., & Nanis, M. (2010). Presenting 140Kit: An open, extensible research platform for Twitter. Retrieved from http://www.webecologyproject.org/2010/07/presenting-140kit/
Garrett, S. (2011). Twitter / Sean Garrett: Oh and - not a Q1 stat - but noticed that we're now at 155 million Tweets per day, up from 55 million at this time last year. Retrieved April 6, 2011 from http://twitter.com/#!/twitterglobalpr/status/55779434350907392
Kahneman, D., & Tversky, A. (1972). Subjective probability: A judgment of representativeness. Cognitive Psychology, 3, 430–454
Mehrabian, A., & Piercy, M. (1993). Affective and personality characteristics inferred from length of first names. Personality and Social Psychology Bulletin, 19, 755–758. doi:10.1177/0146167293196011
Mislove, A., Lehmann, S., Ahn, Y.-Y., Lazer, D., Lin, Y., Onnela, J.-P.,& Rosenquist, J. N. (2010). Mapping the conversation: Political topics and geography on Twitter. Retrieved from http://election.ccs.neu.edu/
Reips, U.-D. (2007). The methodology of Internet-based experiments. In A. Joinson, K. McKenna, T. Postmes, & U.-D. Reips (Eds.), The Oxford handbook of Internet psychology (pp. 373–390). Oxford: Oxford University Press.
Reips, U.-D. (in press). Using the Internet to collect data. In H. Cooper, P. Camic, R. Gonzalez, D. Long, & A. Panter (Eds.), APA handbook of research methods in psychology. Washington, DC: American Psychological Association.
Reips, U.-D., & Lengler, R. (2005). The Web experiment list: A Web service for the recruitment of participants and archiving of Internet-based experiments. Behavior Research Methods, 37, 287–292.
Reips, U.-D., & Waldmann, M. (2008). When learning order affects sensitivity to base rates: Challenges for theories of causal learning. Experimental Psychology, 55, 9–22.
Semiocast (2010, June). Retrieved April 6, 2001 from http://semiocast.com/pr/20100701/Asia_first_Twitter_region
Van Grove, J. (2010, September 3). Twitter surpasses 145 million registered users. Mashable. Retrieved April 6, 2001 from http://mashable.com/2010/09/03/twitter-registered-users-2/
Author Note
This research was first presented at the 40th Annual Meeting of the Society for Research in Psychology (SCiP), St. Louis, November 18, 2010. It was partially supported by grant IT363-10 from Departamento de Educación, Universidades e Investigación of the Basque Government. We thank Unai Goikoetxeta for technical help in setting up the servers for our local Twitter API, Ted Cascio for copyediting, and Marc Brysbaert, Laura Buffardi, and an anonymous reviewer for valuable feedback.
Author information
Authors and Affiliations
Corresponding author
Rights and permissions
About this article
Cite this article
Reips, UD., Garaizar, P. Mining twitter: A source for psychological wisdom of the crowds. Behav Res 43, 635–642 (2011). https://doi.org/10.3758/s13428-011-0116-6
Published:
Issue Date:
DOI: https://doi.org/10.3758/s13428-011-0116-6