


ABSTRACT
Six very successful Very Long Baseline Array (VLBA) calibrator survey campaigns were run between 1994 and 2007 to build up a large list of compact radio sources with positions precise enough for use as very long baseline interferometry (VLBI) phase reference calibrators. We report on the results of a second epoch VLBA Calibrator Survey campaign (VCS-II) in which 2400 VCS sources were re-observed in the X and S bands in order to improve the upcoming third realization of the International Celestial Reference Frame (ICRF3) as well as to improve their usefulness as VLBI phase reference calibrators. In this survey, some 2062 previously detected sources and 324 previously undetected sources were detected and revised positions are presented. Average position uncertainties for the re-observed sources were reduced from 1.14 and 1.98 mas to 0.24 and 0.41 mas in R.A. and decl., respectively, or by nearly a factor of 5. Minimum detected flux values were approximately 15 and 28 mJy in the X and S bands, respectively, and median total fluxes are approximately 230 and 280 mJy. The vast majority of these sources are flat-spectrum sources, with ∼82% having spectral indices greater than −0.5.
Export citation and abstract BibTeX RIS
1. INTRODUCTION
The Very Long Baseline Array (VLBA) Calibrator Surveys, VCS1-VCS6 (Beasley et al. 2002; Fomalont et al. 2003; Petrov et al. 2005, 2006, 2008; Kovalev et al. 2007), were a series of six campaigns comprised of twenty-four 24-hr very long baseline interferometry (VLBI) sessions run on the VLBA from 1994 to 2007. The VCS campaigns determined the precise positions of ∼2900 compact radio sources, most of which were found to be suitable as VLBI phase reference calibrators. Observations were made using the dual frequency S/X system on the VLBA. Snapshot images were also produced, which helped quantify each object's suitability as a calibrator. Their positions were determined in the frame of the first International Celestial Reference Frame (ICRF1; Ma et al. 1998), which represented the realization of the International Celestial Reference System (Arias et al. 1995) at radio wavelengths. The original VCS1-6 sessions greatly increased the pool of phase referencing calibrators available for VLBI, which enabled tremendous advances in imaging of weak sources and differential astrometry.
The VCS1-6 campaigns were complementary to an ongoing geodetic/astrometric VLBI effort begun in the late 1970s by an international consortium led by a group at the Goddard Space Flight Center (Ryan & Ma 1998), which later became the International VLBI Service for Geodesy and Astrometry (IVS) in 1999 (Behrend 2013). The geodetic VLBI sessions were part of programs and efforts supported by NASA, USNO, NOAA/NGS, and several international agencies to regularly measure Earth orientation parameters (EOP), define and monitor a terrestrial reference frame (TRF), and define a celestial reference frame (CRF) at radio frequencies. Some of the early accomplishments of geodetic VLBI include measurements of regional deformation in the Western US (Clark et al. 1987), earthquake displacements (Ma et al. 1990), and global measurements of continental drift. Geodetic VLBI currently provides the only high precision measurements of UT1 and nutation. The IAU 2000A nutation model (Mathews et al. 2002) is the result of fitting to the nutation series produced by the geodetic VLBI programs.
Very precise geodetic VLBI requires a catalog of bright compact radio sources with very accurately known positions. Most of the few hundred sources in the geodetic VLBI catalog had been observed in dozens or hundreds of VLBI sessions, and had thousands of observations (individual baseline group delay and delay rate measurements). But of the VCS1-6 sources, most were observed only in one or two VCS sessions and with fewer than 100 observations. Precision goals for the VCS campaigns were source position accuracies on the order of one or two milliarcseconds (mas), and most VCS sources met this goal.
Astrometric analysis of the VCS1-6 sessions was made at the Goddard Space Flight Center (GSFC), and in 2009, the VCS data was combined with nearly 30 years of geodetic/astrometric VLBI data to generate the second realization of the International Celestial Reference Frame (ICRF2; Fey et al. 2009, 2015) by an IERS10 /IVS working group. Of the data used to construct ICRF2, the VCS1-6 sessions represented less than 1% of the total sessions and 4% of the total number of observations. However, of the 3414 sources in ICRF2, ∼2200, or nearly two-thirds, were exclusively from the VCS1-6 sessions. However, because of their mostly single epoch history, most were placed in a second group within ICRF2 called "VCS-only Sources." The other ∼1200 ICRF2 sources came from the nearly 30 years of geodetic/astrometric VLBI monitoring programs taken for TRF, CRF, and EOP determination, and had position errors averaging ∼5 times smaller. Efforts were made to re-observe VCS-only sources in IVS geodetic/astrometric sessions in the few years since ICRF2 was generated, but most were too weak to be detected with the less sensitive geodetic VLBI networks, so most remained single epoch sources.
In 2012, an IAU working group was formed to generate the third realization of the ICRF in the radio domain by 2018. One of the primary goals of ICRF3 is to provide for the alignment and accuracy comparisons with the anticipated GAIA optical catalog. To enable such a comparison, a more uniform precision is needed in ICRF3. Therefore, one of the first goals identified by the ICRF3 working group was to re-observe the VCS sources to improve their positions and eliminate the two class distinction present in ICRF2. VLBA time for eight 24 hr sessions was requested and granted to re-observe these sources in the absolute astrometry mode. We describe here those re-observations and their results.
2. OBSERVATIONS
The VLBA S/X dual frequency system was used for compatibility with the earlier VCS1-6 sessions, other VLBA geodesy/astrometry sessions, and ∼35 years of geodetic/astrometric VLBI. The combination of the X band (∼8.6 GHz) and S band (∼2.3 GHz) allows for ionosphere-free group delays to be constructed. We used the VLBA RDBE/Mark5C system, which has 16 32 MHz channels and records 2 Gbits s−1 using 2 bit sampling. This is in contrast to the original VCS1-6 sessions, which used eight 8 MHz channels and recorded only 128 Mbits s−1 with 1 bit sampling for most sessions. Due to S-band filters below 2200 MHz and above 2400 MHz at most of the VLBA antennas, and a broad area of RFI from SiriusXM satellites (2320–2345 MHz), only four channels could be deployed in the S band (2220.0, 2252.0, 2284.0, and 2348.0 MHz). The other 12 channels were deployed in the X band (8460.0, 8492.0, 8524.0, 8556.0, 8620.0, 8652.0, 8716.0, 8748.0, 8812.0, 8844.0, 8876.0, and 8908.0 MHz). With this system, the VLBA is ∼4.8 and ∼2.8 times more sensitive in the X and S bands, respectively, than most of the earlier VCS1-6 sessions.
We set a target of 300 sources per session, or 2400 total sources for the 8 VLBA sessions. This is considerably more sources per session than in the original VCS1-6 sessions, but more rapid observing is now possible with the improved sensitivity of the VLBA. We selected all sources from the GSFC S/X astrometric/geodetic catalog between −50° and +90° decl. that had been observed in only 1 or 2 sessions as of mid 2013. This amounted to ∼2060 sources. Most of these were VCS sources in ICRF2, but a few were from other VLBA astrometric/geodetic sessions (described in Petrov et al. (2009)) taken after ICRF2. To fill out the list, we added ∼340 additional sources that had been observed but not detected in the original VCS1-6 analysis. Figure 1 shows the distribution of these 2400 sources on the sky.

Figure 1. Sky distribution of the 2400 sources in the VCS-II campaign.
Download figure:
Standard image High-resolution imageThe largest error source in geodetic/astrometric VLBI comes from the troposphere, in particular, the wet component. Measurements of surface pressure allow adequate characterization of delays due to the dry (hydrostatic) component of the atmosphere. However, the wet component is not well characterized by the surface temperature and humidity. Therefore, frequent sampling of the troposphere over a wide range of elevations and azimuths is desired in order to accurately estimate time-variable tropospheric delays and gradients. Geodetic VLBI sessions typically spend ∼50% of the time observing and the rest either slewing to the next source or waiting for the slowest antenna. With the increased sensitivity of the VLBA (but with no change in the slewing speeds) and the correspondingly shorter integration times needed, a typical geodetic type schedule would get only ∼20%–30% observing time while the other ∼70%–80% would be slewing or idle time. Therefore, we adopted a modified geodetic type scheduling philosophy in order to reduce the time spent slewing and increase the time spent observing. The 2400 sources were split into 400 groups of 6 nearby sources, typically all within ∼10°–20° of each other. Fifty of the groups were selected for each of the 8 sessions. The schedules were constructed by scheduling a short scan on a strong well known source for troposphere calibration, followed by longer scans on each of the 6 sources in one of the 50 groups, with short slews in between. Then the antennas slewed to another troposphere calibrator and another group of 6 sources and repeated the process, taking ∼15 minutes for each group and calibrator. The NRAO SCHED program was used to manually assemble the scans. The troposphere calibrators were all ICRF2 defining sources, with well known positions that would also serve to tie the VCS-II target sources into the ICRF. Calibrator scans were typically 20–30 s long and VCS-II target source scans were typically 60–120 s long, based on how successful the earlier VCS1-6 observations had been. Each target source was observed in two scans, several hours apart. A few sources were actually observed in a third short scan using a subset of the antennas, while waiting for other antennas that were still slewing.
The eight schedules were written using the dynamic mode of SCHED, allowing them to be run at any time. The schedules were 24 hr in length, which allows averaging out of diurnal geophysical effects. They were run between 2014 January and 2015 March. The session names, start and end times, and the number of observations used in each session are given in Table 1. The "B" session originally failed due to technical problems and was rerun as "B1." Also the "G" session was terminated shortly after startup due to hardware problems and was later run as session "I." Most of the sessions used all 10 VLBA antennas. However, in the first session, BR-VLBA and HN-VLBA were not available and KP-VLBA failed. And significant partial station dropouts in five of the sessions resulted in losses of ∼25% of the total time at MK-VLBA and ∼10% at FD-VLBA. The loss of BR-VLBA and HN-VLBA primarily results in less precision in decl. and the loss of MK-VLBA primarily results in less precision in R.A.
Table 1. VCS-II Sessions
| Session | Time Range (UTC) | # Obs |
|---|---|---|
| VCS-II-A/BG219A | 2014 01/04 10:04–01/05 10:02 | 9288 |
| VCS-II-B/BG219B1 | 2014 05/31 17:12–06/01 17:05 | 25920 |
| VCS-II-D/BG219D | 2014 06/09 09:13–06/10 09:10 | 25052 |
| VCS-II-C/BG219C | 2014 08/05 13:03–08/06 13:00 | 23789 |
| VCS-II-E/BG219E | 2014 08/09 00:00–08/09 23:55 | 22914 |
| VCS-II-F/BG219F | 2014 12/20 01:18–12/21 01:14 | 27211 |
| VCS-II-H/BG219H | 2015 01/23 23:00–01/24 22:55 | 23397 |
| VCS-II-I/BG219I | 2015 03/17 07:57–03/18 07:57 | 25801 |
Download table as: ASCIITypeset image
3. ANALYSIS
Correlation of the data was done using the DiFX software correlator (Deller et al. 2011) at NRAO's Pete V. Domenici Science Operations Center in Socorro, New Mexico. Output of the DiFX correlator was converted to both FITS-IDI format using the difx2fits software and to Mark4 format using the difx2mark4 software. The Mark4 data was further processed at GSFC using the Haystack Observatory HOPS program fourfit to determine the regular geodetic VLBI observables (group delays and phase delay rates). The fourfit output was then used to make geodetic-style databases and analyzed using the GSFC Calc/Solve analysis package (Ma et al. 1986). All 8 VCS-II sessions were later analyzed along with ∼35 years of geodetic/astrometric VLBI databases (including the original VCS1-6 sessions). This type of analysis has been described elsewhere (Beasley et al. 2002; Fey et al. 2009; Petrov et al. 2009) so it will be described only briefly here. Program Calc computes theoretical VLBI baseline delays, rates, and many partial derivatives using a priori site, source, and EOP information; and uses geophysical models in accordance with the IERS Conventions (2010; Petit & Luzum 2010). Program Solve uses the Calc output, along with some additional modeling, to perform least squares solutions in which various quantities can be solved for, such as source positions, station positions, station velocities, and/or Earth orientation parameters. The Solve modeling includes delays due to the dry (hydrostatic) atmosphere computed from measured surface pressures and scaled to each source's elevation using the VMF1 mapping function (Boehm et al. 2006). The wet atmosphere delays were estimated as piece-wise continuous functions at 1.0 hr intervals in the least-squares solutions. Solve can be operated in either an interactive mode to analyze single VLBI sessions and prepare them for further analysis, or in a global mode where many sessions are analyzed together in a single incremental least-squares solution. After the single session interactive analysis, the 8 VCS-II sessions were then analyzed along with 5828 other geodetic/astrometric VLBI sessions in a large global solution in which source positions, site positions, site velocities, and EOP's were solved for. The source solution was made to conform to the ICRF2 reference frame by holding the 295 ICRF2 defining sources to a no-net-rotation constraint from their ICRF2 positions. The use of 182 ICRF2 defining sources as troposphere calibrators in the VCS-II sessions insured a strong link to the ICRF2 reference frame.
Several studies have shown that the formal errors from Calc/Solve solutions are underestimated due to various unmodeled effects. An extensive error analysis was done for ICRF2 (Fey et al. 2009, 2015) which resulted in a rescaling of the position uncertainties. For consistency with ICRF2, we have therefore inflated the Calc/Solve formal errors in the same manner as for ICRF2, by multiplying them by 1.5 and then adding 40 microarcsec in a root sum square manner. The R.A. uncertainties in units of time seconds were first multiplied by 15 × cos(decl.) to convert them to units of arc seconds.
Source fluxes can be estimated from the astrometric analysis using the following equation:
where Flux is in Jansky's; S/N is the group delay signal-to-noise ratio computed by fourfit;  are the "system equivalent flux densities" of the two antennas, which are equal to the system temperatures divided by the antenna gain in degrees per Jansky; #samples is the total number of digitized samples recorded during the interval used by fourfit for the observation; and the factor 1.38 is for the improvement in sensitivity of 2 bit versus 1 bit sampling. Antenna gains were taken from the "vlba_gains.key" file.11
Minimum detectable fluxes can be estimated from this equation. Assuming a minimum S/N of 7 and minimum SEFD's of 500 Jy in both the X and S bands, we get 15 and 25 mJy in the X band and S band for a 120 s scan, and 21 and 35 mJy for a 60 s scan. By contrast, the minimum detectable flux values for the VCS1-6 sessions were in the 60–100 mJy range at X and S bands. We have computed averages of the estimated fluxes on short baselines (<1000 km) and on the longest baselines (3000–9000 km), to estimate total and unresolved fluxes for each source. The minimum unresolved fluxes obtained are 15 mJy in the X band and 28 mJy in the S band, close to the estimated minimum detectable fluxes for these sessions. X-band total fluxes range from 0.022 up to 5.49 Jy, with a median value of 0.228 Jy, and S-band total fluxes range from 0.031 up to 5.47 Jy, with a median value of 0.277 Jy. We caution that these flux values should be considered rough estimates only, as there were no attempts to do accurate amplitude calibration. Furthermore, the S/Ns determined by fourfit can be affected by various factors such as phase instabilities or brief amplitude spikes in the data. Also, flux strengths of these types of sources can be expected to vary on timescales ranging from a few years to as little as a few months.
are the "system equivalent flux densities" of the two antennas, which are equal to the system temperatures divided by the antenna gain in degrees per Jansky; #samples is the total number of digitized samples recorded during the interval used by fourfit for the observation; and the factor 1.38 is for the improvement in sensitivity of 2 bit versus 1 bit sampling. Antenna gains were taken from the "vlba_gains.key" file.11
Minimum detectable fluxes can be estimated from this equation. Assuming a minimum S/N of 7 and minimum SEFD's of 500 Jy in both the X and S bands, we get 15 and 25 mJy in the X band and S band for a 120 s scan, and 21 and 35 mJy for a 60 s scan. By contrast, the minimum detectable flux values for the VCS1-6 sessions were in the 60–100 mJy range at X and S bands. We have computed averages of the estimated fluxes on short baselines (<1000 km) and on the longest baselines (3000–9000 km), to estimate total and unresolved fluxes for each source. The minimum unresolved fluxes obtained are 15 mJy in the X band and 28 mJy in the S band, close to the estimated minimum detectable fluxes for these sessions. X-band total fluxes range from 0.022 up to 5.49 Jy, with a median value of 0.228 Jy, and S-band total fluxes range from 0.031 up to 5.47 Jy, with a median value of 0.277 Jy. We caution that these flux values should be considered rough estimates only, as there were no attempts to do accurate amplitude calibration. Furthermore, the S/Ns determined by fourfit can be affected by various factors such as phase instabilities or brief amplitude spikes in the data. Also, flux strengths of these types of sources can be expected to vary on timescales ranging from a few years to as little as a few months.
Imaging of the sources from the FITS-IDI data is ongoing and results will be published at a later time (Beasley et al. 2016, in preparation). Source structure indices (Fey & Charlot 1997) will also be computed from the images.
4. ASTROMETRIC RESULTS
Of the 2400 target sources observed, 2386 were detected, or 99.4%. To be considered a "detection," we require at least 3 good S/X observation pairs, with the fourfit program requiring an S/N of at least 7 for an observation to be considered good. Of the 2386 sources detected, 2062 are previously detected sources, and 324 are sources that were not detected in the original VCS1-6 analysis. As described in the previous section, a single Calc/Solve least-squares solution was run with the 8 VCS-II sessions and 5828 other VLBI sessions. For comparison, a similar solution was run with the other 5828 sessions without the 8 VCS-II sessions. This comparison shows that for the 2062 re-observed sources, the average R.A. and decl. inflated position errors drop from 1.14 and 1.98 mas to 0.24 and 0.41 mas, respectively, for an average improvement factor of 4.8. Median inflated errors drop from 0.52 and 0.96 to 0.18 and 0.30 mas. The 324 "new" sources are predominantly weaker sources with correspondingly larger position errors, averaging 1.49 and 2.64 mas in R.A. and decl. However, their median inflated errors of 0.42 and 0.84 mas are more meaningful, since the averages are skewed by a few very weak sources with only a few successful observations. Most of the new sources are actually determined well enough to be useful as phase-reference calibrators. In Figure 2 we show the R.A. and decl. inflated errors with and without the VCS-II sessions, averaged in 2° decl. bins. The improvement is quite clear. Uncertainties with the new observations are well under a mas in most 2° bins and there is very little scatter between the bins.
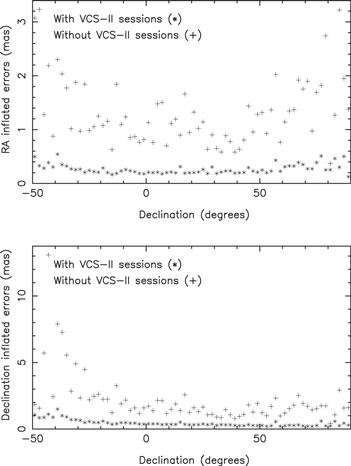
Figure 2. Comparison of inflated formal errors with and without the VCS-II observations averaged in 2° decl. bins for the 2062 re-observed sources.
Download figure:
Standard image High-resolution imageDuring the course of this analysis, three sources were found to be problematic, showing large and significant position differences from the earlier VCS observations. Careful examination of the earlier data indicates that these shifts represent real changes in the apparent VLBI positions of these three sources. These sources and their position shifts are: J0134–0931/0132–097 (−73.2, −125.4 mas) J1526–1351/1524–136 (29.5, −100.3 mas) and J2020+2942/2018+295 (1.5, 37.6 mas). It is very likely that these three sources have multiple components and a different component dominated at the two epochs. In fact, Winn et al. (2002) found that J0134–0931/0132–097 is probably gravitationally lensed. Such VLBI positional variation is typical for lensed objects and several known gravitationally lensed sources were excluded from ICRF2 for this reason. Therefore, to prevent biasing the VCS-II positions, the data for these three sources from the earlier VCS1-6 sessions was not used. Also, these three sources should probably not be used as phase reference calibrators.
Positions and other information for the 2062 re-observed and the 324 new sources are given in Tables 2 and 3. The tables give the J2000 and IVS names; positions; inflated errors; S- and X-band total and unresolved fluxes; spectral indices (α, such that Sν ∝ να); the observation epoch to which the flux and spectral index refers; and the total number of observations (group delays) on the source used in the solution, including earlier measurements. The positions and inflated errors are weighted averages using the observations from the VCS-II sessions, the VCS1-6 sessions, and a few other sessions for a few sources; except that for the three problematic sources discussed in the previous paragraph, source data from the earlier VCS1-6 sessions was not used. These positions are extracted from the larger Calc/Solve least square solution described previously. The full GSFC catalog of all S/X sources is periodically updated and is available at http://gemini.gsfc.nasa.gov/solutions/ or by following the links at http://lupus.gsfc.nasa.gov. Fluxes and spectral indices are computed from the VCS-II sessions only.
Table 2. VCS-II Catalog, Re-observed Sources
| Errors (mas) | S Flux (Jy) | X Flux (Jy) | Flux | |||||||||
|---|---|---|---|---|---|---|---|---|---|---|---|---|
| J2000 Name | IVS Name | R.A. | decl. | R.A. | decl. | Total | Unres | Total | Unres | α | Epoch | Nobs |
| J0000–3221 | 2357-326 | 00 00 20.3999699 | −32 21 01.233260 | 0.182 | 0.516 | 0.903 | 0.641 | 0.396 | 0.244 | −0.62 | 2014 Jun 09 | 112 |
| J0000+4054 | 2358+406 | 00 00 53.0814204 | +40 54 01.803088 | 0.469 | 0.495 | 0.882 | 0.304 | 0.282 | 0.075 | −0.85 | 2014 Jun 09 | 61 |
| J0001–1551 | 2358-161 | 00 01 05.3287251 | −15 51 07.075023 | 0.154 | 0.331 | 0.394 | 0.242 | 0.280 | 0.178 | −0.26 | 2014 Jun 09 | 130 |
| J0001+6051 | 2358+605 | 00 01 07.0998315 | +60 51 22.797963 | 0.441 | 0.310 | 0.139 | 0.062 | 0.184 | 0.138 | +0.21 | 2014 Aug 09 | 69 |
| J0003–1941 | 0000-199 | 00 03 15.9493828 | −19 41 50.401338 | 0.248 | 0.583 | 0.304 | 0.203 | 0.174 | 0.079 | −0.42 | 2014 Jun 09 | 83 |
| J0003–1927 | 0000-197 | 00 03 18.6750308 | −19 27 22.355314 | 0.316 | 0.629 | 0.146 | 0.087 | 0.117 | 0.066 | −0.17 | 2014 Aug 09 | 143 |
| J0003+2129 | 0000+212 | 00 03 19.3500132 | +21 29 44.508188 | 0.150 | 0.294 | 0.227 | 0.148 | 0.186 | 0.085 | −0.15 | 2015 Jan 23 | 162 |
| J0004+4615 | 0001+459 | 00 04 16.1276569 | +46 15 17.970538 | 0.176 | 0.186 | 0.221 | 0.216 | 0.427 | 0.352 | +0.49 | 2014 Aug 09 | 148 |
| J0005+5428 | 0002+541 | 00 05 04.3634110 | +54 28 24.924646 | 0.212 | 0.184 | 0.530 | 0.305 | 0.374 | 0.160 | −0.26 | 2014 Jan 04 | 152 |
| J0005–1648 | 0002-170 | 00 05 17.9337866 | −16 48 04.678618 | 0.213 | 0.483 | 0.252 | 0.196 | 0.164 | 0.092 | −0.32 | 2014 Aug 09 | 136 |
Only a portion of this table is shown here to demonstrate its form and content. A machine-readable version of the full table is available.
Download table as: DataTypeset image
Table 3. VCS-II Catalog, Originally Undetected VCS Sources
| Errors (mas) | S Flux (Jy) | X Flux (Jy) | Flux | |||||||||
|---|---|---|---|---|---|---|---|---|---|---|---|---|
| J2000 Name | IVS Name | R.A. | decl. | R.A. | decl. | Total | Unres | Total | Unres | α | Epoch | Nobs |
| J0003+4807 | 0001+478 | 00 03 46.0415730 | +48 07 04.135251 | 0.660 | 0.667 | 0.314 | 0.212 | 0.074 | 0.036 | −1.08 | 2014 Jun 09 | 57 |
| J0005–3445 | 0002-350 | 00 05 05.9250921 | −34 45 49.657091 | 0.591 | 1.530 | 0.105 | 0.087 | 0.109 | 0.073 | +0.03 | 2014 Aug 09 | 49 |
| J0010+2047 | 0007+205 | 00 10 28.7430488 | +20 47 49.788571 | 0.183 | 0.318 | 0.150 | 0.112 | 0.131 | 0.052 | −0.10 | 2014 May 31 | 90 |
| J0011+0057 | 0008+006 | 00 11 30.4031864 | +00 57 51.876909 | 0.178 | 0.330 | 0.359 | 0.344 | 0.313 | 0.244 | −0.10 | 2014 Jun 09 | 64 |
| J0016–2343 | 0013-240 | 00 16 05.7386234 | −23 43 52.200044 | 0.518 | 1.378 | 0.201 | 0.137 | 0.087 | 0.030 | −0.63 | 2014 Jun 09 | 58 |
| J0019+2956 | 0017+296 | 00 19 37.7903341 | +29 56 01.921845 | 0.659 | 1.030 | 0.084 | 0.035 | 0.046 | 0.028 | −0.45 | 2014 May 31 | 58 |
| J0026–3512 | 0023-354 | 00 26 16.3870679 | −35 12 48.793562 | 0.408 | 1.003 | 0.065 | 0.063 | 0.446 | 0.373 | +1.44 | 2014 Aug 09 | 42 |
| J0032+1953 | 0030+196 | 00 32 38.3388865 | +19 53 53.778975 | 4.482 | 6.530 | 0.655 | 0.044 | 0.056 | 0.020 | −1.84 | 2014 May 31 | 9 |
| J0034–0054 | 0032-011 | 00 34 43.9219740 | −00 54 13.035384 | 0.207 | 0.405 | 0.112 | 0.082 | 0.175 | 0.125 | +0.33 | 2014 Jun 09 | 72 |
| J0040+0125 | 0037+011 | 00 40 13.5254530 | +01 25 46.349512 | 0.225 | 0.400 | 0.115 | 0.099 | 0.171 | 0.140 | +0.30 | 2014 Aug 09 | 72 |
Only a portion of this table is shown here to demonstrate its form and content. A machine-readable version of the full table is available.
Download table as: DataTypeset image
The spectral indices given in Tables 2 and 3 are estimated from the "total" fluxes in the S and X bands, and are given to aid in estimating fluxes at other frequencies. A histogram showing the distribution of spectral indices for all 2386 detected sources is shown in Figure 3. The median spectral index is −0.12. The vast majority of these sources are "flat-spectrum" sources, with some 82% having spectral indices greater than −0.5. However, this merely reflects the original selection criteria for the VCS1-6 campaigns, in which mostly flat-spectrum sources were selected because of their greater likelihood of being compact and detectable in the X and S bands.
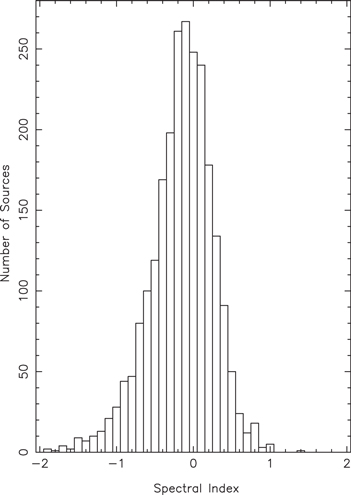
Figure 3. Distribution of spectral indices for 2386 VCS-II sources. The spectral index α is defined such that Sν ∝ να.
Download figure:
Standard image High-resolution imageThe "core-shift" effect is of some concern in using these source positions at other frequencies. Core-shift results in the apparent source position shifting closer to the quasar's central black hole at higher frequencies. In a study of 29 sources showing bright distinct jet features in VLBI images, Kovalev et al. (2008) estimated such shifts to be on the order of ∼100 μarcsec between the X band and the optical (6000 Å). This would be perhaps half or less at higher VLBI frequencies, such as 43 or 86 GHz. Most of the sources in this study will not show bright distinct jet features, so their core-shifts may be even smaller. Therefore, we expect typical position errors due to core-shifts at the higher VLBI frequencies to be no more than a few tens of μarcseconds, which is significantly less than their position uncertainties. In the future alignment between the ICRF3 radio and GAIA optical frames, as many sources as possible should be used to average out core-shift errors. With the large improvement in source positions reported here, there should be some 3000+ sources available for this alignment.
5. DISCUSSION
Some comparisons with ICRF2 have been made for validity checks. To insure consistency with ICRF2, a no-net-rotation constraint was applied to the ICRF2 defining sources in the global least-squares solution. To verify this consistency, we solved for a rotation between the full least-squares solution and ICRF2. This included all 3414 ICRF2 sources. The results are shown in column 2 of Table 4. The X-axis is in the direction 0h R.A., 0° decl.; the Y-axis is in the direction 6h R.A., 0° decl.; and the Z-axis is in the direction +90° decl. No signicant rotation is seen with respect to ICRF2. As a further check, we also solved for a rotation between the common sources in Table 2 and ICRF2, excluding the three problematic sources discussed earlier. There are 1994 sources in this group. This rotation is shown in the third column of Table 4. A small rotation about the X-axis is seen but we do not believe it is a concern. These were the weakest sources in ICRF2 and it is now known that there were a few errors in the original VCS1-6 analysis which affected some of the weakest sources. We have also taken the position differences for these 1994 sources (Table 2 positions minus ICRF2 positions), and divided by their combined inflated errors (square root of the sum of their squares). We show these in histogram form in Figure 4. Although a few sources have rather large differences (10–20 mas) most are still less than 3σ's.

Figure 4. Histograms of differences in source positions, VCS-II position minus ICRF2 position, in units of combined scaled formal errors for 1994 of the re-observed sources.
Download figure:
Standard image High-resolution image
Table 4. Rotations with Respect to ICRF2
| Axis | Rotation (μarcsec) | |
|---|---|---|
| Full solution | VCS-II sources | |
| X | 13 ± 17 | 48 ± 13 |
| Y | 23 ± 17 | 1 ± 13 |
| Z | −5 ± 10 | 6 ± 11 |
Download table as: ASCIITypeset image
It is anticipated that ICRF3 will be available in 2018. The observations presented here will result in a larger and much higher precision S/X catalog, compared to ICRF2. The improvement in the source positions determined in this study will allow a much better alignment between the future ICRF3 and the GAIA optical reference frame and will also enable improvements in phase referencing VLBI for differential astrometry and imaging of faint objects, and for use in spacecraft navigation.
The VLBA is operated by the National Radio Astronomy Observatory, which is a facility of the National Science Foundation, and operated under cooperative agreement by Associated Universities, Inc. This work made use of the Swinburne University of Technology software correlator, DiFX, developed as part of the Australian Major National Research Facilities Programme and operated under license. For a description of the DiFX correlator, see Deller et al. (2011). Partial support for this work was provided through NASA contract NNG12HP00C. IVS VLBI databases are available at the three IVS data centers, one of them being ftp://cddis.gsfc.nasa.gov/pub/vlbi/ivsdata/db/.
Facility: VLBA - Very Long Baseline Array.
Footnotes
- 10
International Earth Rotation Service.
- 11