


ABSTRACT
We present a measured value for the degree of pseudo-degeneracy between two fine-structure levels in Fe9+ from line intensity ratios involving a transition induced by an external magnetic field. The extracted fine-structure energy difference between the  and
and  levels, where the latter is the upper state for the magnetic-field induced line, is needed in our recently proposed method to measure magnetic-field strengths in the solar corona. The intensity of the
  line at 257.262 Å is sensitive to the magnetic field external to the ion. This sensitivity is in turn strongly dependent on the energy separation in the pseudo-degeneracy through the mixing induced by the external magnetic field. Our measurement, which uses an Electron Beam Ion Trap with a known magnetic-field strength, indicates that this energy difference is 3.5 cm−1. The high abundance of Fe9+ and the sensitivity of the line's transition probability to field strengths below 0.1 T opens up the possibility of diagnosing coronal magnetic fields. We propose a new method to measure the magnetic field in the solar corona, from similar intensity ratios in Fe9+. In addition, the proposed method to use the line ratio of the blended line
  with another line from Fe x as the density diagnostic should evaluate the effect of the magnetic-field-induced transition line.
Export citation and abstract BibTeX RIS
1. INTRODUCTION
The determination of the magnetic fields in the solar corona still poses one of the major remaining challenges in solar physics (Judge et al. 2001). In a recent paper (Li et al. 2015) we presented a novel method to determine magnetic-field strengths in low-density plasmas, such as solar flares. The method is unique in that simply by measuring the intensities of EUV lines, both the coronal magnetic-field strength and its rate of change potentially can be measured with modest exposure times short enough even to allow measurements of field evolution over the impulsive phase of solar flares (a few minutes; Watanabe et al. 2010). Knowledge of the changing magnetic field will provide insight into our understanding of the forces driving the dynamics of the solar atmosphere and will ultimately aid space weather forecasting. Our proposed method is based on using a radiative transition that is induced by external magnetic fields. These types of transitions, which we will label magnetic-field-induced transitions (MITs), have recently been investigated for several examples (Grumer et al. 2013; Li et al. 2013, 2014), since computational methods have been developed to predict their rates. In a recent paper, Beiersdorfer et al. (2016) measured the lifetime of a  level in Fe xvii with the MIT included at the Livermore electron beam ion trap. The MIT rate is in agreement with our theoretical predictions (Li et al. 2013), which lends a strong support and confidence to our computational methods on predicting MIT rates. Unfortunately so far the available observation of an MIT is for rather strong fields (Beiersdorfer et al. 2003, 2016), and is therefore not feasible for use in the majority of astrophysical plasmas, which either have high density, where these low-rate transitions will not be visible, or low magnetic-field strengths. However, as discussed in (Li et al. 2015), MITs can be enhanced by a close, accidental degeneracy of two quantum states, and we propose a candidate in the Fe9+ ion. This makes it possible for even rather weak external fields to compete with the several orders-of-magnitude stronger fields inside the ion, and thereby induce an MIT.
The close degeneracy is between the  level, which in a field-free space only decays with a slow M2 decay to the
  level, and the
  level, which decays with a faster electric-dipole-allowed transition to the same state. (See Figure 1, where we label the small energy difference
  , i.e., the fine-structure energy separation between the two involved excited states.) It is especially fortunate that this close degeneracy occurs for Fe9+, since this ion has a high abundance in astrophysical plasmas including the solar corona (Jordan 1969). The influence of the external magnetic field opens an allowed E1 transition from the
  to the ground state through mixing with the
  . We presented theoretical values in Li et al. (2015), from large-scale Grasp2K-calculations (Jönsson et al. 2013) for most properties needed to determine the dependence of the rate of this new transition on the strength of the external/solar magnetic field. However, the close pseudo-degeneracy between
  and
and  is not possible to be determined theoretically, since it would require a prediction of the excitation energies of the two states to within one part in 10–100 thousands. The two lines will appear as a blend in warm plasmas, being at 257.259, 257.263 Å (see Table 1). It is worth noting that current solar observations with spectral resolutions near 104 will not resolve such lines; in Doppler units the difference in wavelength is 3 km s−1. Indeed line widths from coronal plasma generally have an FWHM intensity of around 20 km s−1 (Billings 1966). However, the 3.5 cm−1 energy difference may be detectable as the blended line changes intensity and the centroid of the blended emission shifts in wavelength in response to the external magnetic field. Such sub-resolution shifts have already been reported in similar contexts in solar physics (Judge et al. 1998).
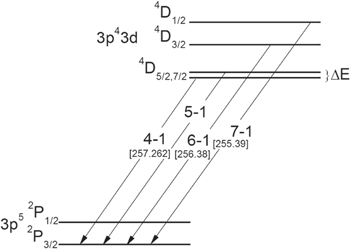
Figure 1. Schematic energy-level diagram for Fe9+. Under the influence of an external magnetic field, an E1 transition opens up from  to the ground state through mixing with
  . The numbers in the bracket are the wavelengths from the NIST database (NIST 2015).
Download figure:
Standard image High-resolution imageTable 1. Observed Lines of Fe x
| Label | Wavelength | Transition |

|

|

|
|---|---|---|---|---|---|
| a | 226.309 ± 0.006 |

|
226.21 | 225.856 | ⋯ |
| b | 230.075 ± 0.006 |
|
229.99, 230.089 | 230.667, 230.900 | ⋯ |
| c | 234.324 ± 0.010 |

|
234.356 | 234.599 | ⋯ |
| 6–1 | 256.464 ± 0.009 |

|
256.38 | 256.398 | 256.434 |
| Blended | 257.267 ± 0.004 |
|
257.262 | 257.259, 257.263 | 257.262 |
Note. Identifications and wavelengths of Fe x lines observed in this work. The experimental wavelengths are also compared to the wavelengths from CHIANTI (Landi et al. 2012) and the NIST database (NIST 2015) and a solar spectrum (Brown et al. 2008). All transitions are from  and all wavelengths are given in
  .
.
Download table as: ASCIITypeset image
In this paper, we propose an alternative method to measure the solar magnetic-field strength through the ratio of the blended line with another line from the same charge state, for example the  (7–1) line at 255.39 Å (Kramida et al. 2014) or the
  (6–1) line at 256.398 Å (Landi et al. 2012). Since the relative strength of the blended line depends on both the magnetic field and
  , we use the fact that the latter can be determined in controlled laboratory settings, with a known magnetic-field strength. When this atomic parameter is known, the relative intensities can be used to determine magnetic fields in other plasmas. The Electron Beam Ion Trap is an excellent candidate, since it can have similar properties (electron density, magnetic field) as the active solar corona (Li et al. 2015).
2. METHODS
We have used the high-temperature superconducting EBIT, SH-HtscEBIT (Xiao et al. 2013), at the Shanghai EBIT laboratory to study the spectrum of Fe x in the spectral region of interest for our proposed measurement. This EBIT is a low-density light source with a monoenergetic beam of electrons compressed by a magnetic field, which is created by liquid nitrogen temperature superconducting coils and it is capable of operating in the range of electron beam energies between 30 and 4000 eV. The EBIT was operated with a beam energy of 230 eV and a magnetic field of around 0.16 T, which is within the expected magnetic-field strengths for the active solar corona (0–0.2 T). Iron was injected into the EBIT trap region as a stream of Ferrocene (C10H10Fe) molecules. Ferrocene is fairly volatile at a heated temperature of about 100°C. The Ferrocene molecules are destroyed by electron impact and the Fe atoms are ionized to a charge state that depends on the energy of the electron beam. In these experiments we chose the beam energy to reach the charge state of Fe x. The density of the electron beam in the high-temperature superconducting EBIT is around 5 × 1010 cm−3. This is an important parameter since the line intensity of  is sensitive, not only to the external magnetic field, but also to the local electron density through collisional de-excitation. Photons from the ionized and excited Fe ions are analyzed and detected using a flat-field spectrometer (Shi et al. 2014) equipped with an Andor CCD detector (model number DO936N-00W-#BN). The spectrometer uses a Hitachi varied-line-spacing grating (1200 L mm−1, part number 001-0659) (Harada et al. 1999) and operates in the wavelength region of 220–320 Å with a spectral resolution of 1200 (see Figure 2). Figure 2 shows Fe x spectra obtained in the wavelength range of 222–270 Å at electron beam energy of 230 eV before and after the injection of C10H10Fe. By comparison and calibrated with nitrogen and oxygen lines in the background, five Fe x lines are identified, shown in Table 1. The experimental wavelengths in the present work are also compared to the wavelengths from CHIANTI (Landi et al. 2012) and the NIST database (NIST 2015). The blended (4–1 and 5–1) and the 6–1 lines of interest in our present work are also observable in Hinode spectra (Brown et al. 2008).
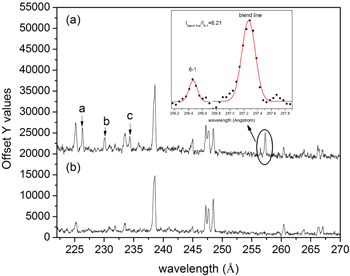
Figure 2. Spectra of Fe x taken at the Shanghai-HtscEBIT (Xiao et al. 2013) by using a flat-field spectrometer (Shi et al. 2014), at the electron beam energy of 230 eV with a beam current of 8.1 mA and the magnetic field 0.16 T. (a) Injecting C10H10Fe. (b) Non-injecting C10H10Fe. The insert shows Gaussian fits to the two lines marked as blended (4–1 + 5–1) and 6–1 in the figure, and the notation is explained in Figure 1.
Download figure:
Standard image High-resolution imageThe theoretical calculations are described in detail in Li et al. (2015). We are using the multiconfigurational Dirac–Hartree–Fock method based on a restricted active space of configuration state functions (Roos et al. 1980; Olsen et al. 1988; Brage & Fischer 1993) to calculate the atomic structure and radiative transitions. These results are then combined with the collisional-radiative modeling (CR modeling; Ralchenko et al. 2011) implemented in the Flexible Atomic Code (Gu 2008), to calculate the behavior of the intensity ratio of the blended (4–1 + 5–1) line with the 6–1 line as a function of the  fine structure and an applied magnetic field for EBIT conditions (see Figure 3).The CR modeling was successfully used in previous publications (Ralchenko et al. 2006, 2011) to analyze and identify spectral line positions and line intensities. We took 560 levels into account in the model and considered the electron-impact excitation, de-excitation, and radiative transition (electric-dipole (E1), electric-quadrupole (E2), electric-octupole (E3), magnetic-dipole (M1), magnetic-quadrupole (M2), and magnetic-octupole (M3) transitions) to build a balanced system. In order to interpret our experimental results we have modeled the effect of the EBIT geometry on the polarization of the spectral lines studied in this work. The inclusion of polarization makes a change to the deduced value of
  on the order of 3%.

Figure 3. Line ratio of the blended (4–1 and 5–1) and the 6–1 lines as a function of  in an EBIT at a beam energy of 230 eV (see Figure 1 for definitions). As this is done for an EBIT, the electron energy distribution is considered to be Gaussian with an FWHM of 15 eV.
Download figure:
Standard image High-resolution image3. RESULTS AND DISCUSSION
From the data presented in Figure 2 we can extract a value for the line ratio of the blended line and 6–1 to be 6.2 with an uncertainty of 14% by fitting Gaussian profiles to each of the lines (see Figure 2). Based on the EBIT conditions for the magnetic-field strength and electron density, we obtained the  fine structure to be 3.5 cm−1 from Figure 3, at which the Zeeman splitting is basically 14% of the fine structure at 0.2 T. This value is close to the recommended value from solar observations of 5 cm−1 (Sandlin 1979), determined from transitions from higher levels. Equally important is the fact that our upper limit is 7.8 cm−1, which confirms that the splitting is small enough for the MIT-intensity to be sensitive to magnetic fields in the active solar corona range. But determining this fine-structure energy by a direct experiment is still needed in the future. We note that there is a possible line blending for the 6–1 line from Fe xiii at 256.4 Å (Landi et al. 2012); however, the electron beam energy used in our experiment cannot produce such a high-charge iron state.
At the fine-structure energy of 3.5 cm−1 the ratio of the blended line to the 6–1 line will show a change of around 12% for a 40% change in electron density. Hence, for our method to be applicable to the solar environment a measurement of the electron density will be needed. Incidentally, in Young et al. (2007) it was proposed to use the line ratio of the blended line with another line from Fe x as a density diagnostic, but this method would suffer from the MIT line. We can use other lines from the same charge state to determine the density and temperature, e.g., the M1 transition within the ground configuration is one of the coronal lines used to determine the temperature of the corona and is known as the corona red line (Swings 1943) and the line at 175.265 Å provides an excellent density diagnostic when taken as a ratio with any of the other four lines at 174.526, 177.240, 184.534, and 190.046 Å (Brosius et al. 1998).
We also propose a method to measure the magnetic field in the solar corona using the intensity ratio of the (4–1 + 5–1) lines with the line marked as 7–1 in Figure 1, which is too weak to be observed in the EBIT spectrum. The 6–1 line cannot be used in the corona spectrum since this line is blended by a He ii line at 256.317 Å. In Figure 4 we show this line ratio as a function of a magnetic field for two different corona conditions. Under the quiet Sun (Warren & Brooks 2009) conditions, we are assuming an electron density of 5 × 109 cm−3 and a Maxwellian electron temperature of 90 eV. The other condition is for an active region (Warren et al. 2011), and here we are assuming an electron temperature, again Maxwellian, of 180 eV and an electron density of 1 × 1010 cm−3. The modeling of the line ratio was done using our own atomic data as described above. We have tested our ideas by modeling the MIT in Ne-like Ar, as discussed in Beiersdorfer et al. (2003). Using the published line ratios and the EBIT conditions discussed in Beiersdorfer et al. (2003) we could estimate the known Ne-like Argon fine structure to within 10%, giving us extra confidence in our methods.

Figure 4. The computed (see the text) line ratio of the (4–1 + 5–1) line and 7–1 as a function of magnetic-field strength, B, for quiet Sun (QS) and active region (AR) solar corona conditions. B values range from 0 to 0.2 T and  is 3.5 cm−1, from this work.
Download figure:
Standard image High-resolution image
As a matter of fact, the Fe x lines discussed in this paper have been observed in the EUV spectrum of the corona with the SERTS sub-orbital instrument (Thomas & Neupert 1994) and the EIS instrument on Hinode (Young et al. 2007; Brown et al. 2008) using quite short exposure times of a few seconds and these indeed appear differently at different corona conditions. This exposure time could presumably be increased to get better line intensities and hence more accurate line ratios. Note that the spectral recording time is much shorter than average flare lifetimes so it should be possible to monitor the change in the magnetic-field strength even for longer exposure times.
With currently available space instruments it may indeed be difficult to perform a real quantitative field measurement, although it could be possible to measure the rate of change of the field. However, there is a strong current interest in devising new space-based instruments using the Hanle effect to measure the coronal field strength. Our method requires much less modeling than measurements based on the Hanle effect and does not need a spectrometer to record the spectra, so a monochromator with a few-angstrom bandpass may be enough. Such an instrument should be optimized to operate in the spectral region of interest. In this way it should be possible to measure the line ratio with better precision. It should be noted that the Solar-C mission would have a spectrometer with close to the required resolution, albeit not covering the 257 Å region.
The sensitivity of the measurement in the solar corona will depend on how accurately the line ratio can be measured. Currently the lines suggested in this paper can be seen by the spectrometer on board Hinode, but a real determination of the active coronal magnetic field will require a dedicated instrument optimized for measuring the line ratio.
4. CONCLUSION
To conclude, we have made a determination of the  fine-structure energy based on the fact that the
  level is affected by an externally applied magnetic field. This fine structure is critical in determining the sensitivity of the decay of the
  level to the applied magnetic field and hence to the possibility of a method to measure the solar corona magnetic field from this magnetically induced transition. Finally, we propose a method for using Fe x line ratios to determine the coronal magnetic-field strength. This is not as sensitive as the direct measurement of the 4–1 to 5–1 ratio described in Li et al. (2015), but it requires less spectral resolution.
This work was supported by the Chinese National Fusion Project for ITER No. 2015GB117000, Shanghai Leading Academic Discipline Project No. B107. Helpful discussions with and suggestions from Philip G. Judge are gratefully acknowledged. We also gratefully acknowledge support from the Swedish Institute under the Visby programme. W.L. and J.G. would like to especially thank the Nordic Centre at Fudan University for supporting their exchange visits between Lund and Fudan Universities. We would like to thank the referee of our previous ApJ paper (Li et al. 2015) for very helpful suggestions during the editorial process.