


Abstract
We present the Open Supernova Catalog, an online collection of observations and metadata for presently 36,000+ supernovae and related candidates. The catalog is freely available on the web (https://sne.space), with its main interface having been designed to be a user-friendly, rapidly searchable table accessible on desktop and mobile devices. In addition to the primary catalog table containing supernova metadata, an individual page is generated for each supernova, which displays its available metadata, light curves, and spectra spanning X-ray to radio frequencies. The data presented in the catalog is automatically rebuilt on a daily basis and is constructed by parsing several dozen sources, including the data presented in the supernova literature and from secondary sources such as other web-based catalogs. Individual supernova data is stored in the hierarchical, human- and machine-readable JSON format, with the entirety of each supernova's data being contained within a single JSON file bearing its name. The setup we present here, which is based on open-source software maintained via git repositories hosted on github, enables anyone to download the entirety of the supernova data set to their home computer in minutes, and to make contributions of their own data back to the catalog via git. As the supernova data set continues to grow, especially in the upcoming era of all-sky synoptic telescopes, which will increase the total number of events by orders of magnitude, we hope that the catalog we have designed will be a valuable tool for the community to analyze both historical and contemporary supernovae.
Export citation and abstract BibTeX RIS
1. Introduction
Whether observed or synthesized, data begets analysis, and organized and open access to this data for independent analyses or large case studies is critical to its utility. For relatively young sub-fields in astronomy, such as the exoplanet community, many have advocated for open data access (Wright et al. 2011; Rein 2012), and the result has been an abundance of rapid scientific progress enabled not just by the data collectors, but also the broader community with access to that data. Older astronomical sub-fields such as variable stars have similarly benefited from communal efforts, including support from secondary schools and amateur astronomers (Kinne 2012).
For discoveries of exploded stars and their remnants, there have been several historical catalogs that detail all available metadata (Clark & Caswell 1976; Flin et al. 1979; Green 1984, 1988; Barbon et al. 1999; Tsvetkov et al. 2004; Lennarz et al. 2012). Today resources on the web, such as David Bishop's "Latest Supernova" page and Dave Green's "Catalog of Supernova Remnants," have since facilitated the continuous influx of more recent discoveries.4 ,5
As for supernova science and the collection of published observations, it is often said the data scene is as messy as it is unpopular. Foreseeing the need for an extensive comparative study of all types of supernovae, David Branch and associates issued a bulletin in 1982 for the collection of all spectroscopic and photometric supernova data published within the literature. In addition to constructing an interactive database, their vision included displaying the data graphically in a uniform format to facilitate comparative studies of supernovae (Branch et al. 1982).
Later in the 1990s, David Jeffery kept a personal repository of available data.6 This effort eventually led to the creation of the Supernova Spectrum archive (SuSpect) by the Supernova Group at the University of Oklahoma (Richardson et al. 2001), which collected nearly 1800 spectra by 2007 through donations, individual requests, and digitizing in some instances (Casebeer et al. 1998). A unified collection of photometric observations was also pursued by SuSpect, and to a larger extent by the ITEP-SAI Supernova Light Curve Catalog7 built by P.V. Baklanov, S.I. Blinnikov, D.Yu. Tsvetkov, and N.N. Pavlyuk.
Additional repositories of supernova observations have since included the CfA SN Archive8 and UC SuperNova DataBase9 (Silverman et al. 2012a), and select data have also been released by the Nearby SuperNova Factory (SNfactory; Aldering et al. 2002); the Supernova Legacy Survey (SNLS; Balland et al. 2009); the Palomar Transient Factory (PTF; Rau et al. 2009); the La Silla-QUEST Southern Hemisphere Variability Survey (LSQ; Baltay et al. 2012); the Carnegie Supernova Project (CSP; Folatelli et al. 2013); the All-Sky Automated Survey for Supernovae (ASAS-SN; Shappee et al. 2014); the Panoramic Survey Telescope & Rapid Response System (PS1; Rest et al. 2014); and the Public ESO Spectroscopic Survey of Transient Objects (PESSTO; Smartt et al. 2015). Since the more recent creation of the Weizmann Interactive Supernova Data Repository10 (WISeREP; Yaron & Gal-Yam 2012) and the Transient Name Server11 , there has been an ever-growing interest in bringing supernova science closer to an "era of big data," with the collection of over 13,000 publicly available supernova spectra.
Still, no single repository has amassed all available lights curves and spectra, and numerous published data sets remain bounded to the original paper. Furthermore, no repository currently exists for X-ray and radio observations of supernovae. Stephan Immler once maintained a webpage with the names of supernovae detected in the X-rays; however, this site12 has since moved to an unknown location.
Despite the incremental progress that has been made, a large fraction of supernova data remains largely cloistered within the confines of individual supernova groups' webpages, if it is available at all, while a significant number of supernova enthusiasts either rely on David Bishop's Latest Supernova page, or Skywatch13 , for metadata collected (and reported) by today's supernova surveys.
Of the archives and catalogs in place, many also come with longstanding pitfalls and limitations for timely analysis. Primarily, there is little guarantee that data either donated to or sought after by such repositories will make it into public hands at the time of publication, or relatively soon thereafter. As a result, even estimating the total amount of public supernova data that is actually available is difficult, as it can only be bounded by the largest comprehensive catalogs that are available—for example, WISeREP's collection of supernova spectra sans the dozens (if not hundreds) of duplicate copies generated from including both rapid and final reductions of spectroscopic data.
With the growing number of discoveries each year, as well as the millions expected during the era of the Large Synoptic Survey Telescope, there is a clear need for a complete data repository. This conglomerate of data would ideally span follow-up observations from both the most uniform supernovae (e.g., spectroscopically "normal" SN Ia; Graham et al. 2015) and the diverse subsets among thermonuclear, core-collapse, and more exotic events. For the benefit of reproducability of scientific results, there is also an impetus to make the data that was used to come to the conclusions presented in published literature publicly available.
Unfortunately academic journals and institutions have yet to enact a collection policy for published supernova data. Consequently, unless the data happens to be donated to a repository some years or even decades after the data were obtained (e.g., the day +611 spectrum of SN 1994D; Blondin et al. 2012), such observations have the potential to be lost indefinitely. In addition, published observations that have not been made public imply that some theoretical models that have been deemed successful for select events are not also constrained by the wealth of other spectroscopically similar observations; numerous observations have yet to be fully explained by any model, and these missing published data sets have typically only been analyzed once by a single group (or even single person), and to varying degrees of completeness.
In this work we present the Open Supernova Catalog, which represents an ongoing community-driven project to collect and clean supernova metadata and observations spanning X-ray, ultraviolet, optical, infrared, and radio frequencies. At present, ∼14,000 events in the catalog include light curves with at least five photometric points, and in total the catalog contains ∼400,000 individual photometric detections. Within the catalog there are ∼5000 supernovae that include spectra, with ∼16,000 spectra in total.
In Section 2 we overview the guiding principles for the Open Supernova Catalog. In Section 3 we outline the current capabilities of the catalog and describe how users can contribute their own data to the catalog. In Section 4 we present an incomplete list of ideas for potential applications of the catalog. In Section 5 we comment on our ongoing and future work, including an estimate of the quantity of data that the catalog is missing, and where we might find such data. In Section 6 we summarize and provide final remarks.
2. Guiding Principles
In creating this catalog, we aspire to meet a set of guiding principles that we believe form the basis for an objectively useful resource. While it is difficult to meet all these criteria simultaneously, we believe the general system we have selected is capable of at least pushing us toward the ultimate goal of making all public supernova data as readily accessible as possible.
The objects we include in the catalog are intended to be entirely supernovae (i.e., the complete destruction of a star by an explosive event that may or may not leave behind a compact remnant), and we actively remove objects that have been definitively identified as other transient types. One difference between our approach and some other supernova catalogs is that we augment the known supernovae with known supernova remnants (Green 2014; Maggi et al. 2016), which are thought to be supernovae but (currently) with no known associated transient. As records continue to be studied and reveal historical observations (see Neuhaeuser et al. 2016 for a recent example), the prospect that these remnants will one day be associated with newly uncovered data remains an enticing possibility, and thus we believe that these remnants should be included among the observed supernova transients for completeness.
2.1. Completeness and Persistence
One of the primary objectives for the Open Supernova Catalog is to have a complete collection of public data. For supernovae, this includes near-visible spectra and photometry (i.e., UV, optical, IR), as well as observations at X-ray and radio frequencies. Our goal is to include data not only from the latest supernovae, but also from the very oldest, such as the light curves and spectra of SN 157214 , i.e., Tycho's supernova (Ruiz-Lapuente 2004; Krause et al. 2008), such that the Open Supernova Catalog becomes a reliable first destination for exploring the supernova data set.
Equally important is that once the available data is included in the repository, it remains publicly available alongside all observations for a given event, even in the event that the creators of the catalog (the authors) do not actively maintain it anymore. This is facilitated by keeping as much of the data as possible on a freely available service such as github, as the data set can be cloned and forked by other users to provide data redundancy and permanence. Even if github (or the authors) ceased to exist, our intention is to have cloned copies of the Open Supernova Catalog on as many hard drives as possible, whereas currently the data associated with many historical supernovae have zero redundancy (i.e., a single copy exists on a single hard drive).
2.2. Community Driven
Any group or individual can donate their data once published and/or made public to the Open Supernova Catalog. To jump-start the catalog, we have collected supernova data from numerous sources on our volition, but as the number of events grows, such an approach will only be sustainable with the active participation of the community.
To maximize community participation, we offer several different ways for users to donate data, which are summarized on our "Contribute" page15 , with the simplest being a simple Dropbox file request through which users can upload folders of data. Small edits are possible directly through the main catalog interface by clicking an icon next to each event's entry (see Figure 2); this takes the user directly to a page where data contributions can be made via a pull request. Finally, users can submit their data in the specific JSON format we have adopted.
Our intention here is to minimize barriers for the data contributor as much as possible, the onus is upon the Open Supernova Catalog to sanitize and agglomerate the donated data. The main factor that the mode of donation will affect is turnaround time, with high-quantity, low-effort data donations (e.g., photometry from dozens of supernovae) being added before low-quantity, high-effort donations (e.g., a single spectrum from a single event). We also respect that many will simply choose to continue to submit their data to other public repositories of supernova data, and we welcome greater connectivity with other services, such that all the publicly available data are accounted for.
2.3. Accuracy and Accountability
The Open Supernova Catalog takes advantage of git's distributed revision control and source code management, in addition to features of the freely available git hosting service github. This enables collaborative corrections to be distributed for incomplete data, or data in need of recalibration, observer frame corrections to spectra, photometric corrections, revisions of metadata, deletions of duplicate observations, and so forth. Anyone can either raise issues or suggest changes to any file for any project directory through github's integrated issue tracking. This can either be done through the github repository16 , or by merging one's own local "forked" repository with the suggested changes.
For every source of data we require a reference, which is preferably a published work (identified uniquely by an ADS bibcode) but is not required to be. Oftentimes we draw from other online catalogs that themselves collected the data from another source; in such cases we explicitly trace the source chain back to the originating source of data, denoting the intermediary sources as "secondary" sources, a designation that also applies to the Open Supernova Catalog.
2.4. Accessibility
A key factor for the success and impact of any catalog is access. In the supernova community, rapid access is particularly useful, as important physical phenomena, such as shock breakouts or interactions with a nearby companion, are manifest in the early-time behavior of a supernova's evolution (Falk & Arnett 1977; Klein & Chevalier 1978; Kirshner et al. 1987; Campana et al. 2006; Schawinski et al. 2008; Soderberg et al. 2008; Bloom et al. 2012; Garnavich et al. 2016). Given that only a finite amount of glass is available to cover the full sky at any time, with many professional sites often being impacted by daylight, weather, or technical issues, the supernova community is often reliant upon amateur astronomers to fill the temporal and spatial gaps. For example, amateur astronomers were crucial in constraining the distance and light curve parameters of SN 2011fe (Tammann & Reindl 2011; Richmond & Smith 2012; see also Vinkó et al. 2012; Munari et al. 2013; Pereira et al. 2013).
Access is also important for public outreach. Indeed many of the primary scientific results involving supernovae remain behind paywalls and are not readily available to the public. Even the simplest of questions the public might ask (how many supernovae have been discovered, for instance) remained difficult to answer prior to the creation of the Open Supernova Catalog. To maximize access to the data set produced by the Open Supernova Catalog, we make it available for download at any time via the output repositories17 within which all individual supernova JSON files are stored.
2.5. Integration
As the data products of the Open Supernova Catalog are all stored on git repositories, all of the supernova data collected can be downloaded locally, enabling analyses that are only limited by the user's available resources. The completeness of data allows anyone to filter and interrogate the latest available data without needing to first collect and plot it themselves, a time-saver that avoids having new accessors of a given data set repeatedly perform the same data extraction procedure.
A recent example of such a data extraction prior to the existence of the Open Supernova Catalog is Sasdelli et al. (2016), where SNe Ia were collected from a variety of sources and presumably homogenized; in principle this exercise only needs to be done once, and it is ideal for data accuracy reasons to perform this homogenization in the open where the process can be double-checked. In turn, the Open Supernova Catalog gives supernova enthusiasts a unique opportunity to access all available data, query data statistics, and engage in an open dialog about the quality of that data.
3. Catalog Capabilities
The Open Supernova Catalog is a module18 built inside a broader project called AstroCats 19 , which is being developed as a simple framework for constructing general astronomical catalogs like the Open Supernova Catalog. AstroCats is a python package providing a simple, nested structure of dictionary-like base classes that mirror the eventual JSON output files. The core data-manipulation routines of the Open Supernova Catalog use objects sub-classed from AstroCats, and extended with additional, supernovae-specific functionality (e.g., accommodating standard supernova naming conventions, and distinguishing between photometry of the event and that of the host galaxy).
In this section, we briefly describe the features of AstroCats as it applies to the Open Supernova Catalog and leave details of the general framework and implementation to a future paper. There are two critical methods that underlie the Open Supernova Catalog's functionality: "import," which both agglomerates data from a variety of online and published sources, and generates individual JSON files for each supernova; and "webcat," which consolidates all supernovae into a single, JSON catalog file and then generates the web documents by which that data will be displayed. In Figure 1 we show how these methods (represented by orange rectangles) pull from the available sources of data, produce outputs, and interact with one another to make the catalog possible.

Figure 1. Flowchart showing how sources of data are combined and used to generate the catalog webpage and its datafiles, where the yellow ellipses are human users, the green diamonds represent git repositories, the blue trapeziums represent internet webpages, the orange rectangles are Python methods, and the red rounded rectangles are JSON files. The solid arrows represent direct input of data in their indicated direction, whereas the dashed arrows represent hyperlinks.
Download figure:
Standard image High-resolution image3.1. Human-readable JSON Files
All supernovae within the Open Supernova Catalog are stored in individual JSON files that bear the name of each event (e.g., SN 1987A is contained within a JSON file simply titled "SN1987A.json"), and the catalog file that collects all supernova metadata is also stored in the JSON format. JSON (indicated by the red rounded rectangles in Figure 1) is a serialized, hierarchical format with minimal complexity, and is typically encoded as human-readable ASCII, although encoding binary data is possible within the format. Because of its simplicity, there exist hundreds of JSON interpreters in dozens of programming languages.20 The hierarchical nature of JSON means that fields can be accompanied by sibling or child fields that can provide additional information on data, such as the source (e.g., citation) or the associated error value.
Unlike the two-dimensional ASCII tables that supernova data is often presented in, data presented in hierarchical formats like JSON can be sparse (i.e., not all values need to share the same set of fields). For instance, the instrument on a telescope used to collect data may be known for one observation but not another. With a sparse format, the observation without this information can simply omit the instrument field. Oftentimes the omission of data in a standard ASCII table is accomplished by assigning a "placeholder" value. For example, the redshift value for a supernova with an unknown redshift may be filled with an unreasonably large value such as 999. Because these placeholders are arbitrary and vary greatly from source to source, it is preferable to omit them, as they can potentially contaminate data sets for those who are not intimately familiar with the placeholder convention that the producer of that data has adopted.
JSON's advantage over pure binary formats is its readability; for instance, a JSON file can be easily checked for errors by eye, whereas a binary-encoded file (e.g., FITS) requires translation by an interpreter before it can be inspected for errors. When disk space is at a premium, storing data as binary can be significantly more efficient than ASCII, but much of this benefit is mitigated by simply compressing the ASCII files, which most web servers perform before delivering data to a visitor anyway. As an example, our largest JSON file presently belongs to SN 2013dy. The uncompressed JSON file for this event is 144 MB in size, whereas the version compressed with gzip is only 22 MB, which is almost as small as the data would be in pure binary format (∼10 MB) and requires only a fraction of a second to read from increasingly ubiquitous solid state drives.
A similar format to JSON is XML, which is more powerful but also more verbose than JSON, and is currently the markup of choice for the VOTable21 and VOEvent (Seaman et al. 2011) standards. The disadvantages of XML are that it uses somewhat more space than JSON, as both opening and closing tags are required for every field, and that the format is intrinsically more complicated than JSON and is thus more difficult for users to read, which in the opinion of the authors makes it less accessible to those not familiar with its syntax. That being said, it is trivial once the data has been standardized into a serialized format like JSON to export it to another like XML, and as we describe in Section 5, we plan to add VOTable outputs for each event as complements to our JSON database.
3.2. Client-side Tabular Interface
For catalogs of data intended for web delivery, a choice needs to be made whether the catalog will be stored client-side or server-side. Server-side catalogs exchange a minimum of data with the client and are only limited by the processing capacity of the server, and can enable interaction between the user and catalogs, which may contain billions of entries. Client-side catalogs are limited by the bandwidth of the server and the computing power of the client's computer, and are practically limited to smaller catalog sizes that the client's computer can handle. The problem of storing the whole of astronomical data, especially in the upcoming era of wide-field surveys, is an immense computational challenge, and the machines that serve such data will need to consist of many thousands of CPUs and many petabytes of disk space, which favors the server-side model.
However, for a given astronomical sub-field, the total number of objects is typically much more manageable, and even for an extremely mature field (e.g., observations of supernovae), the total number of objects rarely exceeds the tens of thousands. For such a sample size, the total metadata content in uncompressed form is typically only tens of megabytes (MB), and only a few MB after data compression (e.g., gzip). While MB of data posed issues prior to the ubiquity of broadband internet, such a catalog can be delivered and rendered by the client in seconds on modern-day networks, and with optimization, catalogs of hundreds of thousands of objects can still yield better performance and usability than equivalent server-side solutions.
Once the data has been delivered to the client, data access is only limited by the processing power and memory speed of the client. This results in a significantly smoother user experience than server-side solutions, which can be excruciatingly slow when overloaded, as is typical of many under-funded and under-supported web resources that astronomers and astrophysicists rely upon. Searches and filtering of the data can be orders of magnitude faster when performed client-side, a difference that can result in greatly enhanced productivity, especially in the early phases of a project when scientists are forming and testing their ideas.
For the Open Supernova Catalog, our tabular web interface is powered by the DataTables software package written for jQuery, a widely used JavaScript library for creating online interactive tables (Figure 2). DataTables can be run in both client- and server-side modes, and we choose client-side for the reasons stated previously. While the client-side approach should scale to hundreds of thousands events without issue, the full supernova population may number in the millions in a decade, at which point a complete conversion to a server-side model, or even a hybrid client/server-side model, would be possible. If such a conversion is performed, the same level of accessibility to the catalog and its data must be retained.
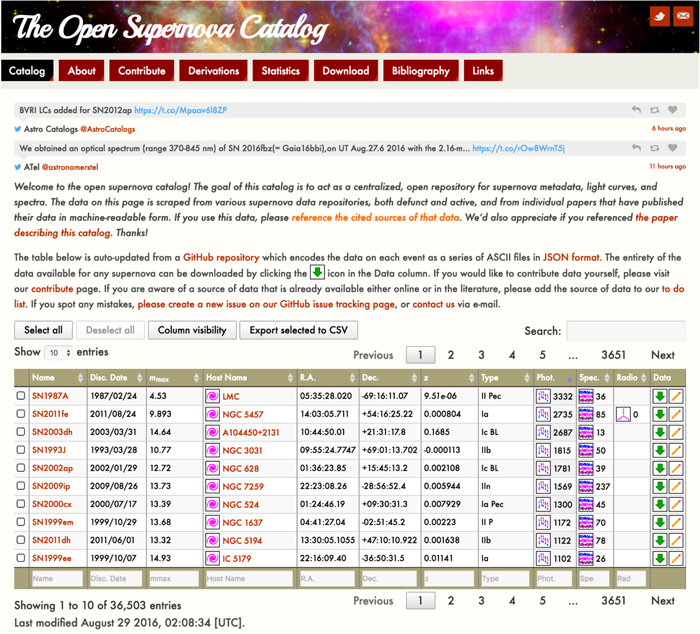
Figure 2. Screenshot of main interface as it appears on the homepage of the Open Supernova Catalog, https://sne.space. The front-facing table is intended to be a user-friendly, rapidly searchable database of supernovae, with instant access to the full data set associated with each event via the download button (the down-facing arrow) in the rightmost column. Each event can be edited directly by clicking the "pencil" icon in the rightmost column, which takes the user to a github edit page for that particular event. The search bar in the upper right performs simple searches of all columns, whereas the fields at the bottom of the table enable searching of each individual column. Counts of the amount of photometric detections and available spectra are displayed in their own columns. Additional columns which are not shown by default (such as event aliases, luminosity distance, etc.) are accessible via the "column visibility" button. The webpage has been optimized for both desktop and mobile browsers, and loads the full metadata catalog in its entirety in seconds on a broadband connection.
Download figure:
Standard image High-resolution image3.3. Version Control with git
Whereas DataTables is the face of the Open Supernova Catalog, its heart is git, a standard version control software package. The entirety of the catalog, including its interface software, input data, the individual JSON event files, the primary catalog JSON file, and the scripts written to generate the catalog and event files, are stored as git repositories on github (green diamonds in Figure 1). This offers an unprecedented level of detail and accountability for the data presented on the Open Supernova Catalog, enabling precise determinations of when its contents changed, how they were changed, and who was responsible for the changes. This is in stark contrast to closed catalogs, which at best may track changes internally but offer no mechanism for external scrutiny.
In constructing the Open Supernova Catalog, we have found dozens of errors in both published and unpublished sources, and continue to find errors on a regular basis (see Section 5.1.1). Once these errors are found, they are documented as issues on github and eventually corrected, but in principle these errors can easily propagate to future works if left unchecked. When the data is stored in a version control environment such as git, the best practice for a paper that utilizes aggregated or generated data is to use the commit hash associated with the version of the data they used. And if errors are corrected after publication that may affect a publication's results, the commit history of the data can be inspected to determine what adjustments are required, such that the propagation of the error is minimized.
3.4. Adding Data and Their Sources
Two important aspects of collecting data is having a reasonable way of reconciling different data values from different sources, and ensuring that the genesis of the data that appears in the final product is not lost in the collection process. For any data quantity to be added to the Open Supernova Catalog, the quantity must have a citation before the import script will allow the value to be added. If the value agrees with the value reported by another source, the system links that value to both sources.
In practice this is done by maintaining a sources array in the individual event JSON files that details all sources of data used to generate the file, and then adding a source property to every data quantity which refers back to the event's source list. A human-readable schema description is available within the primary Open Supernova Catalog repository22 , which should always be checked for the latest schema. Below we provide an example of what the schema looks like in the JSON file for SN2011fe at the time of this paper's publication. Ellipses are shown where data has been omitted for brevity:
| ... |
| "schema":".../SCHEMA.md", |
| "name":"SN2011fe", |
| "sources":[ |
| ... |
| { |
| "name":"Maguire et al. (2014)", |
| "url":"...", |
| "bibcode":"2014MNRAS.444.3258M", |
| "alias":"3" |
| }, |
| ... |
| { |
| "name":"Asiago Supernova Catalog", |
| "url":"...", |
| "alias":"9", |
| "secondary":true |
| }, |
| { |
| "name":"ATel 3581", |
| "url":"...", |
| "alias":"10" |
| }, |
| { |
| "name":"Latest Supernovae", |
| "url":"...", |
| "alias":"11", |
| "secondary":true |
| }, |
| ... |
| ], |
| ... |
| "ra":[ |
| { |
| "value":"14:03:05.76", |
| "source":"3", |
| "unit":"hours" |
| }, |
| { |
| "value":"14:03:05.81", |
| "source":"9", |
| "unit":"hours" |
| }, |
| { |
| "value":"14:03:05.80", |
| "source":"10,11", |
| "unit":"hours" |
| } |
| ], |
| ... |
| "photometry":[ |
| { |
| "time":"55799.0045", |
| "u_time":"MJD", |
| "band":"W2", |
| "system":"Vega", |
| "magnitude":"17.579", |
| "e_magnitude":"0.152", |
| "telescope":"Swift", |
| "instrument":"UVOT", |
| "source":"8" |
| }, |
| ... |
| { |
| "time":"55798.00", |
| "u_time":"MJD", |
| "frequency":"8.5", |
| "u_frequency":"GHz", |
| "fluxdensity":"0.0", |
| "e_fluxdensity":"25.0", |
| "u_fluxdensity":"Jy", |
| "instrument":"VLA", |
| "source":"2" |
| }, |
| ... |
| { |
| "time":["55800.443", "55801.042"], |
| "u_time":"MJD", |
| "energy":["0.5", "8."], |
| "u_energy":"keV", |
| "flux":"7.5e-16", |
| "unabsorbedflux":"7.7e-16", |
| "u_flux":"ergs/s/cm∧2", |
| "photonindex":"2.", |
| "counts":"1.1e-4", |
| "upperlimit":true, |
| "instrument":"Chandra", |
| "nhmw":"1.8e20", |
| "source":"4" |
| }, |
| ... |
| ], |
| ... |
| "spectra":[ |
| { |
| "instrument":"LT --- FRODOspec", |
| "u_time":"MJD", |
| "time":"55797.0", |
| "filename":"11kly_20110824_LT_v1.ascii", |
| "waveunit":"Angstrom", |
| "fluxunit":"erg/s/cm∧2/Angstrom", |
| "data":[ |
| ["3900.399902", "9.784687E-15"], |
| ... |
| ] |
| "source":"10,23" |
| }, |
| ... |
| ] |
| ... |
In this example, three different values for the right ascension of SN2011fe have been reported by four different sources. Two of the sources are tagged with a secondary Boolean value to indicate that they themselves are not the original sources of this data, but collected the data from other sources. In this way, the full source chain by which a value was acquired can be traced back to its original source, and the user of the catalog can decide which value they would like to utilize when performing data analysis. As explained in Section 5.1, not all data is added from all sources. We perform some basic quality control before a piece of information is appended to a supernova. A complete table of all published sources we draw from is available via a bibliography table that is constructed from the catalog23 (4000+ published sources as of 2016 May 2).
Photometry and spectra have a separate set of tags unique to each of them that provides all known data regarding a particular collected observation, which helps identify similar data sets that may refer to the same set of observations. For photometry, an observation can be reported in terms of a magnitude in a particular band, flux, or fluxdensity, depending on whether the observation is IR/optical/UV, radio, or X-ray; one of each case is presented in the example given previously. As photometric errors are closer to Gaussian in flux-space, photometric observations also support the flux and count tags that are used when the original source provides these values; unfortunately, the majority of historical supernova photometry has been presented in magnitudes. Spectra are tagged with the file name they originated from, as spectral data is usually delivered in the form of a single FITS or ASCII file per spectrum. This provides another consistency check for the origin of a given spectrum in addition to the sources tag. Both photometry and spectra are tagged with survey, observatory, observer, reducer, telescope, and instrument tags, if these are known.
3.5. Individual Supernova Pages
For supernovae where observations have been made available, these data and the related metadata are displayed on individual event pages. Shown in Figures 3 and 4 are examples of the graphical interfaces used by the Open Supernova Catalog, in this instance for most of the publicly available observations of the well-observed SN 2011fe (Nugent et al. 2011; Maguire et al. 2012; Matheson et al. 2012; Parrent et al. 2012; Richmond & Smith 2012; Vinkó et al. 2012; Pereira et al. 2013; Maguire et al. 2014; Mazzali et al. 2014, 2015; Graham et al. 2015; Taubenberger et al. 2015; Smitka et al. 2016).

Figure 3. Screenshot from interactive plotting of photometry for SN 2011fe, available at https://sne.space/sne/SN2011fe.
Download figure:
Standard image High-resolution image
Figure 4. Screenshot from interactive plotting of time-series spectra for SN 2011fe, available at https://sne.space/sne/SN2011fe.
Download figure:
Standard image High-resolution imagePhotometric points are presented in terms of both apparent and absolute magnitudes along with the observer frame time relative to MJD and the Gregorian calendar. Along with the magnitudes in a given band filter, additional bits of metadata such as the observatory, telescope, and instrument used to collect the data are also included, as well the photometric system the magnitudes are reported in. Time-series spectra are plotted sequentially within a single interactive window, which enables anyone to inspect select spectral features and their respective evolutions prior to and after maximum light (see, e.g., Black et al. 2016). Within each graphical display, a user can hover over individual photometric and spectroscopic data and recover select pieces of relevant information (e.g., the number of days since maximum light for a given spectrum; see Figure 5). Spectra are presented in both the observer and rest frames 1, except in certain cases where the frame is not known.

Figure 5. Screenshots of additional information available when hovering over individual photometric observations (left panel) and individual spectra (right panel) in the interactive plotting for SN 2011fe, available at https://sne.space/sne/SN2011fe.
Download figure:
Standard image High-resolution imageFor each radio observation, we report the start and end time (in MJD, observer frame), the central frequency of observation (in GHz, observer frame), the measured flux density at that frequency at the transient position (in micro Jy), and the  rms (in micro Jy). X-ray observations include both the start and stop time (in MJD, observer frame); the energy band utilized (in keV, observer frame); the measured count-rate; the observed flux (i.e., absorbed, both by the Galaxy and intrinsically, units of
  ) and related uncertainty (
 confidence level, unless stated otherwise); the Galactic neutral hydrogen column density used in the fit (units of
  ); the best-fitting intrinsic neutral hydrogen column density at the redshift of the source (units of
  ); the unabsorbed flux (where both the Galactic and the intrinsic absorption have been accounted for) and associated uncertainty (
 confidence level, unless stated otherwise); and information about the spacecraft/instrument and the reference to the source of data. The spectral model used to fit the data and derive the fluxes provided is indicated with an acronym (e.g., PL stands for power-law). The best-fitting values of the other parameters of the fit (and their uncertainties) are also listed. Upper limits are provided at the
  confidence level, unless otherwise noted.
3.6. Contributing Data
Because we have already collected data from most existing public repositories, much of the catalog's future growth is now dependent upon individual donations. At the moment we offer four different ways for users to contribute their data, with the main intention being a minimization of the amount of effort on the part of both the submitters and receivers of that data. As we describe in Section 5, the particular means of data contribution we summarize here may evolve to address any community concerns and to make data contribution even simpler, so users of the Open Supernova Catalog should always check our data contribution page24 for the latest instructions on how to contribute data.
- 1.For photometry and metadata, we highly recommend that users submit their data to the VizieR service and then inform us when it is available, either via our to-do list or via e-mail. Once in VizieR, it is trivial to pull the data into the Open Supernova Catalog, oftentimes with only a couple lines of Python. This way, users' data is not just available via the Open Supernova Catalog, but also to the broader community who may not know the Open Supernova Catalog exists.
- 2.Small contributions of data can be provided manually by clicking the edit link (the pencil icon; see Figure 2) next to each entry on the main catalog page. This will take a user directly to a github edit page, where the user can add data directly in the JSON format. When this edit is saved, github will automatically submit a pull request to our "internal" GitHub repository.25 When data is contributed in this way, the submitted JSON file should conform to our format specification (see Section 3.4), with any formatting issues being mediated via the pull request system.
- 3.The simplest way for a user of the Open Supernova Catalog to submit data is to upload the data to a Dropbox file request we provide on the contribution page. We have no specific format requirements for such donations, but use of standard file formats will expedite the addition of data to the catalog and is highly recommended. All uploads should include a README file that describes the data, with the README containing the basic contact info of the uploader. The data should also include at least one reference, preferably with an associated ADS bibcode, for source attribution. The data itself should preferably be human-readable ASCII (JSON, CSV, XML, etc.), but if not, a Python script should be included that will read the data into memory.
- 4.If a user plans to make bulk contributions to the catalog but does not want to convert their data to the JSON format, the preferred method is to submit a pull request to one of our external data repositories, and optionally editing the import itself to parse that data (done by adding a small Python script to a tasks directory in the supernova module26 ). Editing the import might be a preferable solution if a user is in charge of a data source that updates on a regular basis, as the user will be able to adapt the importation to any changes that are made to the source. Because of github repository size limits, the external data the import relies upon27 ,28 ,29 ,30 ,31 are split into a few different repositories.
4. Utility of a Comprehensive Catalog
A comprehensive catalog foremostly enables finding systematic errors (e.g., identifying the true type of an event that may have been misclassified); understanding the current completeness of the data and optimizing data collection of future surveys; evaluating data quality of current samples (e.g., accessing spectroscopic coverage in terms wavelength and days since maximum light in order to refine future community-driven follow-up campaigns); and determining the mean number of papers per light curve and/or per cumulative set of spectra (i.e., how much effort was needed to generate a given set of data). Additionally, a comprehensive catalog reduces unnecessary overhead for studies with selection criteria (e.g., querying those events with available multi-wavelength observations in the X-ray and/or radio in order to understand the environments around supernovae).
Quick science is another outcome of a comprehensive catalog. Examples include estimating the number of supernovae of a given type discovered and/or observed per year, and its dependence on redshift (cf. Maoz et al. 2012); determining the frequency of supernova type by galaxy type, and its relation to galactocentric distances assuming a volume limited sample (Li et al. 2011; Wang et al. 2013; Graur et al. 2016a, 2016b); identifying noteworthy supernova factories (e.g., NGC 2770; Jha et al. 1999; Soderberg et al. 2008); and using the available photometry to estimate a (pseudo-) bolometric light curve per event, where appropriate.
A comprehensive catalog can also lead to the creation of more complex, real-time diagnostics of the latest data. This can generally be anything from finding commonalities between seemingly different supernova types, to generating mean spectra and exploring spectroscopic diversity (Benetti et al. 2005; Branch et al. 2005, 2006, 2007, 2008, 2009; Wang et al. 2009; Blondin et al. 2012; Folatelli et al. 2013; Maguire et al. 2014; Sasdelli et al. 2015, 2016; Kromer et al. 2016).
5. Ongoing Work and Future Features
While we believe that the Open Supernova Catalog already addresses many of our guiding principles (Section 2), there are a number of improvements that can be made to further meet these goals. In addition to the example uses highlighted in Section 4, there are certainly many questions on the nature of supernovae that have yet to be asked, simply because we are only just now collecting the data in a single location. While we believe that the Open Supernova Catalog in its present form should be useful to scientists, much work remains to be done to improve upon the presentation and quality of the data we have collected.
5.1. Clean-up and Standardization
A catalog can choose to engage in wholesale collection of all available data without vetting that data for quality, duplicity, and obvious errors, and for the Open Supernova Catalog, we prefer to collect all data, even if the data may have unresolved issues. However, one of the benefits of collecting all available data in one place is that aberrant values can be directly compared and used to establish a consensus. In the following subsections we describe our strategies for homogenizing, cleaning, and presenting data that originate from a wide variety of heterogeneous sources.
5.1.1. Metadata
Before adding values from a source to the catalog, we perform some basic quality control checks to ensure that the final JSON file only includes the most accurate data, although we err on the side of inclusion when the relative quality of two differing data values is ambiguous. For any textual data (such as host galaxy names or supernova types), quantities are run through a synonym list appropriate to that data type and are always added unless the datum is known to be in error (i.e., a typo). For numerical data, values with attached error bars are retained over values without error bars, and for data without error bars, values with the most significant digits are preferentially retained. For dates, we retain values with the most chronological information; for instance, a discovery date of 2014 would be dropped in favor of 2014/06/03 if this date is provided in another source.
Name resolution (i.e., when a supernova has more than one name in two or more surveys) is also done by combining alias information from all sources that provide such data. Events are merged such that supernovae all appear under the same name, with the IAU SNYYYYxxx format being preferred, if it is available. If an event lacks an IAU name, the discovering survey name is preferred. As determining whether two events are the same or not often requires directly inspection of imaging, we offer a "duplicate finder" page32 on the Open Supernova Catalog, so that observers can suggest to us which events should or should not be listed under multiple names.
Frequently two or more conflicting values will appear in different sources for the same supernova. Finding and resolving these conflicts is paramount to maintaining a high-quality data set. Because oftentimes the conflicts cannot be resolved without referencing the original images or the collected spectra (both of which may or may not be public), we provide another community tool, a "conflict finder" page33 , to mark values as being erroneous, so that they can be ignored on subsequent imports.
5.1.2. Light Curves
Supernova photometry suffers from a few pathological issues that are difficult to resolve without amassing a large collection of data. Among these issues are not knowing which photometric system magnitudes are reported in; whether the photometry has been S- and/or K-corrected or not; how and if the host galaxy light was subtracted; the definitions of the photometric filters employed; using fluxes and flux errors rather than magnitudes; and the lack of error bars. These details are often elucidated in the source material, but the inclusion of such details is haphazard and of varying verbosity. Our principle goal is to collect photometry in its presented form and to label that data with as much metadata as possible, as we believe the best practice is to let the users of that data apply whatever corrections they believe to be appropriate for their case.
For future data collection, our stated preference is for the raw light curve data to be accompanied by color corrections that enable the ideal scenario of displaying each supernova unextincted at z = 0, but the data should always be delivered in its raw form with the corrections being provided as separate entries. While the Open Supernova Catalog currently displays photometric data as submitted, the data that is displayed on an individual supernova webpage in the future will take advantage of any provided corrections such that different supernovae (or different data sets collected on the same supernova) can be compared by eye more directly. Such cleanup will only be performed if we are confident that the source of data did not perform any corrections themselves, and will only affect the visual appearance of the light curves on the individual supernova pages.
5.1.3. Spectra
Two longstanding issues with the quality of optical spectra have been the application of ambiguous redshift corrections and the removal of telluric features. Subtracting telluric features from supernova spectra are important for taking measurements of certain features (e.g., blends of O i λ7773 and Mg ii λ7869, 7890). However, in the event that shared data has been ambiguously corrected for redshift, and undocumented as such, telluric features serve a useful purpose when resetting the spectrum to a proper observer frame.
This issue was first noticed by the administrators of SuSpect during the 2000s, where some of the spectra were successfully reset to a proper observer frame in subsequent works. However, these data were later collected by WISeREP, and no corrections to those affected data have been made since at Suspect, nor at WISeREP, which has left significant overhead for anyone seeking to utilize some of these publicly available data sets. This issue of misaligned spectra has even trickled to more recent works—for example, four misaligned spectra in Figure 1 of the preprint (v1) of Sasdelli et al. (2016).
In the Open Supernova Catalog we have taken the initiative to reset those affected data files once and for all, and with the help of telluric features, assuming they have not already been removed. A number of spectra were also found to have bad wavelength solutions (10s of spectra); we have removed these from the catalog and have added them to a list of events for which the data will need to be either reacquired or digitized from the original manuscripts.34
For literature data that have already been corrected for redshift (e.g., CSP spectra and UCB files with a noz label, for "no z remaining"), we have ensured that these data are not twice-corrected in the catalog. However, to avoid these potentially fatal impacts on supernova research, we ask that spectra donated to the Open Supernova Catalog (or our external sources such as WISeREP) are left uncorrected for redshift.
Additionally we aim to clean the spectral data and maintain accurate metadata. This work includes removing telluric features; rescaling spectra to published flux values, and/or photometry, as many spectra have been released without scaling to the photometry (Silverman et al. 2012b; Modjaz et al. 2014); providing internally consistent dates of maximum light so that spectra can be compared by an appropriate phase; and correcting records of maximum absolute magnitudes.
All corrections applied by the Open Supernova Catalog to spectra are in the form of added metadata tags. For example, an exclude tag can be added to an existing spectrum to exclude ranges of wavelengths with noisy data. As with the photometry, these corrections do not involve manipulation of the original data files, whenever possible.
Because one of the goals of the Open Supernova Catalog is to organize a complete sample of supernova spectra, we aim to remove duplicate data found through external resources such as WISeREP from our time-series collection of spectra. These are typically the same spectrum for two different modes of reduction (rapid versus final). As WISeREP and the Transient Name Server will still continue to be a great source of raw spectral data, we will continue to collect the spectra posted there into the catalog in perpetuity, applying the corrections provided in the form of attached metadata. Finally, we will look to obtain unavailable published optical spectra and light curves that are known to be missing from the external sources we draw from (see Table 1 for an incomplete list).
Table 1. An Incomplete List of Publicly Inaccessible Spectra
| Supernova Name | Reference |
|---|---|
| 1983Va | Clocchiatti et al. (1997) |
| 1987Aa | Wang et al. (1996) |
| 1991Da | Benetti et al. (2002) |
| 1991Ta | Meikle et al. (1996) |
| 1992ar | Clocchiatti et al. (2000) |
| 1994Da | Meikle et al. (1996) |
| 1995Da | Sadakane et al. (1996) |
| 1995N | Fransson et al. (2002) |
| 1995V | Fassia et al. (1998) |
| 1995ala | Anupama (1997) |
| 1996N | Sollerman et al. (1998) |
| 1996cba | Qiu et al. (1999) |
| 1997Xa | Munari et al. (1998) |
| 1997Ya | Anupama (1997) |
| 1997aba | Salamanca (2000) |
| 1997bpa | Anupama (1997) |
| 1997eg | Salamanca et al. (2002) |
| 1998bua | Hernandez et al. (2000) |
| Spyromilio et al. (2004) | |
| 1999Ea | Rigon et al. (2003) |
| 1999aw | Strolger et al. (2002) |
| 1999bya | Höflich et al. (2002) |
| 1999el | Di Carlo et al. (2002) |
| 1999ema | Elmhamdi et al. (2003) |
| 2000cxa | Rudy et al. (2002) |
| 2000ewa | Gerardy et al. (2002) |
| 2001ela | Mattila et al. (2005) |
| 2002fka | Cartier et al. (2014) |
| 2003hxa | Misra et al. (2008) |
| 2003ma | Rest et al. (2011) |
| 2004dja | Szalai et al. (2011) |
| 2004eta | Misra et al. (2007) |
| Kotak et al. (2009) | |
| 2005ama | Brown et al. (2005) |
| 2005dfa | Diamond et al. (2015) |
| 2005kea | Kankare et al. (2014) |
| 2005hka | Sahu et al. (2008) |
| McCully et al. (2014) | |
| 2006bc | Gallagher et al. (2012) |
| 2006gza | Maeda et al. (2009) |
| 2007axa | Kasliwal et al. (2008) |
| 2007gra | Hunter et al. (2009) |
| Mazzali et al. (2010) | |
| Chen et al. (2014) | |
| 2007od | Inserra et al. (2012a) |
| 2007pka | Pritchard et al. (2012) |
| 2007qda | McClelland et al. (2010) |
| 2007ifa | Yuan et al. (2010) |
| 2007it | Andrews et al. (2011) |
| 2007rua | Sahu et al. (2009) |
| 2007uya | Roy et al. (2013) |
| 2008Da | Soderberg et al. (2008) |
| 2008fz | Drake et al. (2010) |
| 2008gea | Foley et al. (2010) |
| 2008in | Roy et al. (2011) |
| 2009bw | Inserra et al. (2012b) |
| 2009dca | Yamanaka et al. (2009) |
| 2009hda | Elias-Rosa et al. (2011) |
| 2009iga | Foley et al. (2012) |
| Marion et al. (2013) | |
| 2009jfa | Sahu et al. (2011) |
| 2009kf | Botticella et al. (2010) |
| 2009kn | Kankare et al. (2012) |
| 2009kr | Fraser et al. (2010) |
| 2009ku | Narayan et al. (2011) |
| 2009nr | Khan et al. (2011) |
| 2010aq | Gezari et al. (2010) |
| 2010ev | Gutiérrez et al. 2016 |
| 2010jla | Fransson et al. (2014) |
| Ofek et al. (2014) | |
| 2010mb | Ben-Ami et al. (2014) |
| PS1-10pm | McCrum et al. (2015) |
| PS1-10afx | Chornock et al. (2013) |
| PS1-10bzj | Lunnan et al. (2013) |
| 2011aya | Szalai et al. (2015) |
| 2011dha | Sahu et al. (2013) |
| Marion et al. (2014) | |
| 2011fea | McClelland et al. (2013) |
| Shappee et al. (2013) | |
| 2011hta | Mauerhan et al. (2013) |
| 2011kl | Greiner et al. (2015) |
| PTF11iqba | Smith et al. (2015) |
| PS1-11ap | McCrum et al. (2014) |
| 2012apa | Liu et al. (2015a) |
| 2012au | Milisavljevic et al. (2013) |
| Takaki et al. (2013) | |
| 2012bza | Schulze et al. (2014) |
| 2012dna | Chakradhari et al. (2014) |
| 2013ab | Bose et al. (2015) |
| 2013cqa | Melandri et al. (2014) |
| 2013df | Morales-Garoffolo et al. (2014) |
| Ben-Ami et al. (2015) | |
| Maeda et al. (2015) | |
| 2013eja | Huang et al. (2015) |
| 2013en | Liu et al. (2015b) |
| 2013fu | Cano et al. (2014) |
| PS1-13arp | Gezari et al. (2015) |
| iPTF13asv | Cao et al. (2016) |
| 2014Ja | Kawabata et al. (2014) |
| Goobar et al. (2014) | |
| Vacca et al. (2015) | |
| Telesco et al. (2015) | |
| Marion et al. (2015) | |
| Jack et al. (2015) | |
| 2015H | Magee et al. (2016) |
Note.
aSome data for this object is publicly available.Download table as: ASCIITypeset image
5.2. Missing Data
Estimating the amount of missing data is difficult to do with the available metadata, and we can only use the data we have collected to place upper limits on the data we are missing. The numbers reported in the following discussion all correspond to the Open Supernova Catalogon 2016 November 735 , and are displayed graphically as pie charts in Figure 6.

Figure 6. Pie charts showing the fractions of types of events and the fractions with spectral and photometric data within the Open Supernova Catalog. Of those events that are not classified as candidates, 31% have at least one supernova typing, but only 12%, one-third of the typed supernovae, have at least one publicly available spectrum. An up-to-date census is available on the statistics page (https://sne.space/statistics/).
Download figure:
Standard image High-resolution image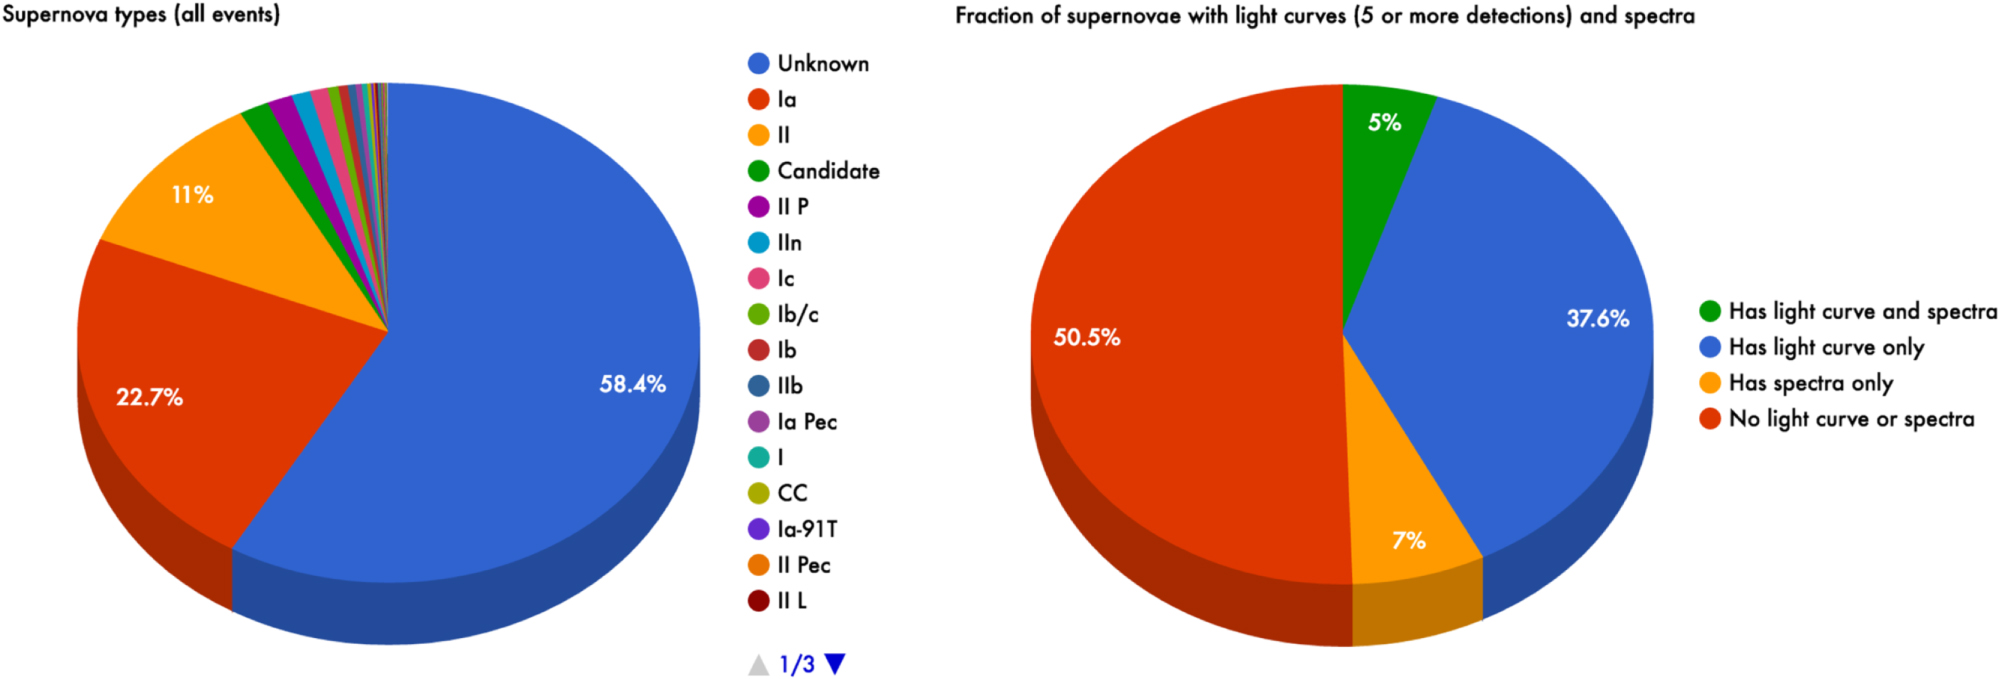
5.2.1. Estimate of Amount of Missing Spectra
At present the catalog documents 11,362 supernovae with assigned supernova types but no collected spectra, yet these supernovae almost certainly have a classification spectrum that is not available in the public domain. We have performed a cursory search of the literature to attempt to locate the publications where some of these spectra might be available (a listing of which is provided in Table 1), a list that only identifies a small fraction of sources for the missing spectra. It is clear that the community must come together to fill this gap to adhere to basic standards of scientific reproducability and disclosure.
5.2.2. Estimate of Amount of Missing Light Curve Data
Clues to how much available light curve data remain unaccounted for are more elusive than for spectra. There are currently 8074 supernovae, with at least three but no more than ten photometric detections recorded in the catalog. We speculate that these events likely have more complete light curves that either have yet to be published or are available in published literature that we are not aware of. Additionally, there are 577 supernovae with at least one collected spectrum but no photometric observations. These too are likely to have a light curve that we have not yet collected. Finally, as mentioned previously, there are more than 10,000 supernovae that have been classified but have no publicly available spectrum; a large fraction of these supernovae are also likely to have light curves, as decisions of which supernovae to follow up are often predicated on their early photometric evolution.
5.3. Astroquery, Validation, and VOTable Support
At present, all of the data collected by the Open Supernova Catalog can be accessed either on an event-by-event basis, in summarized form via the main catalog page, or in bulk via downloads from github. While we do provide a few examples, scripts that process these bulk data in the main Open Supernova Catalog repository, a standardized interface to the Open Supernova Catalog available in a widely used software package, would further enhance accessibility and ease of data processing. Astroquery (Ginsburg et al. 2016), an affiliated package of the Astropy package, which we use extensively (Astropy Collaboration et al. 2013), provides an easy-to-use, standard interface to online astronomical resources. As a community-driven open-source tool, it is straightforward to construct new "services" for Astroquery. As an example, the Open Exoplanet Catalog (Rein 2012) has added a service to Astroquery that enables the importation of exoplanet data. By adding such an interface to the Open Supernova Catalog, we will enable users to easily incorporate the acquisition of supernova data into their code.
Currently, the Open Supernova Catalog's schema is only available in human-readable form, but widespread adoption of the format we have present will eventually require a robust machine-readable version of the schema that is parsable by standard schema validating tools. We can also improve access to the Open Supernova Catalog by providing additional file formats aside from the JSON format we have chosen, including the VOTable format, which is XML-based, or any other format, should the need arise. The most important facet of our approach is that we have homogenized the supernova data set to use one format; should JSON fall out of fashion in the future, it will be trivial to export the data set to another format.
5.4. Summary Plots and Event Comparisons
Once the data have been cleaned and standardized (Section 7.1), the catalog can begin to take on comparative analysis, whereby event data can be directly compared, or sequenced, within the remaining catalog. Since a majority of published works on supernovae spectra have stemmed from visual senses (see Parrent et al. 2016a, 2016b and Black et al. 2016 for reviews), a secondary objective for the catalog is to expand our use of modern data-driven libraries (e.g., Bokeh and d3.js) for additional data visualization and manipulation.
Useful tools that could be incorporated into the Open Supernova Catalog's interface are those that can be used to compare data between events (e.g., a time sequence of spectra or a collection of light curves from all events of a given type). Such tools could be used to help correct the data presented on the catalog, as is possible with the duplicate and conflict finders described in Section 5.1.1. While we do not intend the entirety of the scientific process to occur on the catalog itself, we hope to add simple tools that will enable simple analyses, such as comparing events to one another, in the near future.
5.5. Improving and Adding Derived Quantities
At some point the catalog can embark on improving certain derived quantities (e.g., Milky Way Galaxy and host extinctions, dates of maximum brightness, and dates of explosion). Other derived quantities that may be added in the future include line velocities of common elements, refined subtype classifications (see Benetti et al. 2005; Branch et al. 2006; Wang et al. 2009), estimations of photometric rise times and decline rates (e.g., Δm15), and parameters associated with parametric fits to supernova data such as SALT 2.4 (Guy et al. 2007) and MLCS2k2 (Jha et al. 2007).
As with any heterogeneous collection of data, the users of the Open Supernova Catalog must exercise caution before combining data sets without considering the systematic effects that might be present in the data that they consider. This is especially true for supernova data that is used for cosmological purposes, for which careful photometric calibration (which depends on bandpass definitions and the magnitude systems employed) and a detailed understanding of the covariance of the data are required to obtain a precise result. The Open Supernova Catalog, however, provides an opportunity to encapsulate these stricter data requirements within a common format. The inclusion of additional data structures, such as covariance matrices and photometric standards, within future versions of the schema could permit cosmological data sets to be more directly compared to one another.
6. Summary
Utilizing the scattering of available observations to both vet and constrain a given explosion model (with its own blended spectrum) is not currently possible with today's large spectrum-limited survey data. There is thus a serious need for quantitative consensus in how supernovae are classified and analyzed in real time.
The accumulation of additional well-observed supernova prototypes through coordinated transient surveys (e.g., the Zwicky Transient Factory) will eventually be fueled by the Large Synoptic Survey Telescope by 2023. Taking full advantage of this surplus data stream will require extended visibility of data assets and metadata, complete and efficient data accumulation, and full transparency from published spectra and photometry sourced from proprietary analysis tools as well.
The Open Supernova Catalog represents a concerted effort to bring all public data of a specific kind of astrophysical transient to a single location where it can be rapidly searched, compared, and vetted. Once the data is all in a single place, analysis is significantly simplified for the user, thus reducing the cumulative time expenditure of the astrophysical community, which has repeated the collection process many times. Other astrophysical data sets could also benefit from the system we have presented here, including other transient phenomena such as novae, cataclysmic variables, gamma-ray bursts, and tidal disruption events.36
We thank Brad Cenko, Maria Drout, Or Graur, Atish Kamble, Bob Kirschner, Dan Milisavljevic, Gautham Narayan, Matt Nicholl, Ashley Pagnotta, Ed Shaya, Isaac Shivvers, Jeff Silverman, Alicia Soderberg, and Łukasz Wyrzykowski for constructive suggestions and comments. The authors are especially grateful to Ryan Foley for providing user interface feedback; to Dmitry Tsvetkov and Pavlyuk Nikolay, who donated hundreds of historical light curves; to Pete Challis, Koji Kawabata, Hagai Perets, and Federica Bianco for providing a significant number of spectra; to Matt Nicholl and Lluís Galbany for donating their personal supernova light curve collections; to Carles Badenes, Dave Green, and Pierre Maggi for their SNR contributions; to Dan Milisavljevic for testing the duplicate finder (from data to appear in D. Milisavljevic et al. 2016, in preparation); to Federica Bianco, Matt Nicholl, Maria Pruzhinskaya, and Victor Lebedev (who also pointed us to many missing supernovae), and Ofer Yaron for finding several errors in the catalog; and to David Bishop for his close cooperation and tireless effort to maintain the Latest Supernovae webpage.37 The authors would also like to thank the anonymous referee for their constructive comments.
This work was supported in part by Einstein grant PF3-140108 (JG). The Open Supernova Catalog made use of NASA's Astrophysics Data System; the VizieR catalog access tool, CDS, Strasbourg, France; Astropy, a community-developed core Python package for Astronomy (Astropy Collaboration et al. 2013); Astroquery (Ginsburg et al. 2016), Beautiful Soup38 ; DataTables39 ; the Wordpress blogging platform40 ; the Bokeh interactive visualization library41 ; and DownloadThemAll, a Firefox add-on.42
Footnotes
- 4
- 5
- 6
- 7
- 8
- 9
- 10
- 11
- 12
- 13
- 14
- 15
- 16
- 17
- 18
- 19
- 20
- 21
- 22
- 23
- 24
- 25
- 26
- 27
- 28
- 29
- 30
- 31
- 32
- 33
- 34
- 35
git commit SHA for main repository: b211cb7.
- 36
- 37
- 38
- 39
- 40
- 41
- 42