


Abstract
The processing of the hydrocarbon ice, ethylene (C2H4/C2D4), via energetic electrons, thus simulating the processes in the track of galactic cosmic-ray particles, was carried out in an ultrahigh vacuum apparatus. The chemical evolution of the ices was monitored online and in situ utilizing Fourier transform infrared spectroscopy (FTIR) and during temperature programmed desorption, via a quadrupole mass spectrometer utilizing electron impact ionization (EI-QMS) and a reflectron time-of-flight mass spectrometer utilizing a photoionization source (PI-ReTOF-MS). Several previous in situ studies of ethylene ice irradiation using FTIR were substantiated with the detection of six products: [CH4 (CD4)], acetylene [C2H2 (C2D2)], the ethyl radical [C2H5 (C2D5)], ethane [C2H6 (C2D6)], 1-butene [C4H8 (C4D8)], and n-butane [C4H10 (C4D10)]. Contrary to previous gas phase studies, the PI-ReTOF-MS detected several groups of hydrocarbon with varying degrees of saturation: CnH2n+2 (n = 4–10), CnH2n (n = 2–12, 14, 16), CnH2n−2 (n = 3–12, 14, 16), CnH2n−4 (n = 4–12, 14, 16), CnH2n−6 (n = 4–10, 12), CnH2n−8 (n = 6–10), and CnH2n−10 (n = 6–10). Multiple laboratory studies have shown the facile production of ethylene from methane, which is a known ice constituent in the interstellar medium. Various astrophysically interesting molecules can be associated with the groups detected here, such as allene/methylacetylene (C3H4) or 1, 3-butadiene (C4H6) and its isomers, which have been shown to lead to polycyclic aromatic hydrocarbons. Finally, several hydrocarbon groups detected here are unique to ethylene ice versus ethane ice and may provide understanding of how complex hydrocarbons form in astrophysical environments.
Export citation and abstract BibTeX RIS
1. Introduction
The radiation exposure of small hydrocarbons like methane (CH4), ethane (C2H6), and acetylene (C2H2) has received considerable attention during the past decade. However, the closely related C2 hydrocarbon, ethylene (C2H4), has been rather disregarded, as only a few experiments investigating its role in extraterrestrial ices and their mixtures have been conducted. Ethylene was detected in the interstellar environments CRL 618 (Cernicharo et al. 2001a) and IRC +10216 (Betz 1981; Hinkle et al. 2008) and in the outer solar system, in places like Pluto (Merlin 2015; Gladstone et al. 2016), Titan (Hanel et al. 1981; Niemann et al. 2005; Shemansky et al. 2005), Neptune (Schulz et al. 1999), Saturn (Encrenaz et al. 1975), and—in its condensed form as an ice—on Makemake (Brown et al. 2015). Also, laboratory experiments simulating the processing of methane ice in interstellar clouds (Boogert et al. 2015) via energetic particles produces ethylene from methane ice (Gerakines et al. 1996; Kaiser & Roessler 1998; Bennett et al. 2006; Jones & Kaiser 2013; Paardekooper et al. 2014).
Ausloos & Gorden (1962) reported the first processing of pure solid ethylene (77 K) to study the formation of molecular hydrogen from γ-radiation; no other products were determined. Wagner (1962) showed that the processing of solid ethylene (77 K) with 3 MeV bremsstrahlung produced hydrogen, methane, acetylene, and ethane, as well as larger hydrocarbons in additional units of C2 from C2–C18. The C2 compounds were analyzed via mass spectrometry, while the C4–C18 molecules were determined via gas chromatography. Specific molecules, larger than C2, included butadiene (C4H6), 2-butene (C4H8), 1-butene (C4H8), n-butane (C4H10), 3-hexene (C6H12), cis-2-hexene (C6H12), trans-2-hexene (C6H12), 1-hexene (C6H12), 2-ethyl-1-butene (C6H12), 3-methyl-2-pentene (C6H12), 3-methyl-1-pentene (C6H12), 3-methylpentane (C6H14), n-hexane (C6H14), 3,4-dimethylhexane (C8H18), 3-methyl-3ethylpentane (C8H18), 3-ethylhexane (C8H18), 3-methylheptane (C8H18), n-octane (C8H18), and decene (C10H20). The C10 and C12 compounds were determined to be branched; the major product shown was 1-butene (C4H8) (Wagner 1962). Tschuikow-Roux et al. (1967) studied solid ethylene (36 K) processed by ultraviolet photolysis (8.4 eV) and collected products that were condensable with liquid nitrogen and analyzed off-line via gas chromatography. The products identified from the ultraviolet photolysis of pure ethylene ice were acetylene (C2H2), ethane (C2H6), allene (C3H4), cyclopropene (c-C3H4), propene (C3H6), cyclopropane (c-C3H6), propane (C3H8), methylcyclopropene (c-C4H6), 1-butene (C4H8), isobutene (C4H8), trans-2-butene (C4H8), cis-2-butene (C4H8), methyl cyclopropane (c-C4H8), n-butane (C4H10), and isobutane (C4H10); the primary product was determined to be 1-butene (Tschuikow-Roux et al. 1967). Gorden & Ausloos (1971) added to the literature the ultraviolet photolysis (8.4 eV, 10.0 eV, 11.6–11.8 eV, 21.2 eV) and γ-radiolysis of pure ethylene ice at 20 and 77 K, respectively, in order to determine the mechanism that ethylene undergoes to form larger hydrocarbons. The products analyzed with gas chromatography–mass spectrometry (GC-MS) were determined to be molecular hydrogen (H2), acetylene (C2H2), propene (C3H6), cyclopropane (c-C3H6), 1-butene (C4H8), 2-butene (C4H8), cyclobutene (c-C4H6), n-butane (C4H10), cyclobutane (c-C4H8), and at least eight hexene (C6H12) isomers; no attempt was made to analyze molecules larger than C6 products.
Kaiser & Roessler (1998) provided the first astrochemistry-based study of irradiated pure ethylene ice at 10 K with 9 MeV α-particles to investigate the interaction of cosmic-ray particles with this hydrocarbon ice as a simple model of interstellar ices. Fourier transform infrared (FTIR) spectroscopy showed vibrational modes attributed to ethane (C2H6), acetylene (C2H2), and ethyl radicals (C2H5), as well as acetylinic (H-CC-R), olefinic (=CH2), and aliphatic (R-CH2-R') structures. Meanwhile, temperature programmed desorption (TPD) studies using a quadrupole mass spectrometer (QMS) detected acetylene (C2H2), ethane (C2H6), allene (C3H4), methylacetylene (C3H4), propene (C3H6), cyclopropane (C3H6), propane (C3H8), n-butane (C4H10), isobutane (C4H10), dimethylpropane (C5H12), n-pentane (C5H12), and isopentane (C5H12), as well as larger alkanes (CnH2n+2; n = 6–14). Bennett & Mile (1973) studied the reaction of solid ethylene with hydrogen atoms using electron spin resonance and found that the addition of hydrogen atoms to the ethylene molecule occurred readily to form ethyl radicals (C2H5) and—via reaction with a neighboring ethylene molecule—n-butyl radicals (C4H9). To better understand the nondetection of ethylene in comets, the reaction of hydrogen atoms with solid ethylene was investigated again later using FTIR and QMS analytical techniques, and it was found that ethane was the primary product while butane was produced at about 5% of ethane (Hiraoka et al. 2000, 1999). These experiments suggest that ethylene present in interstellar ices at 10 K would be easily converted to ethane; these findings are supported by the detection of acetylene and ethane and nondetection of ethylene in comets, which are the least altered records from planetary formation. Also, Strazzulla et al. (2002) studied the ion irradiation of pure ethylene ice while monitoring the changes in situ with FTIR. After irradiation with 30 keV He+ ions, the most abundant products were methane, ethane, and acetylene, and a "polymer-like" refractory residue was formed. Irradiation with 15 keV N+ ions resulted in the production of HCN and mononitriles (R-CN). Compagnini et al. (2009) studied the irradiation of solid ethylene with 200 keV H+ ions and detected, via Raman spectroscopy, acetylene and features assigned to polyynes. Ennis et al. (2011) processed solid ethylene with 5 keV oxygen ions to investigate solar system hydrocarbon ices exposed to solar wind and planetary magnetosphere type ions. Products detected online and in situ via FTIR spectroscopy and QMS were acetylene and vibrational modes attributed to larger aliphatic hydrocarbon species. Recently Zhou et al. (2014) used energetic keV electrons to process solid ethylene to explore hydrocarbon chemistry pathways on Titan and on methane-bearing interstellar grains. Using FTIR and QMS, products were determined to be methane, acetylene, ethane, the ethyl radical, 1-butene, and n-butane.
These previous studies utilized a broad assortment of techniques to analyze the samples ranging from online and in situ FTIR and QMS using electron impact ionization to off-line and ex-situ gas chromatography–mass spectrometry. FTIR has been a very common tool in assessing the consequences of irradiating astrophysical ice analogs (Khare et al. 1989; Moore et al. 1996; Caro & Schutte 2003; Abplanalp et al. 2016), but this technique has several limitations. First, the detection of only individual molecules via FTIR is possible if they are small, such as carbon monoxide (CO), water (H2O), carbon dioxide (CO2), methane (CH4), and ammonia (NH3), all of which have been detected as constituents in interstellar ices. Second, FTIR fails at giving unique identification to larger complex organic molecules (COMs) and can instead only provide information of what functional groups are present in the sample that was analyzed (Socrates 2004). Third, this often leads to overlapping of infrared vibrations from multiple different molecules (Bennett et al. 2005b; Zhou et al. 2008) and incomplete assignments of products. Therefore, product assignments of infrared bands should be supported by complimentary analytical techniques.
Gas phase analysis, via mass spectrometry, during TPD can provide the supporting data to product assignments that are complimentary to FTIR. Typically gas phase products are analyzed, upon sublimation, using an electron impact quadrupole mass spectrometer (EI-QMS; Kaiser et al. 1995a, 1995b; Fraser et al. 2002; Ioppolo et al. 2011; Jiménez-Escobar & Caro 2011; Duvernay et al. 2014). This technique is often operated at an ionization energy where organic molecules have a maximum cross section (70–100 eV), to easily ionize most molecules. However, the trade-off to this approach is that this type of ionization often causes complex fragmentation patterns and, possibly, the nondetection of the molecular ions of molecules. Additionally, these fragment ions overlap from multiple parent ions, especially between structural isomers, making the assignment of a specific isomer extremely challenging (Kaiser et al. 1997a, 2010; Kaiser & Roessler 1997; Bennett et al. 2005a; Bennett & Kaiser 2007).
The third type of analytical technique employed by several of the previous studies was off-line GC-MS, which has been used to analyze nonvolatile residues produced from analog ices (Meinert et al. 2012; Callahan et al. 2013; Abou Mrad et al. 2014; de Marcellus et al. 2015). The product molecules, especially residues, need some type of further processing like acid hydrolyses and trimethylsilyl (–Si(CH3)3) derivatization in order to perform this analysis, and it is possible that these techniques cause modification and/or degradation of the initial residue formed (Fang et al. 2015).
Although multiple attempts have been made to investigate the hydrocarbon chemistry of processed solid ethylene ice, these studies have not utilized sensitive analytical techniques online and in situ, and these traditional methods that were employed are not able to identify specific new products. To solve this problem, we have incorporated the method of tunable photoionization coupled with reflectron time-of-flight mass spectrometry (PI-ReTOF-MS). The capabilities of soft photoionization via vacuum ultraviolet (VUV) light, with the application to analyzing the subliming products of astrophysically relevant ice analogs, have previously been reported (Jones & Kaiser 2013; Kaiser et al. 2014, 2015; Maity et al. 2014a, 2014b, 2015; Förstel et al. 2015; Maksyutenko et al. 2015; Turner et al. 2015, 2016; Abplanalp et al. 2016) and show that this is an extremely useful tool. This soft photoionization method results in minimal, if any, fragmentation of the molecular ion close to the ionization energy and thus avoids the drawback that occurs when using EI-QMS. Furthermore, this superior alternative method allows for the discrimination of structural isomers based on their individual ionization energy. For example, if EI-QMS was used to analyze a simple system such as a mixed carbon monoxide (CO)—methane ice (CH4) for acetaldehyde (CH3CHO; m/z = 44), there would be overlapping signals at this mass-to-charge ratio from propane (C3H8), carbon dioxide (CO2; m/z = 44), ethylene oxide (c-C2H4O; m/z = 44), and vinyl alcohol (H2CCHOH; m/z = 44), all of which are expected products from this ice mixture (Kaiser et al. 2014). However, using PI-ReTOF-MS bypasses this problem by tuning the photon energy to selectively photoionize only one of these molecules/isomers and uniquely identify the isomers formed and relative yields (Abplanalp et al. 2015, 2016; Forstel et al. 2016). By employing PI-ReTOF-MS and FTIR concurrently, the monitoring of gas and ice phase products, respectively, can further constrain FTIR assignments, as a decrease in an infrared peak during the appearance of an ion in the PI-ReTOF-MS data shows their relationship.
In this study we present the detection of complex hydrocarbon molecules from C3–C16 via PI-ReTOF-MS produced from the interaction of ionizing radiation, in the form of energetic electrons, with pure ethylene and D4-ethylene ices. The previous investigations (FTIR, QMS, GC-MS) detected several products that would differ from one investigation to the next using analytical methods that are not very useful in untangling the complex chemistry taking place in the ethylene ice. Therefore, PI-ReTOF-MS data complimenting FTIR allow the extraction of the chemical pathways that are present in ethylene ice and allow for a better understanding of ethylene pathways in more complex ices. The detection of ethylene ice as a constituent on Makemake (Brown et al. 2015) and the product of methane ice irradiation (Gerakines et al. 1996; Kaiser & Roessler 1998; Bennett et al. 2006; Jones & Kaiser 2013; Paardekooper et al. 2014) show that a better understanding of the ethylene chemistry available in astrophysical ice analogs is desired.
2. Experimental Details
The experimental setup consisted of an ultrahigh vacuum (UHV) chamber evacuated to about 3 × 10⁻¹¹ torr via magnetically suspended turbo molecular pumps backed by dry oil-free scroll pumps. Within the UHV chamber the substrate, a polished silver mirror, is interfaced via indium foil to promote thermal conductivity to an oxygen-free high-conductivity copper target that is cooled to 5.5 ± 0.1 K using a UHV compatible closed-cycle helium compressor (Sumitomo Heavy Industries, RDK-415E). The target is translatable in the vertical axis using a UHV compatible bellows (McAllister, BLT106) and rotatable in the horizontal plane via a differentially pumped rotary feedthrough (Thermoionics Vacuum Products, RNN-600/FA/MCO).
Pure ethylene gas (C2H4, Linde, 99.999%) was deposited onto the cooled silver substrate via a glass capillary array positioned 30 mm from the target at main chamber background pressures of about 5 × 10⁻⁸ torr held for up to 7 minutes until the desired ice thickness is achieved. The thickness of the ice was monitored online and in situ via laser interferometry during the gas deposition from an HeNe laser (λ = 632.8 nm; CVI Melles-Griot; 25-LHP-230) reflecting off of the silver substrate into a photodiode (Groner et al. 1973; Maity et al. 2014a; Turner et al. 2015). By using a refractive index (n) of n = 1.35 (Hudson et al. 2014a), the thickness of the ethylene ice was determined to be 470 ± 25 nm. Alternatively, by using a modified Lambert–Beer relationship with ethylene absorption coefficients of 1.03 × 10⁻¹⁸, 1.51 × 10⁻¹⁸, 1.04 × 10⁻¹⁹, 2.77 × 10⁻¹⁹, and 1.03 × 10⁻¹⁹ cm molecule−1 (Hudson et al. 2014a) for the integrated areas of the infrared peaks at 2974 (ν11), 3085 (ν9), 4188 (ν6 + ν11), 4495 (ν5 + ν12), and 4703 (ν2 + ν9) (Table 1), we calculated an average thickness of 540 ± 150 nm, which is very similar to the laser interferometry method used. This procedure was repeated with isotopic ices of D4-ethylene (C2D4, CDN Isotopes, 99.8% D) and then irradiated to confirm FTIR assignments and subliming molecules assignments via their isotopic shifts induced by the added deuterium.
Table 1. Infrared Absorption Features Recorded before and after the Irradiation of Ethylene Ices (C2H4) and D4-Ethylene Ices (C2D4) at 5.5 K
| Absorptions before Irradiation (cm−1) | Absorptions after Irradiation (cm−1) | Assignment | Carrier | References |
|---|---|---|---|---|
| Ethylene Ices (C2H4) | ||||
| 4741, 4703, 4678, 4574, 4495, 4435, 4415, 4393, 4301, 4271, 4188 | ν9 + 2ν10, ν9 + ν2, 2ν2 + ν12, ν11 + ν2, ν5 + ν12, ν1 + ν12, ν9 + ν3, ν2 + ν3 + ν12, ν11 + ν3, ν6 + 2ν10 + ν12, ν11 + ν6 (C2H4) | Overtones/Combinations | 1 | |
| 3325 | ν1 (C2H2) | CH stretch | 2 | |
| 3288 | ν3 (C2H2) | CH stretch | 3 | |
| 3235 | ν3 (C2H2) | CH stretch | 2, 4, 5 | |
| 3085 | ν9 (C2H4) | CH2 asymmetric stretch | 3, 6, 7, 8, 9, 1, 10, 11 | |
| 3066 | ν2 + ν12 (C2H4) | Combination | 1, 8, 9 | |
| 3048 | ν2 + ν12 (13C2H4) | Combination | 8 | |
| 3020 | ν3 (CH4)/ν2(C4H8) | Degenerate stretch/CH2 symmetric stretch | 12, 13, 14 | |
| 3002 | ν3 (CH4) | Degenerate stretch | 12 | |
| 2974 | ν11(C2H4) | CH2 symmetric stretch | 1, 3, 6, 8, 9, 10, 11 | |
| 2966 | ν11 (13C2H4) | CH2 symmetric stretch | 8, 9 | |
| 2964 | ν20 (C4H8)/ν10 (C2H6)/ν20 (C4H10) | CH3 Asymmetric stretch/CH3 degenerate stretch | 3, 13, 14, 15 | |
| 2936 | ν8 + ν11 (C2H6)/ν22 (C4H10) | Combination/CH2 asymmetric stretch | 3, 5, 7, 12 | |
| 2917 | ν8 + ν11 (C2H6)/ν5 (C4H8) | Combination/CH3 symmetric stretch | 4, 5, 10, 13, 14 | |
| 2879 | ν5 (C2H6)/ν23 (C4H10) | CH3 symmetric stretch | 3, 4, 5, 7, 15 | |
| 2860 | ν24 (C4H10) | CH2 symmetric stretch | 3, 4, 10 | |
| 2830 | ν6 + ν11 (C2H6) | Combination | 5 | |
| 2740 | ν2 + ν6 (C2H6) | Combination | 4, 5 | |
| 2654 | ν6 + ν12 (C2H4) | Combination | 6 | |
| 2166 | ν3 + ν10 (C2H4) | Combination | 11 | |
| 2040 | ν6 + ν10 (C2H4) | Combination | 11 | |
| 1968 | ν4 + ν8 (C2H4) | Combination | 5 | |
| 1899 | ν7 + ν8(C2H4) | Combination | 5 | |
| 1458 | ν11 (C2H6) | CH3 degenerate deformation | 16 | |
| 1434 | ν12 (C2H4) | CH2 scissor | 1, 3, 8, 9, 10, 11 | |
| 1374 | ν6 (C2H6)/ν11 (C4H8)/ν29 (C4H10) | CH3 symmetric deformation/CH2 wag | 3, 5, 7, 13, 14, 15 | |
| 1222 | ν6 (C2H4) | CH2 rock | 1, 3, 8 | |
| 960 | ν7 (C2H4) | CH2 wag | 3, 8, 11 | |
| 943 | ν7 (C2H4) | CH2 wag | 1, 6, 9, 10 | |
| 915 | ν26 (C4H8) | CH2 out of plane bend | 13, 14 | |
| 820 | ν10 (C2H4) | CH2 rock | 1, 3, 6, 8, 9, 10, 11 | |
| 763 | ν5 (C2H2) | CCH bend | 2 | |
| 755 | ν5 (C2H2) | CCH bend | 2, 3 | |
| 746 | ν5 (C2H2)/ν34 (C4H10) | CH bend/CH2 rock | 2, 3, 10, 17 | |
| D4-Ethylene Ices (C2D4) | ||||
| 4601, 4458, 4452, 4402, 4386, 4337, 3369, 3354, 3323, 3310, 3300, 3184, 3033 | ν9 + ν1, ν1 + ν11, 2ν12 + ν5, 2ν11, 2ν12 + ν2 + ν7, 2ν6 + ν5, ν5+ ν12, ν6 + ν9, ν9 + ν3, ν6 + ν5, ν3 + ν5, ν3 + ν11, ν4 + ν5 (C2D4) | Overtones/combinations | 3 | |
| 2585 | ν1 (C2D2) | CD stretch | 2 | |
| 2401 | ν3 (C2D2) | CD stretch | 3, 5 | |
| 2335 | ν9 (C2D4) | CD2 asymmetric stretch | 3 | |
| 2328 | ν9 (C2D4) | CD2 asymmetric stretch | 6, 9 | |
| 2304 | ν5 (C2D4) | CD2 asymmetric stretch | 3 | |
| 2248 | ν10 (C2D5)/ν22 (C4D8) | CD2 asymmetric stretch/CD asymmetric stretch | 18, 19 | |
| 2246 | ν1 (C2D4) | CD2 symmetric stretch | 3 | |
| 2228 | ν10 (C2D6)/ν20 (C4D8) | CD3 degenerate stretch/CD3 asymmetric stretch | 3, 5, 14, 20 | |
| 2218 | ν2 + ν8 (C2D6) | Combination | 20 | |
| 2188 | ν11 (C2D4) | CD2 symmetric stretch | 3, 6, 9 | |
| 2130 | ν5 (C4D8) | CH3 symmetric stretch | 14 | |
| 2110 | ν2 (C3D4)/ν3 C4D6 | CD3 symmetric stretch | 3, 21, 22 | |
| 2093 | ν5 (C4D8) | CD3 symmetric stretch | 14 | |
| 2077 | ν5 (C2D6) | CD3 symmetric stretch | 3 | |
| 2069 | ν6 + ν9 (C2D6) | Combination | 15 | |
| 1073 | ν12 (C2D4) | CD2 scissor | 3, 6, 9 | |
| 1057 | ν6(C2D6)/ν22 (C4D8)/ν28 (C4D10) | CD3 symmetric deformation/CD3 asymmetric deformation/CD3 symmetric stretch | 3, 14, 17 | |
| 735 | ν7 (C2D4) | CD2 wag | 6, 9 | |
| 718 | ν7 (C2D4) | CD2 wag | 3, 5, 7, 9 | |
References. (1) Brock et al. 1994; (2) Hudson et al. 2014b; (3) Shimanouchi 1972; (4) Ennis et al. 2011; (5) Kaiser & Roessler 1998; (6) Jacox 1962; (7) Kim et al. 2010; (8) Rytter & Gruen 1979; (9) Dows 1962; (10) Comeford & Gould 1961; (11) Brecher & Halford 1961; (12) Bennett et al. 2006; (13) Es-sebbar et al. 2013; (14) Bell et al. 2000; (15) Kondo & Saëki 1973; (16) Kaiser et al. 2014; (17) Murphy et al. 1991; (18) Pacansky & Dupuis 1982; (19) Levin et al. 1973; (20) Tejada & Eggers 1976; (21) Ball et al. 1994; (22) Saussey et al. 1976.
An area of 1.0 ± 0.1 cm2 of the ethylene ice was then irradiated with 5 keV electrons for 1 hr with a current of 30 nA. The irradiation was done at an angle of incidence of 70° relative to the surface normal. Next, utilizing CASINO 2.42 software (Drouin et al. 2007), the average penetration depth of the energetic electrons into the ice was determined to be 320 ± 20 nm, with an average dose deposited of 5.0 ± 0.8 eV molecule−1 in the ethylene ice utilizing a density of 0.75 g cm−3 (Hudson et al. 2014a; van Nes 1978) (Table 2). It should be noted that this calculated penetration depth (320 ± 20 nm) is much lower than the measured total thickness of the ethylene ice (470 ± 25 nm), so that no processing of the substrate occurs. The chemical evolution of the ethylene ice was monitored online and in situ via FTIR (Nicolet 6700) using a reflection angle of 45° for absorption-reflection-absorption mode. The FTIR data were recorded from 6000 to 500 cm−1 at a resolution of 4 cm−1 continuously throughout the experiment from before irradiation through TPD to 300 K to monitor the products formed within the sample. Once the irradiation phase of the experiment was completed, the ice was held at 5.5 K for an additional hour before starting TPD studies of heating the substrate from 5.5 to 300 K at a rate of 0.5 K min−1.
Table 2. Data Applied to Calculate the Irradiation Dose per Molecule in the C2H4 and C2D4 Ice
| Initial kinetic energy of the electrons, Einit | 5 keV |
| Irradiation current, I | 30 ± 2 nA |
| Total number of electrons | (6.7 ± 0.5) × 1014 |
| Average kinetic energy of backscattered electrons, Ebsa | 3.1 ± 0.3 keV |
| Fraction of backscattered electrons, fbsa | 0.30 ± 0.03 |
| Average kinetic energy of transmitted electrons, Etransa | 1.8 ± 0.3 keV |
| Fraction of transmitted electrons, ftransa | 0.14 ± 0.01 |
| Average penetration depth, la | 320 ± 20 nm |
| Density of the ice, ρ | 0.75 ± 0.05 g cm−3 |
| Irradiated area, A | 1.0 ± 0.1 cm2 |
| Total # molecules processed | (5.1 ± 1.4) × 1017 |
Dose per 28 amu, 
|
5.0 ± 0.8 eV |
Dose per 36 amu, 
|
5.7 ± 0.9 eV |
Note.
aCASINO output values.Download table as: ASCIITypeset image
Throughout the TPD process the ice was monitored via FTIR, while the subliming molecules were detected using a QMS (Extrel, Model 5221) operating in residual gas analyzer (RGA) mode and the PI-ReTOF-MS procedure. The RGA operates with an electron impact ionization source (100 eV), an emission current of 1 mA, and a mass range from 1 to 300 amu. A complete description of the PI-ReTOF-MS procedure employed has previously been discussed (Jones & Kaiser 2013; Abplanalp et al. 2015), and only a brief summary of the procedure will be discussed here. First, the generated pulsed coherent VUV light with an energy of 10.49 eV (λ = 118.2 nm) and flux of 1010 photons pulse−1 (Förstel et al. 2016) was used to ionize subliming molecules from the substrate during TPD. These ions are then detected via a modified reflectron time-of-flight mass spectrometer (ReTOF; Jordan TOF products, Inc.) using a dual chevron configured multichannel plate (MCP). Next, a fast pre-amplifier (Ortec 9305) was used to amplify the MCP signals, which are then shaped by a 100 MHz discriminator. Finally, the spectra are recorded using a personal-computer-based multichannel scaler (FAST ComTec, P7888-1 E) with 4 ns bin widths triggered at 30 Hz using a pulse delay generator (Quantum Composers, 9518) and 3600 sweeps per mass spectrum per 1 K increase in temperature during TPD.
3. Results
3.1. Infrared Spectroscopy
Several discrete irradiation products were detected in situ via FTIR along with the broadening of ethylene stretches, the latter of which is possibly due to overlapping of vibrational modes of products with those of the reactant (Abplanalp & Kaiser 2016). Product assignments consisting of methane [CH4 (CD4)], acetylene [C2H2 (C2D2)], the ethyl radical [C2H5 (C2D5)], ethane [C2H6 (C2D6)], 1-butene [C4H8 (C4D8)], and n-butane [C4H10 (C4D10)] were assigned in both the ethylene and D4-ethylene ices, respectively (Table 1, Figure 1). There was a single radical identified, the ethyl radical, which was observed in the D4-ethylene ice experiments and was most likely a contributor to the broadening of the large ethylene fundamental stretch (ν9). The FTIR spectrum from 6000 to 3350 cm−1 and from 2800 to 500 cm−1 showed a small number of newly emerged absorptions that were easily assigned to the previously mentioned products (Figure 2). Figure 3 shows that this was not the case in the range of 3350–2800 cm−1, though, and that multiple new infrared stretches and several overlapping reactant positions developed from the processing of the ethylene ice with the impinging electrons. Therefore, the infrared spectrum was deconvoluted (Abplanalp et al. 2015) to identify possible constituents. This technique allowed the identification of 11 new infrared peaks that could be assigned to five different product molecules: methane (CH4), acetylene (C2H2), ethane (C2H6), 1-butene (C4H8), and n-butane (C4H10) (Table 1; Figure 3). These infrared identifications agree with the only two other studies that incorporated in situ infrared analysis of the sample (Kaiser & Roessler 1998; Zhou et al. 2014).

Figure 1. Infrared spectra from 6000 to 500 cm−1 for ethylene (top: C2H4; bottom: C2D4) ices before (black) and after (red) the irradiation with a zoomed-in view of the overtones in the inset box along with assignments (Table 1).
Download figure:
Standard image High-resolution image
Figure 2. Infrared spectra for ethylene (C2H4) before (black) and after (red) irradiation from 6000 to 3350 cm−1 (top) and from 2800 to 500 cm−1 (bottom); assignments of the spectra are given in the first section of Table 1.
Download figure:
Standard image High-resolution image
Figure 3. Deconvoluted infrared spectra of ethylene (C2H4) from 3350 to 2800 cm−1 before (top panels) and after (bottom panels) the irradiation. The left panels and insets are zoomed in to show smaller features; assignments of the complete spectra are given in the first section of Table 1.
Download figure:
Standard image High-resolution imageFurther FTIR analysis during TPD shows that molecules of higher molecular weight than those identified in Table 1 are formed, as infrared stretches are still visible in the temperature range of 90–200 K (Figures 4(a)–(f)). No new infrared bands were detected during heating, and no increase in any infrared band signal detected at 5.5 K was observed during the TPD, showing that these molecules were formed at 5.5 K from the electron irradiation. The deconvoluted spectrum from 3000 to 2800 cm−1 is presented at 90 K, which is the temperature just prior to the sublimation event correlated with n-butane via mass spectrometry (Figure 4(a)). Although n-butane was the largest molecule identified via FTIR, there were still seven infrared stretches visible at 105 K (Figure 4(b)), which is above the sublimation temperature of n-butane of 90 K. These infrared bands are observed to decrease in intensity during TPD (Figures 4(c)–(d)), and the simultaneous monitoring using the RGA and PI-ReTOF-MS provides further information of the contributing molecules to the observed infrared stretches observed at higher temperatures.
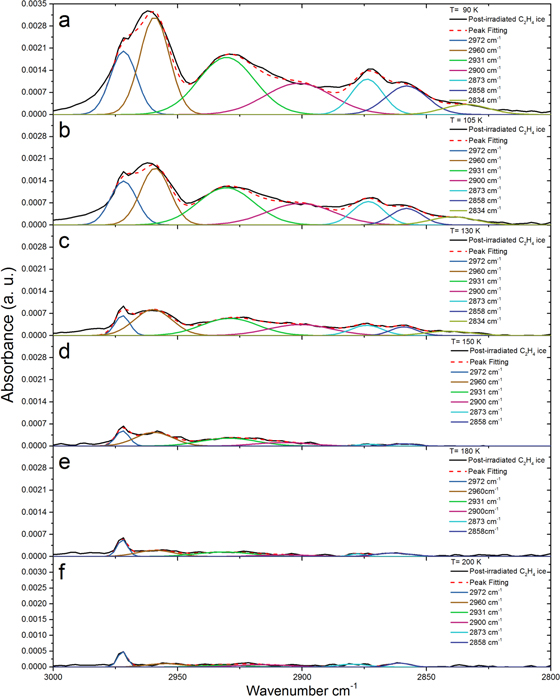
Figure 4. Deconvoluted infrared spectra of ethylene (C2H4) from 3000 to 2800 cm−1 for selected temperatures corresponding to the sublimation temperatures of alkanes as observed via PI-ReTOF-MS.
Download figure:
Standard image High-resolution image3.2. Mass Spectrometry—RGA
It should be noted that not only was the PI-ReTOF-MS used, but also an RGA was used to monitor subliming molecules. However, as previously discussed, this technique is far less sensitive, and with the fragmentation capabilities of the ionization source used, electron impact at 100 eV, the only molecules that can be definitively identified are alkanes. This technique was not able to detect any alkanes, other than ethane, that were not detected using PI-ReTOF-MS and did not add any additional data to the experiment.
3.3. Mass Spectrometry—PI-ReTOF-MS
During TPD, the subliming molecules were detected via PI-ReTOF-MS utilizing 10.49 eV photons as an ionizing source (Figure 5, Table 3). Figure 5 depicts the intensities of the mass-to-charge ratio signals as a function of temperature detected during TPD of irradiated ethylene and D4-ethylene ices with signals approaching m/z = 275. It should be noted that the difference in intensity of signals between these two ices is due to the photon flux rather than the abundance produced within each ice. Seven groups of hydrocarbons with the following general molecular formulae were detected: CnH2n+2 (n = 4–10), CnH2n (n = 2–12, 14, 16), CnH2n−2 (n = 3–12, 14, 16), CnH2n−4 (n = 4–12, 14, 16), CnH2n−6 (n = 4–10, 12), CnH2n−8 (n = 6–10), and CnH2n−10 (n = 6–10). The majority of the ionized products detected within these groups, as well as the entire CnH2n−4, CnH2n−6, CnH2n−8, and CnH2n−10 species, represent molecules that have been hitherto unidentified as products of irradiated ethylene ice.

Figure 5. Recorded PI-ReTOF-MS data reporting the temperature-dependent mass spectra for ethylene (top: C2H4; bottom: C2D4) at a photoionization energy of 10.49 eV.
Download figure:
Standard image High-resolution imageTable 3. Masses Correlated to Molecules Detected in Both Experiments
| m/z | C2H4 (30 nA; 10.49 eV) | C2D4 (30 nA; 10.49 eV) | m/z |
|---|---|---|---|
| 28 | C2H4 | C2D4 | 32 |
| 40 | C3H4 | C3D4 | 44 |
| 42 | C3H6 | C3D6 | 48 |
| 50 | C4H2 | C4D2 | 52 |
| N/A | C4D3H | 55 | |
| 52 | C4H4 | C4D4 | 56 |
| 53 | 13CC3H4 | 13CC3D4 | 57 |
| N/A | C4D5H | 59 | |
| 54 | C4H6 | C4D6 | 60 |
| 55 | 13CC3H6 | 13CC3D6 | 61 |
| N/A | C4D7H | 63 | |
| 56 | C4H8 | C4D8/aC5D2 | 64 |
| 57 | 13CC3H8 | 13CC3D8 | 65 |
| 58 | C4H10 | n.d. | 68 |
| 59 | 13CC3H10 | n.d. | 69 |
| 62 | aC5H2 | C4D8/aC5D2 | 64 |
| 64 | C5H4 | n.d. | 68 |
| 65 | aC5H5 | n.d. | 70 |
| 66 | C5H6 | C5D6 | 72 |
| 67 | aC5H7 | aC5D7 | 74 |
| 68 | a13CC4H7 | a13CC4D7 | 75 |
| 68 | C5H8 | C5D8/C6D2 | 76 |
| 69 | 13CC4H8 | n.d. | 77 |
| 69 | aC5H9 | aC5D9 | 78 |
| 70 | C5H10 | C5D10/C6D4 | 80 |
| 71 | 13CC4H10 | n.d. | 81 |
| 71 | aC5H11 | aC5D11/aC6D5 | 82 |
| 72 | C5H12 | C5D12/C6D6 | 84 |
| 73 | 13CC4H12 | n.d. | 85 |
| 74 | C6H2 | C5D8/C6D2 | 76 |
| 76 | C6H4 | C5D10/C6D4 | 80 |
| 77 | aC6H5 | aC5D11/aC6D5 | 82 |
| 78 | C6H6 | C5D12/C6D6 | 84 |
| 79 | aC6H7 | aC6D7/aC7D1 | 86 |
| 80 | 13CC5H7 | 13CC5D7/C6D7H | 87 |
| 80 | C6H8 | C6D8 | 88 |
| 81 | 13CC5H8 | 13CC5D8 | 89 |
| 81 | aC6H9 | aC6D9/aC7D3 | 90 |
| 82 | a13CC5H9 | 13CC5D9/C6D9H | 91 |
| 82 | C6H10 | C6D10/C7D4 | 92 |
| 83 | 13CC5H10 | 13CC5D10 | 93 |
| 83 | aC6H11 | aC6D11/aC7D5 | 94 |
| 84 | a13CC5H11 | C6D11H | 95 |
| 84 | C6H12 | C6D12/C7D6 | 96 |
| 85 | 13CC5H12 | 13CC5D12 | 97 |
| 85 | aC7H1 | aC6D7/aC7D1 | 86 |
| N/A | C6D13H/13CC6D7 | 99 | |
| 86 | C6H14 | C6D14/C7D8 | 100 |
| 87 | 13CC5H14 | n.d. | 101 |
| 87 | aC7H3 | aC6D9/aC7D3 | 90 |
| 88 | C7H4 | C6D10/C7D4 | 92 |
| 89 | aC7H5 | aC6D11/aC7D5 | 94 |
| 90 | C7H6 | C6D12/C7D6 | 96 |
| 91 | aC7H7 | aC7D7 | 98 |
| 92 | 13CC6H7 | 13CC6D7/C6D13H | 99 |
| 92 | C7H8 | C6D14/C7D8 | 100 |
| 93 | aC7H9 | aC7D9 | 102 |
| 94 | C7H10 | C7D10/C8D4 | 104 |
| 95 | aC7H11 | aC7D11/aC8D5 | 106 |
| 96 | C7H12 | C7D12 | 108 |
| 97 | 13CC6H12 | n.d. | 109 |
| 97 | aC7H13 | aC7D13/aC8D7 | 110 |
| 98 | C7H14 | C7D14/C8D8 | 112 |
| 99 | 13CC6H14 | 13CC6D14/13CC7D8 | 113 |
| 99 | aC7H15 | aC7D15/aC8D9 | 114 |
| 100 | C7H16 | C7D16/C8D10/C9D4 | 116 |
| 101 | 13CC6H16 | n.d. | 117 |
| 101 | aC8H5 | aC7D11/aC8D5 | 106 |
| 102 | C8H6 | C7D12/C8D6 | 108 |
| 103 | aC8H7 | aC7D13/aC8D7 | 110 |
| 104 | C8H8 | C7D14/C8D8 | 112 |
| 105 | 13CC7H8 | 13CC6D14/13CC7D8 | 113 |
| 105 | aC8H9 | aC7D15/aC8D9 | 114 |
| 106 | C8H10 | C7D16/C8D10/C9D4 | 116 |
| 107 | aC8H11 | aC8D11/aC9D5 | 118 |
| 108 | C8H12 | C8D12/C9D6 | 120 |
| 109 | 13CC7H12 | n.d. | 121 |
| 109 | aC8H13 | aC8D13/aC9D7 | 122 |
| 110 | C8H14 | C8D14/C9D8/C10D2 | 124 |
| 111 | 13CC7H14 | 13CC7D14/13CC8D8/13CC9D2 | 125 |
| 111 | aC8H15 | aC8D15/aC9D9 | 126 |
| N/A | C8D15H /C9D9H | 127 | |
| 112 | C8H16 | C8D16/C9D10 | 128 |
| 113 | 13CC7H16 | 13CC7D16/13CC8D10/13CC9D4 | 129 |
| 113 | aC8H17 | aC8D17/aC9D11/aC10D5 | 130 |
| 113 | aC9H5 | aC8D11/aC9D5 | 118 |
| 114 | C8H18 | C8D18/C9D12 | 132 |
| 115 | 13CC7H18 | n.d. | 133 |
| 115 | aC9H7 | aC8D13/aC9D7 | 122 |
| 116 | C9H8 | C8D14/C9D8 | 124 |
| 117 | aC9H9 | aC8D15/aC9D9 | 126 |
| 118 | C9H10 | C8D16/C9D10 | 128 |
| 119 | 13CC8H10 | 13CC7D16/13CC8D10 | 129 |
| 119 | aC9H11 | aC8D17/aC9D11/aC10D5 | 130 |
| 120 | C9H12 | C8D18/C9D12 | 132 |
| 121 | aC9H13 | aC9D13 | 134 |
| 122 | C9H14 | C9D14 | 136 |
| 123 | aC9H15 | aC9D15/aC10D9 | 138 |
| 124 | C9H16 | C9D16/C10H10 | 140 |
| 125 | 13CC8H16 | n.d. | 141 |
| 125 | aC9H17 | aC9D17/aC10D11/aC11D5 | 142 |
| 125 | aC10H5 | aC8D17/aC9D11/aC10D5 | 130 |
| 126 | C9H18 | C9D18/C10D12 | 144 |
| 127 | 13CC8H18 | n.d. | 145 |
| 127 | aC9H19 | aC9D19/aC10D13/aC11D7 | 146 |
| 128 | C9H20 | C9D20/C10D14 | 148 |
| 129 | aC10H9 | aC9D15/aC10D9 | 138 |
| 130 | C10H10 | C9D16/C10H10 | 140 |
| 131 | aC10H11 | aC9D17/aC10D11/aC11D5 | 142 |
| 132 | C10H12 | C9D18/C10D12 | 144 |
| 133 | aC10H13 | aC9D19/aC10D13/aC11D7 | 146 |
| 134 | C10H14 | C9D20/C10D14 | 148 |
| 135 | aC10H15 | aC10D15/aC11D9/aC12D3 | 150 |
| 136 | C10H16 | C10D16 | 152 |
| 137 | aC10H17 | aC10D17/aC11D11/aC12D5 | 154 |
| 137 | aC11H5 | aC9D17/aC10D11/aC11D5 | 142 |
| 138 | C10H18 | C10D18 | 156 |
| 139 | 13CC9H18 | n.d. | 157 |
| 139 | aC10H19 | aC10D19/aC11D13/aC12D7 | 158 |
| 139 | aC11H7 | aC9D19/aC10D13/aC11D7 | 146 |
| 140 | C10H20 | C10D20 | 160 |
| 141 | 13CC9H20 | n.d. | 161 |
| 141 | aC10H21 | aC10D21/aC11D15/aC12D9 | 162 |
| 141 | aC11H9 | aC10D15/aC11D9/aC12D3 | 150 |
| 142 | C10H22 | C10D22 | 164 |
| 143 | 13CC9H22 | n.d. | 165 |
| 143 | aC11H11 | aC10D17/aC11D11/aC12D5 | 154 |
| 145 | aC11H13 | aC10D19/aC11D13/aC12D7 | 158 |
| 147 | aC11H15 | aC10D21/aC11D15/aC12D9 | 162 |
| 147 | aC12H3 | aC10D15/aC11D9/aC12D3 | 150 |
| 149 | aC11H17 | aC11D17/aC13D5 | 166 |
| 149 | aC12H5 | aC10D17/aC11D11/aC12D5 | 154 |
| 150 | C11H18 | C11D18 | 168 |
| 151 | aC11H19 | aC11D19/aC13D7 | 170 |
| 151 | aC12H7 | aC10D19/aC11D13/aC12D7 | 158 |
| 152 | C11H20 | C11D20 | 172 |
| 153 | aC12H9 | aC10D21/aC11D15/aC12D9 | 162 |
| 154 | C11H22 | C11D22 | 176 |
| 161 | aC12H17 | aC12D17/aC13D11 | 178 |
| 161 | aC13H5 | aC11D17/aC13D5 | 166 |
| 162 | C12H18 | C12D18 | 180 |
| 163 | aC12H19 | aC12D19/aC13D13 | 182 |
| 163 | aC13H7 | aC11D19/aC13D7 | 170 |
| 164 | C12H20 | C12D20 | 184 |
| 165 | aC12H21/aC13H9 | n.d. | 186/174 |
| 166 | C12H22 | C12D22 | 188 |
| 167 | 13CC11H22 | n.d. | 189 |
| 167 | aC13H11 | aC13D11 | 178 |
| 168 | C12H24 | C12D24 | 192 |
| 169 | 13CC11H24 | n.d. | 193 |
| 169 | aC13H13 | aC12D19/aC13D13 | 182 |
| 192 | C14H24 | C14D24 | 216 |
| 194 | C14H26 | C14D26 | 220 |
| 196 | C14H28 | C14D28 | 224 |
| 220 | C16H28 | C16D28 | 248 |
| 222 | C16H30 | C16D30 | 252 |
| 224 | C16H32 | C16D32 | 256 |
Note. Italics represent a minor possible contributor to an ion signal; N/A designates that there is no respective non-isotopic form of the observed deuterated molecule; n.d. denotes that no signal was detected corresponding to this ion.
aDesignates the assigned formula as a fragment.3.3.1. CnH2n+2
Figure 6 shows seven TPD profiles of the ion signals corresponding to the most saturated hydrocarbon group, alkanes (CnH2n+2; n = 4–10), that were detected with PI-ReTOF-MS during TPD. The lack of signal for methane (CH4) and ethane (C2H6) was expected, as they have ionization energies of 12.61 and 11.52 eV (Lias et al. 2016), respectively, which are both larger than the 10.49 eV photoionization energy used in the experiment. The FTIR detection of n-butane was confirmed via the detection of m/z = 58 ( ), which began to sublime at 90 K. Although FTIR determined the largest molecule to n-butane, several larger alkanes were also detected at m/z = 72 (
 , 107 K), m/z = 86 (
 , 111 K), m/z = 100 (
 , 125 K), m/z = 114 (
 , 129 K), m/z = 128 (
 , 148 K), and m/z = 142 (
 , 151 K). An increase in sublimation temperature from 3 to 19 K is observed for each additional CH2 unit and from 18 to 23 K for each C2H4 unit added. These sublimation onset temperatures correlate well with several of these recently detected alkanes using the same apparatus (Abplanalp & Kaiser 2016). The ion signal for n-butane, m/z = 58 (
 ), was determined to be very low, due to n-butane (CH3CH2CH2CH3) having an ionization energy of 10.5 ± 0.1 eV (Lias 1982, p. 409), which is at the limit of the 10.49 eV photoionization energy used in the present experiment.

Figure 6. TPD profiles recorded via PI-ReTOF-MS for masses with the generic formula of CnH2n+2/CnD2n+2 (alkanes).
Download figure:
Standard image High-resolution imageA trend displayed in this hydrocarbon group is that signal intensity decreases with an increase in the molecular size. However, this trend is divided by even or odd numbers of carbon units contained in the ions. This trend is detected starting after m/z = 58, due to n-butane having a photoionization energy near the threshold of the experimental photoionization energy used. For example, when an odd carbon ion signal ( ) is compared to the next largest odd carbon ion signal (
 ), a decrease in intensity is observed, and the same trend is detected when comparing an even carbon unit (
 ) to the next largest even carbon alkane (
 ). However, this trend does not occur when comparing a smaller odd carbon unit ion signal (
 ) to the next largest even carbon unit ion signal (
 ), and rather this trend is reversed as the signal of even carbon unit alkanes is higher than the smaller odd carbon unit ion they are compared to. This later observation also shows a second trend that all intensities of odd carbon ion signals (
 ,
,  ,
,  ) have lower intensities than even carbon ion signals (
 ,
,  ,
,  ) of similar size. These trends may have implications for the formation mechanism discussed in Section 4.9; however, these ion signals have not been normalized with their respective photoionization cross sections, as each isomer would need to be discriminated to determine relative quantities produced.
3.3.2. CnH2n
Although the previous group, alkanes CnH2n+2, can only belong to this one type of hydrocarbon arrangement involving single carbon–carbon bonds, the next group, CnH2n(n = 2–12, 14, 16), can be described as alkenes or the double-bond equivalent (DBE) (cycloalkanes). Figure 7 shows the PI-ReTOF-MS data for this group of hydrocarbons, with the top panel displaying the ion signal for the reactant ethylene (C2H4), but all other panels shown represent detected products from the irradiation of ethylene. Many unsaturated hydrocarbons relevant to this group were detected, including m/z = 28 ( , 60 K), m/z = 42 (
 , 73 K), m/z = 56 (
 , 86 K), m/z = 70 (
 , 101 K), m/z = 84 (
 , 111 K), m/z = 98 (
 , 123 K), m/z = 112 (
 , 130 K), m/z = 126 (
 , 140 K), m/z = 140 (
 , 147 K), m/z = 154 (
 , 158 K), m/z = 168 (
 , 163 K), m/z = 196 (
 , 179 K), and m/z = 224 (
 , 193 K). Similar to the alkanes, an increase in sublimation temperature of 5–15 K per CH2 unit added was observed. The detection of m/z = 56 (
 ) via PI-ReTOF-MS, which may correspond to 1-butene, substantiated the FTIR detection of this alkene.

Figure 7. TPD profiles recorded via PI-ReTOF-MS for masses with the generic formula of CnH2n/CnD2n, which may correspond to alkenes and/or cycloalkanes.
Download figure:
Standard image High-resolution imageSimilar to the alkanes, this group depicts the trend that, typically, a decrease in intensity of the ion signal is observed as the molecule increases in size based on the division of even and odd carbon unit molecules. The signal produced for m/z = 28 should be excluded from this trend, as it was the reactant. However, this trend fails for m/z = 84 ( ) in this group of hydrocarbons, which may suggest that this is a major product of the ethylene irradiation, but without the untangling of this ion signal's contributors, and application of the respective photoionization cross sections does not allow for this speculation to be confirmed.
3.3.3. CnH2n−2
In situ analysis using FTIR showed that acetylene was a product of ethylene irradiation; however, this was the only alkyne detected with this method. Figure 8 shows several other ion signals, detected via PI-ReTOF-MS, corresponding to alkynes (CnH2n−2) or their DBEs (dienes, cycloalkenes, bicycloalkanes) of n = 3–12, 14, 16. These ion signals were detected at m/z = 40 ( , 78 K), m/z = 54 (
 , 90), m/z = 68 (
 , 104 K), m/z = 82 (
 , 114 K), m/z = 96 (
 , 126 K), m/z = 110 (
 , 133 K), m/z = 124 (
 , 144 K), m/z = 138 (
 , 149 K), m/z = 152 (
 , 160 K), m/z = 166 (
 , 165 K), m/z = 194 (
 , 176 K), and m/z = 222 (
 , 189 K). Once again, each additional CH2 unit resulted in the increase of the sublimation onset temperature of 5–14 K. This group of hydrocarbons follows the similar trend seen in both the CnH2n+2 and CnH2n ion signals with a decrease in intensity based on even or odd units of carbon contained in the molecules.

Figure 8. TPD profiles recorded via PI-ReTOF-MS for masses with the generic formula of CnH2n−2/CnD2n−2, which may correspond to alkynes, dienes, and/or cycloalkenes.
Download figure:
Standard image High-resolution image3.3.4. CnH2n−4
The next most highly unsaturated group detected in these experiments, based on PI-ReTOF-MS but undetected by FTIR, had the general formula CnH2n−4 (n = 4–12, 14, 16) (Figure 9) and can correspond to multiple different structures (yne-ene, trienes, cyclodialkenes, bicycloalkenes). The ion signals related to this group were detected at m/z = 52 ( , 92 K), m/z = 66 (
 , 108 K), m/z = 80 (
 , 115 K), m/z = 94 (
 , 128 K), m/z = 108 (
 , 134 K), m/z = 122 (
 , 149 K), m/z = 136 (
 , 152 K), m/z = 150 (
 , 163 K), m/z = 164 (
 , 168 K), m/z = 192 (
 , 179 K), and m/z = 220 (
 , 192 K). An increase in the onset sublimation temperature of 3–16 K was observed for each additional CH2 unit. As observed in the previous hydrocarbon groups, a decrease in ion signal intensity was observed as the molecular size increase and was based on the incorporation of even or odd units of carbon incorporated into the molecule.

Figure 9. TPD profiles recorded via PI-ReTOF-MS for masses with the generic formula of CnH2n−4/CnD2n−4 (yne-ene, trienes, cyclodialkenes, bicycloalkenes).
Download figure:
Standard image High-resolution image3.3.5. CnH2n−6
The PI-ReTOF-MS also detected the hydrocarbon group CnH2n−6 (n = 4–10, 12) (Figure 10). Ion signals at m/z = 50 ( , 99 K), m/z = 64 (
 , 114 K), m/z = 78 (
 , 118 K), m/z = 92 (
 , 127 K), m/z = 106 (
 , 136 K), m/z = 120 (
 , 150 K), m/z = 134 (
 , 156 K), and m/z = 162 (
 , 169 K) were detected. Although the previous trend does not appear to continue for this group of hydrocarbons, this could be due to the much lower signals, as these are most likely minor products, and therefore photoionization cross sections may play a larger role in determining the relative ratios. Although this group is highly unsaturated, the mass-to-charge ratios are not able to be assigned to other molecules for n = 4–9, and the sublimation events for n = 10 and 12 occur at the anticipated temperatures for this group. Also, it should be clarified that the large peaks observed in the deuterated ion signals for n = 7 and 9 correspond to earlier identified hydrocarbon groups; however, these signals also show a smaller second peak that matches the sublimation event of their unambiguous nondeuterated partners.

Figure 10. TPD profiles recorded via PI-ReTOF-MS for masses with the generic formula of CnH2n−6/CnD2n−6 (yne-diene, diynes, tetraenes, cyclotrialkenes, tri-cycloalkenes).
Download figure:
Standard image High-resolution image3.3.6. CnH2n−8
Also, the previously unidentified hydrocarbon group CnH2n−4 (n = 6–10) (Figure 11) was detected via signals at m/z = 76 ( , 111 K), m/z = 90 (
 , 117 K), m/z = 104 (
 , 133 K), m/z = 118 (
 , 138 K), and m/z = 132 (
 , 162 K). Again the trend previously observed of a distinct change in signal intensity based on even or odd carbon units incorporated into the molecule is no longer detected. Similarly to the CnH2n−6 hydrocarbon group, the deuterated compounds have multiple possible molecules associated with these ion signals, but a match between the deuterated peaks and the unambiguous nondeuterated sample shows that these signals in fact belong to multiple ions.

Figure 11. TPD profiles recorded via PI-ReTOF-MS for masses with the generic formula of CnH2n−8/CnD2n−8 (yne-triene, diyne-ene, pentaenes, tri-cyclobialkenes).
Download figure:
Standard image High-resolution image3.3.7. CnH2n−10
Finally, the most highly unsaturated hydrocarbon group detected belonged to the general formula CnH2n−4 (n = 6–10) (Figure 12). The ions corresponding to this group were detected at m/z = 74 ( , 114 K), m/z = 88 (
 , 118 K), m/z = 102 (
 , 122 K), m/z = 116 (
 , 129 K), and m/z = 130 (
 , 159 K). No trend was observed for odd or even carbon unit molecules. Also, the observed peaks have multiple peaks or are broad, which may be due, in part, to these ions being produced as fragments of larger hydrocarbon groups (see Section 3.3.8). Also, just as for the previous two groups, the deuterated ion signals have multiple ions associated with these signals.

Figure 12. TPD profiles recorded via PI-ReTOF-MS for masses with the generic formula of CnH2n−10/CnD2n−10 (yne-tetraene, diyne-biene, hexaenes, tri-cyclotrialkenes).
Download figure:
Standard image High-resolution image3.3.8. Isotopes and Fragments
There were also several ion signals detected, which are able to be explained by either natural isotopic substitution or the fragmentation of larger hydrocarbons. First, these ion signals were overlaid with their possible parent isotopologues to confirm an isotopic assignment (Figures 13–15). The analysis technique employed the method of comparing sublimation onset temperatures to deduce whether ion signals that could belong to multiple molecules had similar profiles when compared to their isotopically shifted analog, as this shift separates the overlapping signals in question. For the ethylene (C2H4) ice the most abundant isotopologues would be a carbon-13 (+1 amu) substitution; therefore, only the next highest mass was analyzed for relative abundance to determine whether this was a correct assignment (Figures 13–14, Table 3). The D4-ethylene (C2D4) ice has the possibility of producing naturally substituted isotopologues containing carbon-13 (+1 amu) or hydrogen (−1 amu); therefore, both the next highest and lowest masses were investigated (Figure 15), if detected, to determine the validity of the assignment (Table 3). This technique reveals that some of these irregular ion traces are due to isotopic differences; however, there are several ions that are not able to be assigned as isotopologues.

Figure 13. Overlay of ethylene (C2H4) odd ion signals (red) with possible parent ion (black) for isotopic comparison for signals from m/z = 52 to 108; assignments are given in Table 3.
Download figure:
Standard image High-resolution image
Figure 14. Overlay of ethylene (C2H4) odd masses (red) with possible parent ion (black) for isotopic comparison for signals from m/z = 110 to 168; assignments are given in Table 3.
Download figure:
Standard image High-resolution image
Figure 15. Overlay of D4-ethylene (C2D4) odd masses (green: hydrogen; blue: 13C) with possible parent ion (red) for isotopic comparison for signals from m/z = 55 to 130; assignments are given in Table 3.
Download figure:
Standard image High-resolution imageTherefore, it was necessary to investigate whether these remaining ions could be due to fragmentation of larger molecules. Typically PI-ReTOF-MS utilizing 10.49 eV photons is a "soft" ionization technique that results in no fragmentation; however, many of the larger hydrocarbons detected in this experiment are known to fragment at or below 10.49 eV (Bell et al. 2013; Lias et al. 2016; Urness et al. 2013). Ions that were suspected to be isotopologues but that had stronger ion signals than their prospective parent were thus not able to be assigned as an isotopologue, but it is possible that the isotopic component may contribute to the signal. To determine the assignment of these ion signals, the ethylene (C2H4) products and their respective ions from the D4-ethylene ice were compared (Figures 16–17) and then assigned accordingly (Table 3). It should be pointed out that if an assignment does not appear in Table 3, this is not due to a lack of analysis, but rather a lack of agreement with the previously defined analysis method. Also, the parent molecules that produced these fragment ions are able to be determined by comparing their sublimation profiles to larger hydrocarbons' sublimation profiles that could possibly produce these ions (Figures 18–21). Since both C2H4 and C2D4 ices were analyzed, each questionable fragment or isotope was also cross-analyzed between systems (Figures 13–21). This technique has been shown to be a useful tool in assigning certain ion signals that do not directly correspond to an expected molecular ion (Kaiser et al. 2014; Turner et al. 2015, 2016; Abplanalp & Kaiser 2016).

Figure 16. Overlay of possible ethylene (C2H4) fragments (black) with their corresponding D4-ethylene (C2D4) ion signals (red: first matching ion; blue: second matching ion) from m/z = 62 to 115; assignments are given in Table 3.
Download figure:
Standard image High-resolution image
Figure 17. Overlay of possible ethylene (C2H4) fragments (black) with their corresponding D4-ethylene (C2D4) ion signals (red: first matching ion; blue: second matching ion) from m/z = 117 to 169; assignments are given in Table 3.
Download figure:
Standard image High-resolution image
Figure 18. TPD profiles recorded via PI-ReTOF-MS corresponding to C3 (red), C4 (bright green), C5 (cyan), C6 (blue), C7 (yellow), and C8 (purple), respectively, in the subliming ethylene (C2H4) sample after irradiation.
Download figure:
Standard image High-resolution image
Figure 19. TPD profiles recorded via PI-ReTOF-MS corresponding to C8 (purple), C9 (dark green), C10 (orange), C11 (pink), C12 (cyan), C14 (light yellow), and C16 (light red), respectively, in the subliming ethylene (C2H4) sample after irradiation.
Download figure:
Standard image High-resolution image
Figure 20. TPD profiles recorded via PI-ReTOF-MS corresponding to C3 (red), C4 (bright green), C5 (cyan), C6 (blue), C7 (yellow), C8 (purple), C9 (dark green), and C10 (orange), respectively, in the subliming D4-ethylene (C2D4) sample after irradiation.
Download figure:
Standard image High-resolution image
Figure 21. TPD profiles recorded via PI-ReTOF-MS corresponding to C11 (pink), C12 (cyan), C14 (light yellow), and C16 (light red), respectively, in the subliming D4-ethylene (C2D4) sample after irradiation.
Download figure:
Standard image High-resolution image4. Discussion
4.1. Summary of Results
Prior to continuing into the discussion of the results, a brief summary of the results is included:
- 1.
- 2.The more sensitive PI-ReTOF-MS study detected seven hydrocarbon groups of differing degrees of saturation: CnH2n+2 (n = 4–10), CnH2n (n = 2–12, 14, 16), CnH2n−2 (n = 3–12, 14, 16), CnH2n−4 (n = 4–12, 14, 16), CnH2n−6 (n = 4–10, 12), CnH2n−8 (n = 6–10), CnH2n−10 (n = 6–10).
4.2. CnH2n+2
The ion signals corresponding to the hydrocarbon group CnH2n+2 with n = 4–10 can only correspond to ions of alkanes (Figure 6). However, FTIR analysis was only able to determine the presence of ethane and n-butane. The interesting trend that the raw ion signals differ in intensity based on the incorporation of even or odd numbers of carbon units into the molecule is observed throughout this group and helps to shed light on a possible reaction mechanism (Section 4.9) for the ethylene ice. The only isomer that can be definitively identified in this group is n-butane (I.E. = 10.5 ± 0.1; Lias 1982, p. 409), as its isomer, isobutane, has an ionization energy of 10.68 ± 0.11 (Lias et al. 2016), which will not be ionized and therefore not detected with the 10.49 eV experiment discussed here. This discrimination between the n-butane and isobutane shows how isomers are able to be determined using tunable photoionization. The FTIR detection of the ethyl radical (C2H5) and nondetection of the methyl radical (CH3) suggest that this is an important radical in the construction of alkanes with additional C2 units, as the alkanes with an even number of carbon atoms are primarily produced (Section 4.9). It is interesting also to point out that the general molecular formulae grow by an additional C2H4 unit from an odd carbon alkane to the next largest odd carbon alkane, and likewise from an even carbon alkane to the next largest even alkane.
For both groups of alkanes there are multiple peaks observed within the sublimation profile. This is most likely due to the molecule subliming at its typical onset sublimation temperature, but a fraction of this molecule remained trapped within a product ice that had a higher sublimation temperature. For all of the even-carbon-containing alkanes the first observed peak is very dominant in signal and the second peak is much smaller, corroborating this theory of trapping as the second peak for this group matches with the next largest even carbon alkane sublimation peak. However, the odd-carbon-containing alkanes do not always have their first sublimation peak as the strongest signal, but this can be accounted for by the low overall signal of this group, which is trapped primarily within another ice. This explanation is again validated by the overlap of the sublimation peak of the next largest alkane. The onset sublimation temperatures of these even carbon alkanes match very closely with those observed in the recent similar work of ethane (C2H6) and D6-ethane (C2D6) irradiation and PI-ReTOF-MS analysis (Abplanalp & Kaiser 2016). The theory of trapping and co-sublimation with molecules that have higher sublimation temperatures has been suggested previously (Kaiser et al. 2014; Maity et al. 2015). Alternatively and less likely, based on Figure 6, these sublimation events detected at higher temperatures could correspond to alternate isomers if their sublimation temperatures differ this greatly. However, until further tunable photoionization studies are finished, this is not possible to discuss in detail here. Finally, it is important to point out that none of these later sublimation events or any signal detected in this group (CnH2n+2) can be due to fragmentation of larger molecules. These results are much more diverse than previous experiments, as Wagner (1962) was only able to detect products with even carbon units, and multiple other experiments (Gorden & Ausloos 1971; Strazzulla et al. 2002; Compagnini et al. 2009; Ennis et al. 2011; Zhou et al. 2014) did not detect any alkanes with an odd carbon unit. However, Kaiser & Roessler (1998) were able to assign alkane products containing both even and odd carbon units from C3 to C14.
4.3. CnH2n
The next hydrocarbon group of discussion corresponds to alkenes (CnH2n) and/or cycloalkanes of n = n = 2–12, 14, 16 (Figure 7). Although only 1-butene was able to be assigned via FTIR, a large number of other alkenes were also produced. A very interesting difference between this group and the alkane group was the detection of ion signals corresponding to molecules of the molecular formulae C11H22, C12H24, C14H28, and C16H32, which did not have a detectable saturated relative in the alkane group. The detection of large hydrocarbon compounds with an even number of carbon atoms (C12H24, C14H28, C16H32) but not the odd carbon ions (C13H26, C15H30) reaffirms that the even carbon unit hydrocarbons are preferentially formed. Meanwhile, the odd carbon unit hydrocarbons are only minor products, or possibly result from the decay of larger even-carbon-containing hydrocarbons (Section 4.9), which was previously demonstrated for irradiated ethane ices (Abplanalp & Kaiser 2016). Furthermore, the detections of these alkenes, or cycloalkanes that are larger than their alkane relatives, may suggest that the alkane is below our detection limit, if it was initially produced such that it decomposed into the observed alkene ion signal detected, or that ethylene ices prefer to form alkene products over alkanes. Zhou et al. (2014) showed that radiolysis of n-butane readily converts it to the 1-butene alkene type molecule, and this is likely to happen to larger alkanes as well.
Similar to the alkane group, there were multiple sublimation peaks observed in most of the CnH2n ion signals. As discussed within the alkane group, this has the possible explanation of multiple isomers, or trapping within other ice products. Comparison of the alkene group sublimation events (Figures 7, 18–21) to sublimation profiles of larger molecular weight compounds shows that a corresponding sublimation event can easily be identified. It is unlikely that these molecules are fragments of these molecules that are subliming at higher temperatures, as they are not reported as possible fragments at 10.49 eV (Lias et al. 2016); however, even if these are fragments, the first peak does not overlap perfectly with the possible parent molecules, which shows that at least a certain amount if not all of the first peak is not from fragment ions and is from molecules ionized after sublimation. Until the present study C3H6 was the only odd unit alkene detected as a product of ethylene ice irradiation (Tschuikow-Roux et al. 1967; Gorden & Ausloos 1971; Kaiser & Roessler 1998); however, the current results show that many larger odd carbon unit alkene type molecules are formed from the processing of pure ethylene ices.
4.4. CnH2n−2
Figure 8 depicts ion signals corresponding to alkynes (CnH2n−2) and/or dienes, cycloalkenes, and bicycloalkanes with n = 3–12, 14, 16 that were also identified via PI-ReTOF-MS. Although acetylene (I.E. = 11.40 ± 0.02; Bieri et al. 1977) is not able to be detected with PI-ReTOF-MS at 10.49 eV, this molecule was detected in the FTIR analysis. The detection of ions corresponding to C11H20, C12H22, C14H26, and C16H30 is very interesting, as the trend of detected ions matches that of the CnH2n group rather than the alkane (CnH2n+2) group. These detections reinforce the possibility that saturated, or more saturated, molecules can undergo radiolysis to form the next most unsaturated product readily. Another interesting point to make from their detection is that if the parent molecule produces these further unsaturated molecules, then it would be expected that the parent alkanes that formed the alkenes would be detectable if the parent of the alkynes, which are the alkenes, is detectable. This furthers the suggestion that alkene type molecules are the primary product formed within ethylene ices. As observed in the previous systems, multiple sublimation events occur, but they are most likely associated with the trapping of these molecules in heavier hydrocarbon products. Similar to the alkene group, there was only a single product, C3H4, previously identified (Tschuikow-Roux et al. 1967; Kaiser & Roessler 1998), but the use of PI-ReTOF-MS has shown that many more products are able to be formed.
4.5. CnH2n−4
For the first time the hydrocarbon group associated with many structures such as yne-ene, trienes, cyclodialkenes, and bicycloalkenes, having the general formula CnH2n−4 (n = 4–12, 14, 16), was detected via PI-ReTOF-MS as a product of ethylene ice irradiation (Figure 9). Again following the trend of CnH2n and CnH2n−2, ions associated with C11H18, C12H20, C14H24, and C16H28 were detected, although their alkane counterparts were undetected. It is interesting that our recent study on the irradiation of ethane ice and analysis via PI-ReTOF-MS determined this hydrocarbon group to be the most highly unsaturated that were produced (Abplanalp & Kaiser 2016), with ions as large as C12H20 detected. However, larger ions were detected from the radiolysis of ethylene ice, but a similar trend of signals only belonging to the even carbon unit molecules being detected for these larger molecules was observed in both ethane and ethylene irradiation.
4.6. CnH2n−6
Also, the hydrocarbon group CnH2n−6 (n = 4–10, 12) was detected as a product of ethylene irradiation for the first time (Figure 10). Although ion signals were not detected at C11, C14, and C16 like in the previous three groups, this group still retains a similar trend, as C12 was observed, although its alkane relative was not observed. As stated above, the recent experiments investigating the possible products from ethane ice radiolysis (Abplanalp & Kaiser 2016) were only able to detect up to the unsaturated hydrocarbon group of CnH2n−4, but in the present experiment even further unsaturated systems were detected. Furthermore, Abplanalp & Kaiser (2016) suggested that the observance of the CnH2n−4 group may be able to be used as a scale to determine how much processing the ice has undergone. However, the current study shows that more information may be extracted, as unique unsaturated hydrocarbon groups are able to be produced from saturated (C2H6) and unsaturated (C2H4) reactants. The D4-ethylene ion signals at m/z = 100 and m/z = 132 have an initial large onset sublimation peak due to the alkanes C6D14 and C8D18, respectively, but also a later peak that can be assigned to C7D8 and C9D12, respectively, based on the nondeuterated ion signals.
4.7. CnH2n−8
Another previously undetected product group, CnH2n−8 (n = 6–10), was also detected with PI-ReTOF-MS (Figure 11). Here, each of the deuterated ion signals has two contributors: m/z = 80 (C5D10/C6D4), m/z = 96 (C6D12/C7D6), m/z = 112 (C7D14/C8D8), m/z = 128 (C8D16/C9D10), m/z = 144 (C9D18/C10D12). The first peak of each of these ion signals corresponds to the alkene group (CnH2n), while the later peak correlates with the highly unsaturated CnH2n−8 group. Several astrophysically relevant molecules associated with this group have been previously studied (Section 5).
4.8. CnH2n−10
Finally, the most highly unsaturated group detected via PI-ReTOF-MS in the present study was CnH2n−10 (n = 6–10) (Figure 12), and again this was the first detection of any products from ethylene ice irradiation belonging to this hydrocarbon group. Each of the deuterated ion signals for this group had two contributors: m/z = 76 (C5D8/C6D2), m/z = 92 (C6D10/C7D4), m/z = 108 (C7D12/C8D6), m/z = 124 (C8D14/C9D8), m/z = 140 (C9D16/C10D10). The ion signal of the first peak corresponds to the alkyne group (CnH2n−2), and the second peak is associated with the CnH2n−10 group. This highly unsaturated group has multiple molecules associated with it that have been studied in an astrophysical context related to polycyclic aromatic hydrocarbons (PAHs; Section 5).
4.9. Reaction Mechanism
Previously, Zhou et al. (2014) irradiated solid ethylene and showed that multiple competitive pathways were available for the decomposition of ethylene. This was accomplished by taking into account the FTIR detection of methane (CH4), acetylene (C2H2), ethylene (C2H4), the ethyl radical (C2H5), 1-butene (C4H8), and n-butane (C4H10) and kinetically fitting the coupled differential equations with the column density profiles of these products. The decomposition of ethylene (C2H4) via molecular hydrogen or two hydrogen atom loss to form acetylene (C2H2) (reaction (1)) is possible, as well as the competing reaction of the addition of a hydrogen atom to the ethylene molecule to form the ethyl radical (C2H5) (reaction (2)). A minor pathway available to ethylene decomposition was determined to be the carbon retro-insertion from methylcarbene (HCCH3) (reaction (3)). Finally, ethylene was also found to be able to dimerize and produce 1-butene (reaction (4)). Also, the newly formed ethyl radicals can add another hydrogen atom to form ethane (reaction (5)), or two of the ethyl radicals may recombine barrierlessly to form n-butane (reaction (6)). The newly produced ethane is able to decompose into methane and carbene via retro-insertion (reaction (7)). Finally, the n-butane was also observed to decompose into 1-butene via hydrogen loss (reaction (8)). Most of these proposed reaction pathways, other than radical recombination, are endoergic up to a few eV, but this energy is supplied by the 5 keV electrons. Recall that these electrons deposited on average 5.0 ± 0.8 eV in the C2H4 ice and processed (5.1 ± 1.2) × 1017 ethylene molecules (Table 2).


These reaction mechanisms can thus be used to help propose and to explain the formation routes of the complex hydrocarbons that have been detected here. Starting with the alkanes, CnH2n+2 (n = 4–10), multiple reaction pathways can be involved. For instance, ethylene (C2H4) can be inserted into a carbon–hydrogen bond of the alkane and increase the alkane's size by two carbon atoms (reaction (10)). Alternatively, carbene (CH2) can be inserted into the carbon–hydrogen bond of an alkane, which leads to the carbon chain growth by one carbon atom (reaction (9)). Also, an alkane can lose a hydrogen atom (reaction (11)) via radiolysis, such as the ethane to ethyl transformation. This type of reaction creates an alkyl radical, which is then able to combine barrierlessly with a neighboring radical such as the methyl (CH3) (reaction (12)) or ethyl radical (reaction (13)) (C2H5), which then increases the size of the alkane by one or two carbon atoms, respectively. The pathways utilizing an ethyl radical or ethylene molecule will therefore grow the carbon chain by two units (reactions (10) and (13)), while the carbene insertion and methyl radical pathways lead to an increase by one carbon atom (reactions (9) and (12)).
Although both even- and odd-carbon-containing molecules were detected, there was a much greater production of even carbon unit molecules. This suggests that the pathways that are able to increase the molecular size by one carbon unit are a minor pathway. Furthermore, since only methane, and not the methyl radical, was observed in this study, this suggests that these odd-carbon-containing molecules are formed via the carbene mechanism (reaction (9)) (Kaiser & Maksyutenko 2015a, 2015b; Maksyutenko et al. 2015; Tsegaw et al. 2016). For the even alkanes the growth can be accounted for by the addition of ethylene and/or the ethyl radical. However, there is no known reaction that allows the insertion of an ethylene molecule into the proposed carbon–hydrogen bond as suggested by reaction (10). Therefore, the ethyl radicals, which have been determined to produce n-butane, are likely the source of the even alkanes (reaction (13)), as successive steps of reaction (11) followed by reaction (13) can repeat to account for the production of even alkanes as large as the decanes (C10H22) detected in this experiment.


Abplanalp & Kaiser (2016) suggested that the detected unsaturated hydrocarbon groups could be accounted for by successive dehydrogenation of the previous more saturated group, for example, alkanes produce the alkenes, and alkenes produce alkynes just as suggested in reaction (8). This was supported by the detection of the largest molecule containing the same number of carbons as the previous more saturated group. However, in the present experiment this theory is not as well supported, as a larger alkene was detected than the proposed alkane parent. Therefore, either the parent alkane has completely decomposed, or alkenes are formed primarily via another mechanism. It should also be reiterated that without the knowledge of the exact isomers detected here, the following is a speculative mechanism for the case of a greater production of alkenes over alkanes. The obvious difference between ethane and ethylene is that ethylene contains a carbon–carbon double bond, and when ethylene's double bond is added to via a radical, another radical is formed. Although this addition is not barrierless, it was determined that alkene type molecules have a low activation energy with the ethyl radical addition to ethylene to be 23 kJ mol−1 (0.24 eV) (Pinder & Roy 1957; Lampe & Field 1959), which can easily be supplied by the energetic electrons processing the ice. This reaction can be extrapolated to multiple neighboring ethylene molecules (reaction (14)), causing a cascade of radicals that are able to be terminated by another ethyl radical or a hydrogen atom (reaction (15)).


However, again these reactions lead to alkane production rather than alkene production. Therefore, an alternate mechanism involving the highly reactive product acetylene is involved as an alternate partner in the ethyl radical addition (reaction (16)), which is then followed by the same termination step as before with another ethyl radical or hydrogen atom (reaction (17)), which results in the production of alkenes.


However, detailed mechanisms are not able to be currently isolated to support these speculations, but the acknowledgment that a previously studied simple system has more to offer with new analytical techniques is obvious from these conjectures.
Although the exact isomer for each molecular formula is not currently known at this stage, and therefore the exact photoionization cross section to apply is unknown, an approximation that the alkanes correspond only to the n-alkane structure will allow for a general determination of their relative abundance. This can also be done for the alkenes, assuming that all have the 1-alkene structure up to 1-hexene, as all signals of larger alkenes are significantly less intense and their cross sections are not well known. To accomplish this relative comparison, each ion signal was integrated starting at the onset sublimation temperature until the signal returned to the baseline signal. This integrated signal was then corrected utilizing the photoionization cross sections at 10.5 eV for n-hexane (2.4 Mb), n-heptane (3.5 Mb), n-octane (3.1 Mb), n-nonane (2.0 Mb), and n-decane (3.7 Mb) (Adam & Zimmermann 2007). These photoionization cross sections determined the ratio to be 20.6 ± 5.2:1.9 ± 0.5:7.3 ± 1.8:1.0 ± 0.3:2.1 ± 0.5 (n-pentane:n-hexane:n-heptane:n-octane:n-nonane:n-decane) and 10.6 ± 2.7:2.0 ± 0.5:4.0 ± 1:2.6 ± 0.6:1.0 ± 0.3 for the deuterated species. These data show reasonable agreement between the isotopologue relative abundances for these assumed n-alkanes, with the same trend observed when taking the error into account. It is clear that the even carbon alkane abundance varies greatly from the odd carbon alkanes, but both display a decrease in relative abundance with size, which further reinforces the suggested reaction mechanism that large alkanes were produced from smaller alkanes. The even carbon alkanes n-hexane, n-octane, and n-decane had a relative ratio of 9.9 ± 2.5:3.5 ± 0.9:1.0 ± 0.3 and 10.6 ± 2.7:4.0 ± 1.0:1.0 ± 0.3 for the non-isotopic and isotopic ion signals, respectively, which shows excellent agreement between the two sets of data.
5. Astrophysical Implications
In a broader context, low-temperature interstellar medium (ISM) ices have been shown to contain water (H2O), ammonia (NH3), carbon dioxide (CO2), carbon monoxide (CO), methanol (CH3OH), and even a small percentage of methane (CH4) (Boogert et al. 2015). Also, small hydrocarbons (methane and ethane) have been observed on Titan (Griffith et al. 2006), Pluto (Holler et al. 2014), Makemake (Brown et al. 2015), and Quaoar (Dalle Ore et al. 2009). To date there have been no observations of a pure ethylene ice in the ISM or in any solar system body, but ethylene has been observed in several environments (Encrenaz et al. 1975; Betz 1981; Hanel et al. 1981; Schulz et al. 1999; Cernicharo et al. 2001a; Niemann et al. 2005; Shemansky et al. 2005; Hinkle et al. 2008; Brown et al. 2015; Merlin 2015; Gladstone et al. 2016). However, the chemical evolution of laboratory methane ices shows production of the C2 hydrocarbons acetylene, ethylene, and ethane (Bennett et al. 2006). Furthermore, these small hydrocarbons (C1 and C2) have been shown to be used in the construction of important aromatic molecules from benzene (Zhou et al. 2010) up to PAHs (Kaiser & Roessler 1997; Jones & Kaiser 2013). Therefore, the investigation and understanding of the chemistry that is available to these small hydrocarbons are necessary to fully realize the formation routes of the hydrocarbons present in both interstellar and planetary ices.
In detail, the irradiation of ethylene ices resulted in the detection of six molecules after FTIR analysis: methane [CH4 (CD4)], acetylene [C2H2 (C2D2)], the ethyl radical [C2H5 (C2D5)], ethane [C2H6 (C2D6)], 1-butene [C4H8 (C4D8)], and n-butane [C4H10 (C4D10)], which agrees with previous FTIR analysis (Zhou et al. 2014). During TPD, which simulates the transition of a cold molecular cloud into a star-forming region, the sensitive PI-ReTOF-MS study was able to detect a much more complex array of product groups: CnH2n+2 (n = 4–10), CnH2n (n = 2–12, 14, 16), CnH2n−2 (n = 3–12, 14, 16), CnH2n−4 (n = 4–12, 14, 16), CnH2n−6 (n = 4–10, 12), CnH2n−8 (n = 6–10), CnH2n−10 (n = 6–10). The detection of these hydrocarbon groups of varying degrees of saturation shows that very complex chemistry is taking place in a relatively simple starting material. There are many individual molecules represented by these groups that hold important astrophysical relevance.
Recently Abplanalp & Kaiser (2016) showed that several of the hydrocarbon groups identified here (CnH2n+2, CnH2n, CnH2n−2, CnH2n−4) were also synthesized in pure ethane irradiated ices and presented details on a few specific molecules within these groups, showing their astrophysical importance. Within the alkane group (CnH2n+2) several experiments investigating the processing of methane ice were also able to detect multiple signals belonging to alkanes from heptane (C7H16) (Jones & Kaiser 2013) to dodecane (C12H26) (Kaiser et al. 1992). Alkanes have also been a common group detected from meteorite analysis (Gelpi & Oró 1970; Sephton et al. 2001). The smallest signal detected belonging to the alkene group (CnH2n) can be assigned to C3H6. The propylene isomer (CH2CHCH3; X1A'), which has been observed in the ISM toward TMC-1 (Marcelino et al. 2007; Rawlings et al. 2013; Zhou et al. 2013), has been shown to react with carbon atoms (C; 3Pj) (Kaiser et al. 1997b) and dicarbon molecules (C2; X1Σg+/a3 ) (Dangi et al. 2013) via crossed molecular beams to form the PAH precursors methylpropargyl radical (C4H5) and 1- and 3-vinylpropargyl, respectively. Meanwhile, its isomer, cyclopropane (c-C3H6), is the simplest of all possible cycloalkanes. Also, alkenes (n = 2–6) have been incorporated into theoretical models in order to better understand Titan's atmosphere (Woon & Park 2009). With respect to the alkyne group (CnH2n−2), the C3H4 isomers methylacetylene (CH3CCH; IE = 10.36 eV), which has been detected by several astronomical surveys toward SgrB2, PKS 1830-211, L1544, and tentatively in NCG 4418 (Belloche et al. 2013; Muller et al. 2014; Vastel et al. 2014; Costagliola et al. 2015), and allene (H2CCCH2; IE = 9.69 eV) have been used to model Titan's atmospheric chemistry (Vakhtin et al. 2001; Goulay et al. 2007; Zhang et al. 2009a). Also, these two isomers have been shown to be very important for interstellar chemistry PAH formation, as they both have been proposed to take part in reactions with the phenyl radical (C6H5) to form indene (C9H8) (Zhang et al. 2011a; Parker et al. 2011, 2015; Yang et al. 2015). Similarly, from this hydrocarbon group the C4H6 isomer 1, 3-butadiene (H2CCHCHCH2) was determined to react with dicarbon (C2), ethynyl radical (CCH), and tolyl radicals (C6H4CH3) in the gas phase to form the important PAH molecules: the phenyl radical (C6H5) (Zhang et al. 2010), benzene (C6H6) (Jones et al. 2011), and 6-methyl-1, 4-dihydronaphthalene (Parker et al. 2014). Our results show that these small hydrocarbons can be produced in ices, and it is possible that after their formation in the ice phase they can sublime from the ice mantle and take part in gas phase reactions that are producing PAH-like molecules. For example, methylacetylene or allene can react with the phenyl radical to produce indene in the gas phase, or 1, 3-butadiene with the tolyl radical to from 6-methyl-1, 4-dihydronaphthalene (Figure 22). Dangi et al. (2014) also revealed that another CnH2n−2 type molecule, isoprene (CH2C(CH3)CHCH2), was a key hydrocarbon in understanding how methyl-substituted PAHs form. In the solid phase it was shown that UV photolysis of 1, 5–hexadiene (C6H10) produced a carbonaceous polymer (Dartois et al. 2005). Next, the CnH2n−4 group contains the interesting vinylacetylene (H2CCHCCH) molecule, which has been studied in relation to hydrocarbons on Titan (Vuitton et al. 2012). Also, vinylacetylene (H2CCHCCH) has been studied in the gas phase reacting with the phenyl radical (C6H5) to produce naphthalene (C10H8) (Parker et al. 2012).

Figure 22. Reaction schematic of allene, methylacetylene, and 1, 3-butadiene, all possible molecules produced from the irradiation of ethylene ice, reacting in the gas phase to produce PAH-related molecules.
Download figure:
Standard image High-resolution image
While all of these very important molecules belong to groups detected from pure ethane or ethylene ice irradiation experiments, the following groups have been determined to belong solely from the processing of ethylene ice and suggest a different type of hydrocarbon chemistry available where this reactant is available. First, the CnH2n−6 group has many very interesting molecules related to it, including diacetylene (C4H2) and benzene (c-C6H6), which have both been identified in Titan's atmosphere (Coustenis et al. 2003, 2007), as well as in other sources (Bézard et al. 2001; Cernicharo et al. 2001b; Burgdorf et al. 2006; Guerlet et al. 2010). Cuylle et al. (2014) showed that the processing of solid acetylene was able to produce diacetylene by UV photolysis, but not able to produce benzene. However, Zhou et al. (2010) determined that the irradiation of acetylene with energetic electrons was able to produce benzene, but not diacetylene. The gas phase reaction of diacetylene with dicarbon was shown to produce the 1, 3, 5-hexatriynyl radical, a PAH precursor (Zhang et al. 2009b). Recently, Sivaraman et al. (2015) showed that the irradiation of propargyl alcohol produced benzene as the major product, which further supports that this molecule can be synthesized in the ice. Also, Jones et al. (2011) showed that benzene is able to be synthesized in the gas phase via the reaction of the ethynyl radical and 1, 3-butadiene. The reactions that benzene can undergo have also been studied in the gas phase with phenyl radicals (C6H5) (Zhang et al. 2008), tricarbon molecules (Gu et al. 2007a), dicarbon (Gu et al. 2007b), and carbon atoms (Bettinger et al. 2000; Kaiser et al. 2003) producing diphenyl (C6H5C6H5), phenyltricarbon (C6H5CCC), phenylethynyl radical (C6H5CC), and 1, 2-didehydrocycloheptatrienyl radical (C7H5), respectively. Another molecule in this group that has been detected in the ISM is methyl diacetylene in TMC-1 (Loren et al. 1984; MacLeod et al. 1984; Walmsley et al. 1984). Gudipati & Yang (2012) showed that hydrocarbons such as toluene (C7H8) undergo hydroxylation when present in astrophysical ice analogs.
In the CnH2n−8 group ortho-benzyne (o-C6H4) was a product of the gas phase reaction of the ethynyl radical with vinylacetylene (Zhang et al. 2011b). Computational studies to determine possible formation pathways of C6H4 isomers from acetylene have also been reported (Bera et al. 2015). Also, the reaction of fulvenallene (C7H6) with the hydroxyl radical (OH) (Thapa et al. 2015) and atomic carbon (da Silva 2014) has been studied to investigate the formation of the fulvenallenyl radical, as it is an important PAH molecule. Another gas phase study reacted ethynyl radicals (C2H) with styrene (C8H8) to study PAH growth mechanisms. In the CnH2n−10 group the 1, 3, 5-hexatriene (C6H2) molecule was detected in CRL 618 (Fonfría et al. 2011), and the methyltriacetylene (C7H4) molecule has been observed toward TMC-1 (Remijan et al. 2006). The previously mentioned computational study of C6H4 isomers also undertook the study of C6H2 isomers that may be formed from acetylene and its fragments (Bera et al. 2015). The aromatization reaction of acetylene over forsterite and olivine samples has been shown to produce triacetylene (C6H2) and phenylacetylene (C8H6) (Tian et al. 2012). Bouwman et al. (2016) recently showed that there is evidence that pentalene (C8H6) may be produced from dissociative ionization of naphthalene.
With the penetration of galactic cosmic rays into Titan's atmosphere, even more complex chemistry can take place with these newly formed hydrocarbons, such as the inclusion of oxygen and possibly producing prebiotic chemicals (Sittler et al. 2009). Several trans-Neptunian objects (TNOs), such as Pluto, can be irradiated with the solar wind (Cravens & Strobel 2015), as well as UV photons (Gladstone et al. 2015), resulting in an average dosage of 22 eV for small hydrocarbons (Hudson et al. 2009). The current experiment supplied a much lower dose to the target ice of about 5 eV and detected a very diverse suite of molecules, which suggests that TNOs containing ethylene can produce similar hydrocarbons. According to the literature, there has only been one attempt to study the chemistry at play and in situ that takes place within ethylene ices, and no additional atoms, utilizing energetic 5 keV electrons to simulate the track of a galactic cosmic ray in ices (Zhou et al. 2014). However, this study relied on the traditional techniques, which were far less sensitive than the current results presented here, and an overall understanding of this small molecule's role in hydrocarbon ices has been lacking until now. Using the traditional methods of FTIR coupled with PI-ReTOF-MS has provided a new insight into the hydrocarbon chemistry available in simple ethylene ices processed by energetic electrons detecting complex hydrocarbons associated with the general formulae CnH2n+2, CnH2n, CnH2n−2, CnH2n−4, CnH2n−6, CnH2n−8, and CnH2n−10. Although no pure ethylene ice has been observed in an extraterrestrial body or in the ISM, the results presented here represent a starting point necessary to understand the full network of chemical reactions available during the chemical evolution of binary or even more complex ices. There are numerous interesting isomers of astrophysical importance, and currently experiments are being designed to untangle which of the C3 and C4 hydrocarbon isomers were produced from processed ethylene ices by utilizing tunable PI-ReTOF-MS (Abplanalp et al. 2015). The detection and nondetection of certain isomers will shed light onto the correctness of proposed reaction mechanisms as well and help lead to a more complete understanding of complex hydrocarbon chemistry of astrophysical relevance.
R.I.K. and M.J.A. thank the US National Science Foundation (AST-1505502) for support to conduct the experiments and data analysis. The experimental setup was financed by the W. M. Keck Foundation through an equipment grant.