


Abstract
We study the evolution of the scaling relations that compare the effective density ( ) and core density (
 kpc) to the stellar masses of star-forming galaxies (SFGs) and quiescent galaxies. These relations have been fully in place since
  and have exhibited almost constant slope and scatter since that time. For SFGs, the zero points in
  and
and  decline by only
  . This fact plus the narrowness of the relations suggests that galaxies could evolve roughly along the scaling relations. Quiescent galaxies follow different scaling relations that are offset to higher densities at the same mass and redshift. Furthermore, the zero point of their core density has declined by only
  since
since  , while the zero point of the effective density declines by
  . When galaxies quench, they move from the star-forming relations to the quiescent relations. This involves an increase in the core and effective densities, which suggests that SFGs could experience a phase of significant core growth relative to the average evolution along the structural relations. The distribution of massive galaxies relative to the SFR–M
 and the quiescent
  relations exhibits an L-shape that is independent of redshift. The knee of this relation consists of a subset of "compact" SFGs that are the most likely precursors of quiescent galaxies forming at later times. The compactness selection threshold in
  exhibits a small variation from z = 3 to 0.5,
  M⊙ kpc−2, allowing the most efficient identification of compact SFGs and quiescent galaxies at every redshift.
Export citation and abstract BibTeX RIS
1. Introduction
Studies of galaxy evolution from the peak of cosmic star formation to the present day have matured tremendously over the past two decades. The advent of large multiwavelength photometric surveys has enabled inferences of the global stellar population properties such as stellar mass, age, and star formation rate (SFR). Large-area surveys such as the Sloan Digital Sky Survey (SDSS), NMBS, zCOSMOS, UltraVISTA, and zFOURGE have robustly established the shape and evolution of the mass function of star-forming galaxies (SFGs) and quiescent galaxies since  , cementing our understanding of galaxy build up and shutdown (Peng et al. 2010; Brammer et al. 2011; Ilbert et al. 2013; Muzzin et al. 2013; Woo et al. 2013; Straatman et al. 2014; Tomczak et al. 2014). Furthermore, the sensitivity and high spatial resolution of the Hubble Space Telescope (HST) have extended those mass functions further back in cosmic time (Bouwens et al. 2010; Finkelstein et al. 2015; Oesch et al. 2014), and have made a pivotal contribution to the study of galaxy sizes and morphologies (e.g., van der Wel et al. 2012; Shibuya et al. 2015). Deep multiband surveys with HST, such as GOODS (Giavalisco et al. 2004) and CANDELS (Grogin et al. 2011; Koekemoer et al. 2011), have thus provided an exquisite data set to quantify the simultaneous evolution of the galaxy stellar populations and structural properties across cosmic time.
The consensus is that strong correlations between structure and stellar populations (i.e., a Hubble sequence) exist up to z = 4 (Franx et al. 2008; Kriek et al. 2009a; Wuyts et al. 2011a). One such relation is the SFR–main sequence (SFR–MS; Elbaz et al. 2007, 2011; Noeske et al. 2007; Salim et al. 2007; Pannella et al. 2009, 2015; Magdis et al. 2010; Rodighiero et al. 2010; Wuyts et al. 2011a; Whitaker et al. 2012; Tomczak et al. 2016), which is thought to describe a relatively smooth mode of galaxy growth (Elbaz et al. 2007; Rodighiero et al. 2010) in which gas inflow and SFR have reached a steady-state phase (e.g., Dekel et al. 2013). SFGs on the SFR–MS typically have larger sizes and exponential disk profiles, while quiescent galaxies of the same mass have more concentrated mass profiles (higher Sérsic indices) and smaller sizes. A dichotomy is also present in the size–mass relations, where quiescent galaxies exhibit a much steeper slope than SFGs and a lower normalization, i.e., higher densities (Williams et al. 2010; Newman et al. 2012; van der Wel et al. 2014; Shibuya et al. 2015). Although both the SFR–MS and the size–mass scaling relations evolve with time, the fundamental structural differences in SFGs and quiescent galaxies are always present, suggesting that having concentrated (denser) surface density profiles is a requisite for quenching (Kauffmann et al. 2003, 2006; Schiminovich et al. 2007; Bell 2008; Cheung et al. 2012; Fang et al. 2013; Lang et al. 2014; van Dokkum et al. 2014; Abramson et al. 2016; Margalef-Bentabol et al. 2016; Whitaker et al. 2017). In other words, SFGs must grow dense cores before quenching.
There is increasing observational evidence that SFGs with dense cores exist at every redshift. At  , SFGs with the highest central densities are remarkably compact and have high Sérsic indices and spheroidal morphologies, lacking any signature of an underlying disk (Wuyts et al. 2011b; Barro et al. 2013, 2014a, 2014b; Patel et al. 2013; Stefanon et al. 2013; Nelson et al. 2014; Williams et al. 2014). These galaxies resemble the quiescent population at the same redshift but are radically different from other SFGs that have irregular and clumpy appearances (Elmegreen et al. 2004; Genzel et al. 2008; Guo et al. 2015). This suggests that compact SFGs are formed by strongly dissipational processes. Some of these processes, like mergers and disk instabilities, are indeed expected to be more frequent at earlier times due to the higher gas-to-total mass ratios in SFGs (Daddi et al. 2010; Tacconi et al. 2010, 2013). The increased gas mass relative to the SFR makes such systems prone to gravitational collapse on scales of ∼1 kpc, causing substantial core growth resulting from a gas-fed central starburst and/or an inward migration of clumps (Dekel et al. 2009b; Ceverino et al. 2010, 2015; Genel et al. 2014; Wellons et al. 2015, 2016; Zolotov et al. 2015; Bournaud 2016; Tacchella et al. 2016). At lower redshifts, SFGs with dense cores have clearly recognizable disk structures, but their profiles are dominated by a central bulge (Bruce et al. 2012, 2014a; Wuyts et al. 2012; Mortlock et al. 2013; Lang et al. 2014; Morishita et al. 2015; Abramson et al. 2016; Margalef-Bentabol et al. 2016; Schreiber et al. 2016). Interestingly, quiescent galaxies at low z also seem to have bulge+disk morphologies (McGrath et al. 2008; Bundy et al. 2010; van der Wel et al. 2011; Chang et al. 2013; Dullo & Graham 2013), suggesting that quenching takes place among galaxies with similar morphologies.
A common feature in the evolution of massive galaxies described above is the growth of a dense core. This suggests that it is possible to describe the general processes of structural growth and star formation quenching using a unique quantity tracing the central stellar mass density. Here we study the evolution since  of the stellar mass surface density within a radius of 1 kpc,
  . We build upon previous results at lower redshift, which show that
  is closely related with quiescence and follows a much tighter correlation with stellar mass than the effective radius or the effective surface density,
  (e.g., Cheung et al. 2012; Fang et al. 2013; van Dokkum et al. 2014; Tacchella et al. 2015; Woo et al. 2015; Whitaker et al. 2017). We aim to answer whether this relation holds at high redshift, if it is a more fundamental quenching predictor, and if the global build up and quenching of SFGs can be described in simple terms using
  , i.e., if it can be used to track galaxies in transit from the star-forming to the quiescent phase.
This paper is structured as follows. Section 2 gives an overview of the observational data set and associated galaxy properties. Section 3.1 presents the observed correlations in the effective and central mass surface densities versus stellar mass for SFGs and quiescent galaxies from  . Section 3.2 (and Appendix
  and
and  relate to each other for galaxies with known Sérsic mass profiles. Section 3.3 discusses the evolution of the zero point of the quiescent relations in the context of various evolutionary processes. Section 4 compares galaxy evolutionary paths from recent hydrodynamical models to the observed best-fit
  and
and  relations. Section 5.1 studies the relative distribution of massive galaxies from the SFR–MS and the quiescent structural relations as a function of redshift. Section 5.2 analyzes this distribution to identify SFGs with structural properties similar to quiescent galaxies at every redshift. Section 5.3 studies the relative evolution in the number density of quiescent galaxies and their likely star-forming progenitors. Lastly, Section 5.4 illustrates the evolution in the structural properties and visual morphologies of galaxies within the evolutionary sequences introduced in Section 4 and Section 5.1.
Throughout this paper, we quote magnitudes in the AB system, assume a (Chabrier 2003) initial mass function (IMF), and adopt the following cosmological parameters: ( ,
,  , h) = (0.3, 0.7, 0.7).
2. Data
2.1. Ancillary Data and Value-added Properties
This paper is based on a sample of massive galaxies built from the HST/WFC3 F160W selected catalog for the CANDELS GOODS-S field (Guo et al. 2013). The multiwavelength catalog includes photometry in 14 passbands ranging from U to 8 μm, with seven high-resolution bands from HST/ACS and WFC3 (B435, V606, i775, z850, YJH) and the deepest Spitzer/IRAC data from SEDS (Ashby et al. 2013). The merging with lower resolution data (ground-based and Spitzer/IRAC) was computed using TFIT (Laidler et al. 2006). A comprehensive overview of this catalog can be found in Guo et al. (2013; see also Galametz et al. 2013 for more details). We use the official CANDELS photometric redshifts in the GOODS-S field presented in Dahlen et al. (2013). Briefly, these photometric redshifts are based on a hierarchical Bayesian approach that combines the full probability distribution functions (PDF(z)) derived by six CANDELS photo-z investigators using a variety of codes and modeling assumptions. The average accuracy of the merged PDF(z) yielded errors of  %.
%.
The stellar masses for all galaxies are drawn from the catalog of Santini et al. (2015). Similarly to the team effort aimed at computing accurate photometric redshifts, Santini et al. (2015) presented an analysis of the stellar masses of the CANDELS GOODS-S galaxies based on the estimates of 10 different investigators, who computed the stellar masses using the same photometry and redshifts described above, but with different codes, priors, and parameter grids. Overall, the results from the various teams are in good agreement despite these differences (see also Mobasher et al. 2015 for additional tests). Only a small fraction of the lowest-mass ( ) galaxies, which are not the focus of this work, exhibit significant differences (
 dex) when emission lines are included in the stellar population fitting templates. Santini et al. (2015) combined all mass estimates using the same stellar templates and IMF by means of the Hodges–Lehmann estimator and computed the standard deviation of the methods as a first-order estimate of the systematic uncertainties. Here we choose to use the results of one of the methods to have a uniform set of modeling assumptions based on one of the most commonly used values in the literature. We adopt the stellar masses from method-2τ using FAST (Kriek et al. 2009b) and based on a grid of Bruzual & Charlot (2003) models that assume a Chabrier (2003) IMF, solar metallicity, exponentially declining star formation histories, and the Calzetti et al. (2000) dust extinction law.
In addition to the optical/NIR SEDs, we also include complementary mid-IR photometry in Spitzer/MIPS 24 and 70 μm (30 μJy and 1 mJy,  ) from Pérez-González et al. (2008b) and far-IR photometry from the GOODS-Herschel (Elbaz et al. 2011) and PEP (Magnelli et al. 2013) surveys, including PACS—100 and 160 μm, and SPIRE—250, 350, and 500 μm. A description of the method used to derive consistent mid-to-far-IR SEDs is presented in Pérez-González et al. (2008a, 2010; see also Domínguez Sánchez et al. 2016). Based on these IR fluxes, we compute SFRs on a galaxy-by-galaxy basis using a ladder of SFR indicators as described in Wuyts et al. (2011a). The method essentially relies on IR-based SFR estimates for galaxies detected at mid- to far-IR wavelengths, and SED-modeled SFRs for the rest. As shown in Wuyts et al. (2011a), the agreement between the two estimates for galaxies with a moderate extinction (faint IR fluxes) ensures continuity between the different SFR estimates. For IR-detected galaxies, the total SFRs,
  , were then computed from a combination of IR and rest-frame UV luminosities (uncorrected for extinction; Kennicutt 1998 and Bell et al. 2005) and adopting a Chabrier (2003) IMF (see Barro et al. 2011 for more details),
  . Total IR luminosities (
 [8–1000 μm]) were derived from Chary & Elbaz (2001) templates fitting MIPS 24 μm fluxes, applying a Herschel-based recalibration (Elbaz et al. 2011), and L2800 is estimated from the best-fitting SED template. For galaxies undetected by MIPS below a 2σ level (20 μJy), SFRs come from rest-frame UV luminosities that are corrected for extinction as derived from SED fits (Wuyts et al. 2011a).
The half-light radii ( ), measured along the major axis, and Sèrsic indices (n) were determined from HST/WFC3 H images using GALFIT (Peng et al. 2002), with PSFs created and processed to replicate the conditions of the observed data (van der Wel et al. 2012). Using a full battery of tests and simulations, van der Wel et al. (2012, 2014) showed that these fits are stable even for the smallest galaxies with
  at
at  . Generally, the total uncertainties in n and
  are smaller than
  % for galaxies brighter that
  mag.
mag.
The stellar mass profiles were computed by fitting multiband SEDs derived from surface brightness profiles in nine HST bands measured with IRAF/ellipse (see Liu et al. 2013 and F. Liu et al. 2017, in preparation for more details). Following Wuyts et al. (2012), we impose an additional constraint on the spatially resolved SED fit by requiring that the integrated profile match the observed flux in IRAC ch1 and ch2. We apply this constraint by assuming that the integrated IRAC-F160W color is the same at all radii.
The multiband HST mosaics were PSF-matched to the resolution of F160W, which has a half width at half maximum of HWHM = 0 09. The profiles have an intrinsic spatial resolution ranging from
  within the redshift range of the sample and thus resolve the inner 1 kpc of the galaxies. However, part of the light can be smeared to larger radius. To correct for this effect, we estimate a Sérsic and size-dependent correction to the mass profile within 1 kpc (see Appendix
  and
and  degraded to F160W resolution at a different redshift. The correction ranges from ∼0.4 dex at
  to
to  dex at
  . We note that we do not measure the (deprojected) mass in the central regions directly, but use the best-fitting Sérsic profiles as a proxy to estimate the mass at r < 1 kpc. We also note that we use integrated SFR measurements, which do not allow us to account for the spatial distribution of star formation. Therefore, the galaxy classifications of either star forming or quiescent galaxy are based on their overall SFR properties, i.e., we do not explicitly distinguish galaxies with quiescent centers and star-forming disks.
2.2. Galaxy Sample
Our goal is to analyze the distribution of SFGs and quiescent galaxies at  in the structural scaling relations in order to understand their differential evolution. Owing to the depth of the CANDELS imaging data in GOODS-S (
 mag; 5σ), the galaxy sample is remarkably complete up the highest redshifts (
 ; e.g., Guo et al. 2013; Grazian et al. 2015), and the quality of the HST-based SEDs ensures very accurate SED modeling to effectively distinguish between SFGs and quiescent galaxies even beyond a redshift of z = 3 (e.g., Nayyeri et al. 2014; Straatman et al. 2014). Nonetheless, our analysis requires not only robust multiband detections, but also precise morphological measurements. Therefore, we apply additional constraints to ensure that the galaxy sizes and surface brightness profiles are reliably measured. As discussed in van der Wel et al. (2012, 2014), a redshift-dependent mass threshold of
  and
and  for SFGs and quiescent galaxies at
  ensures that these galaxies are brighter than H = 24.5 mag, and thus their morphological properties can be recovered with uncertainties smaller than
  %.
%.
In the following section, we will adopt fixed thresholds of  and
and  for SFGs and quiescent galaxies, respectively. These limits provide a compromise between having a wide enough dynamic range in stellar mass to allow a representative fitting of the structural scaling relations of both populations, while having a high signal-to-noise ratio in the morphological measurements for the majority of galaxies. At our highest redshift bin,
  , some of the lowest-mass quiescent galaxies are slightly fainter than the limit of van der Wel et al. (2014), and thus exhibit larger uncertainties. Nonetheless, we note that they are still clearly detected as they are 1.5 mag brighter than the 5σ detection limit. Furthermore, as shown in the following section, the quiescent sample at this redshift is relatively small, and therefore we fit the quiescent scaling relation by fixing the slope to the value of the previous redshift bin. In Section 5, we adopt a more conservative mass limit of
  for both populations as the focus of the discussion is centered on the transition of massive galaxies from star forming to quiescent. This limit is consistent with the mass completeness estimates for red quiescent galaxies of previous works based on a similar photometry (e.g., Tal et al. 2014).
Following van der Wel et al. (2014), we draw our primary sample from the parent CANDELS catalog including all galaxies with  mag and a minimum stellar mass of
  . Then, we apply the redshift- and SFR-dependent mass limits described above in the analyses in the following sections. We exclude from the sample those galaxies with bad photometric flags (e.g., galaxies near defects, bright spikes, or sources classified as stars), or with catastrophic failures in the surface brightness profile fits. Hence, we have a final sample of 4958 galaxies at
  .
.
3. Results
3.1. SFR and the Structural Scaling Relations
Since a major point of this paper is to compare the scaling relations for SFGs versus quiescent galaxies, we start by dividing the sample into these two categories using the distribution of SFR versus stellar mass for the galaxies in GOODS-S. The results are shown versus redshift in Figure 1, which shows SFR versus stellar mass. The majority of SFGs follow a relatively tight relation between SFR and stellar mass. The observed relation suggests that galaxy star formation histories are predominantly regular and smooth, i.e., galaxies grow in a secular mode, which is usually referred to as the SFR–MS (Elbaz et al. 2007, 2011; Noeske et al. 2007; Salim et al. 2007; Pannella et al. 2009, 2015; Magdis et al. 2010; Rodighiero et al. 2010; Wuyts et al. 2011a; Whitaker et al. 2012). Following previous works, we characterize the SFR–MS as a single power law at  :
:

The power law was fit iteratively while removing galaxies that are more than 0.7 dex below the line. Note that at lower masses, the SFR–MS exhibits a steeper slope (e.g., Whitaker et al. 2014; Schreiber et al. 2015). The resulting best-fit SFR–MS at every redshift is in excellent agreement with the results of Whitaker et al. (2014) and Schreiber et al. (2015) at the high-mass end. The slope and the zero point are consistent with their values within the errors (Table 1). We select SFGs and quiescent galaxies above and below a threshold of  dex (dashed red line), respectively, where
  . This classification line is
  below the SFR–MS, which has a typical observational scatter of 0.3 dex (Speagle et al. 2014; Whitaker et al. 2014; Schreiber et al. 2015). Appendix
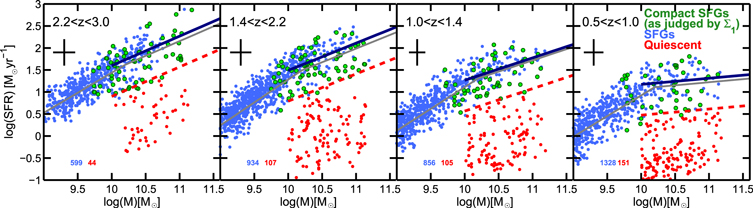
Figure 1. Star formation rate vs. stellar mass for galaxies in the CANDELS/GOODS-S field at  . The dark blue lines show our fits to the upper SFR–MS at each redshift (blue and green points), which agree with previous results above
  . The gray lines show the results of Whitaker et al. (2013), which highlight the change in the slope of the SFR–MS at lower masses. The green and blue points show compact and non-compact (i.e., normal) SFGs, respectively. Quiescent galaxies (red points) are selected to lie 0.7 dex below the SFR–MS, i.e., below the red dashed lines (see Appendix
  relation for quiescent galaxies (see Figure 2(b)).
Download figure:
Standard image High-resolution image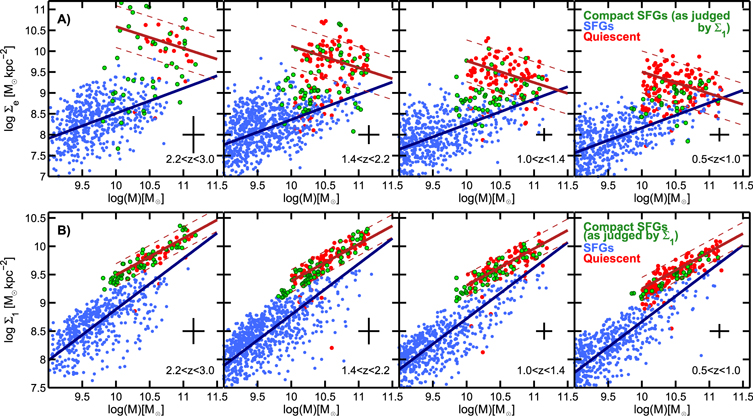
Figure 2. Surface density vs. stellar mass for galaxies in the CANDELS/GOODS-S field at  . Panels A and B show the surface density within the effective radius,
  , and within the inner 1 kpc,
  , respectively. The typical uncertainties in the stellar mass and stellar densities are indicated in the bottom-right corner. The blue+green and red circles show SFGs and quiescent galaxies selected using the SFR criterion of Figure 1. The thick blue and red lines depict the best-fit
  relations for the two populations. The dashed red lines show the 2σ scatter around the quiescent relation. SFGs and quiescent galaxies exhibit clear and distinct scaling relations since
  , which are well-described by single power laws. Fit parameters are given in Table 1. The scatter in the
  relations is a factor of ∼2 smaller than that of
  . The slopes of all four scaling relations remain approximately constant with time. The zero points of the star-forming relations decline slowly with time (see Figure 4). At
  we find an increasing number of "compact" SFGs with high surface densities, similar to those of quiescent galaxies. These are the green circles, which are selected to lie within the scatter of the quiescent
  relation defined by the red dashed lines (see Section 5 for a detailed discussion on compact SFGs).
Download figure:
Standard image High-resolution imageTable 1. Power-law Fits
 –SFGs –SFGs |
 –Quiescent –Quiescent |
 –SFGs –SFGs |
 –Quiescent –Quiescent |
 –SFGs –SFGs |
||||||
|---|---|---|---|---|---|---|---|---|---|---|
| Redshift Range | μ |

|

|
log A
|

|
log A
|

|
log B
|

|
log B
|

|
0.19 ± 0.08 | 1.21 ± 0.02 | −0.42 ± 0.13 | 9.19 ± 0.06 | 0.60 ± 0.04 | 8.46 ± 0.04 | 0.65 ± 0.03 | 9.53 ± 0.05 | 0.89 ± 0.03 | 9.12 ± 0.03 |

|
0.53 ± 0.07 | 1.44 ± 0.04 | −0.45 ± 0.14 | 9.53 ± 0.05 | 0.60 ± 0.05 | 8.54 ± 0.05 | 0.65 ± 0.04 | 9.64 ± 0.04 | 0.88 ± 0.03 | 9.16 ± 0.04 |

|
0.64 ± 0.06 | 1.75 ± 0.05 | −0.52 ± 0.14 | 9.91 ± 0.07 | 0.64 ± 0.05 | 8.68 ± 0.04 | 0.64 ± 0.03 | 9.74 ± 0.05 | 0.86 ± 0.04 | 9.25 ± 0.03 |

|
0.68 ± 0.06 | 1.92 ± 0.05 | −0.52 | 10.28 ± 0.05 | 0.56 ± 0.06 | 8.80 ± 0.04 | 0.67 ± 0.04 | 9.80 ± 0.05 | 0.89 ± 0.04 | 9.33 ± 0.05 |
Note. Power-law coefficients parameterizing the evolution of the SFR (log SFR  ), the effective mass surface density (log
  ), and the mass surface density within the central 1 kpc (
 ) relations with stellar mass as a function of redshift.
Download table as: ASCIITypeset image
We turn now to the density scaling relations that are the main focus of this paper. The top row (A panels) of Figure 2 shows the distribution in effective surface mass density,  , versus mass for the galaxies in Figure 1. The points are color-coded as in Figure 1. The error bars indicate the typical uncertainty for galaxies at the median stellar mass computed by bootstrapping on the observational errors in stellar mass and effective radii, and propagating those uncertainties to
  . SFGs (blue and green) and quiescent galaxies (red) follow well-defined size–mass relations, which are characterized by log-linear relations,
  (e.g., Law et al. 2012; Mosleh et al. 2012; Newman et al. 2012; Szomoru et al. 2012; van der Wel et al. 2014). Both relations can be expressed in terms of
  :
:
where α is related to the slope of the size–mass relation a as  . The red and blue lines in Figure 2(A) show the best-fit
  relations for quiescent galaxies and SFGs, and Table 1 gives the slopes and zero points. The best-fit slopes are relatively constant with time,
  ,
,  , and agree well with the results of van der Wel et al. (2014) for the
  relations of both populations (
 and
and  ). There are too few quiescent galaxies at
  to accurately fit the slope, and so we fix the slope (but not the zero point) in this bin to match the value at
  . Note that quiescent galaxies have a steep slope in the
  relation, which leads to an anti-correlation in
  . This is consistent with the observed trend for the most massive quiescent galaxies at low z (e.g., Graham & Guzmán 2003; Ferrarese et al. 2006; Kormendy et al. 2009). Meanwhile, SFGs have a shallow slope in
  (
( ) and a positive correlation between
  and mass. The scatter in
  is consistent with ∼2× that of the size–mass relations,
  dex and 0.3 dex, for SFGs and quiescent galaxies, as expected from
  . The redshift-dependent zero points decline from z = 3 to z = 0.5. Such a decline is much steeper for quiescent galaxies than for SFGs (1 dex versus 0.3 dex), as noted in previous works (Buitrago et al. 2008; Newman et al. 2012; van der Wel et al. 2014).
The bottom row (B panels) of Figure 2 shows the redshift evolution of the central surface mass density within 1 kpc,  , versus the stellar mass. The error bars indicate the typical uncertainty for galaxies at the median stellar mass computed by bootstrapping on the observational errors in stellar mass, effective radii, and Sérsic index, and propagating those uncertainties to
  . Similarly to
  , we characterize the observed correlation in
  as a log-linear relation:
Again, we find clear correlations for both SFGs and quiescent galaxies at every redshift since  . The slopes of each of these relations (see Table 1) are positive and relatively constant with time,
  and
and  . By comparison with
  , the dispersion is
  tighter,
  dex and 0.14 dex for SFGs and quiescent galaxies, respectively. The zero point of the star-forming
  relation declines by ∼0.3 dex from z = 3 to z = 0.5, similar to the evolution in
  . Interestingly, for quiescent galaxies,
  declines by a similar amount, in stark contrast to the strong decline of ∼1 dex in
  .
.
A summary of the main conclusions from Figure 2 is as follows.
- (1)Since
 is based on re and M⋆, the nature and evolution of the relations in panel A can be inferred from the corresponding relations, which have been known for some time (e.g., Newman et al. 2012; van der Wel et al. 2014). In particular, the large scatter of both relations, the offset of quiescent galaxies to higher densities, the constancy of the slopes versus time, and the diminishing difference between quiescent galaxies and SFGs—all of these properties are implied by the relations.
 - (2)The general distribution of points in the relations in panel B is essentially identical to the distribution of points found by Fang et al. (2013) for SDSS galaxies at . Moreover, the ridge line of Fang's quiescent galaxies has the same slope here, and the Fang zero point is a smooth extrapolation from higher redshifts. This suggests that the relations were already fully in place at z = 3 and, except for modest declines in zero points, have remained essentially constant down to the present day.
- (3)If a scaling relation versus mass is narrow and if galaxies have increased their masses greatly during the time over which the relation is seen to exist, then one can make the case that the objects that populate the relation could evolve roughly along it. This could be the case for the progenitors of massive galaxies at) that grew in total mass by a significant amount since .There are several methods to estimate such growth, which yield slightly different results but similar orders of magnitude (e.g., van Dokkum et al. 2010; Behroozi et al. 2013; Moster et al. 2013; Patel et al. 2013; Marchesini et al. 2014). For example, the predictions from abundance-matching techniques imply growth rates of 0.75 dex to 1.5 dex for descendants with masses ranging from to 10.75, respectively (see e.g., Figure 4 of Papovich et al. 2015). Here we adopt mass growth by a factor of 20 to follow the growth of a population of SFGs that probe a significant fraction of the parameter space in the structural relations.An evolutionary vector of length ×20 (1.3 dex) in mass is large compared to either the scatter about the star-forming relation (∼0.35 dex), or the evolutionary change in the zero point of 0.3 dex from z = 3–0.5 (Table 1). Thus, we argue that the relation could be an approximate evolutionary track. The scatter in is twice as large as that in but is nevertheless still small compared to a ×20 growth in mass. Hence, it is reasonable to infer that the relation could also be an evolutionary track, with the average galaxy moving close to the slope of the best-fit line, (also ). A similar evolutionary picture was suggested by van Dokkum et al. (2015) with (also see Rodriguez-Puebla et al. 2017). The possible evolutionary paths of SFGs are discussed further in Section 4.
- (4)An implication of the possible evolutionary track in is that galaxies build up their central stellar mass densities monotonically in a smooth and regular way (averaged over time) as long as they continue to form stars. This places a constraint on galaxy mass assembly models, including the popular "inside-out" growth scenario for disk formation (e.g., Nelson et al. 2016) and suggests that galaxies did not form their core completely first and then the remainder of the galaxy formed around it.
- (5)The clustering of virtually all quiescent galaxies on the quiescent relation (red points) implies that forming a dense core within 1 kpc is a prerequisite to quenching, as argued in previous works (Cheung et al. 2012; Fang et al. 2013; van Dokkum et al. 2014). At the same time, some SFGs are also found on the quiescent relation (green points), which indicates that a dense core is a necessary but not sufficient condition for quenching. We discuss these galaxies further in Section 5.2.
- (6)The relation implies that the quiescent threshold in is not fixed but increases with stellar mass. Previous works advanced a slightly different view in which quenching occurs when galaxies pass over a fixed threshold in effective (i.e., global) velocity dispersion that varies with redshift but not with mass (e.g., Franx et al. 2008; Wake et al. 2012; van Dokkum et al. 2015). Figure 2 indicates that the accuracy of a threshold in or depends on the slope of the quiescent correlation with stellar mass, being more effective for weak correlations—when the slope is close to zero. Thus, a threshold in or σ (e.g., Belli et al. 2014) is more effective than a threshold in due to their shallower slope (assuming ; Fang et al. 2013). Nonetheless, the most reliable indicator would be the distance to the quiescent relation itself. We discuss this topic further in Section 5.1.


3.2. Surface Mass Profiles: Relating and as a Function of the Sérsic Index


The preceding section derived scaling relations for both  and
and  . This section takes a short detour to consider the relationship between these two scaling relations, specifically whether one can be derived from the other simply from the known shapes of galaxy surface brightness profiles. Galaxy surface brightness and stellar mass profiles are typically described by Sérsic (1963) profiles, in which case, the central and effective densities are related to one another by the profile parameters. Assuming the following characterization of the mass profile:

where n is the Sérsic index and Me is the effective mass at re,  and
and  can be determined from one of them for a given value of n and re. Note that in doing so we assume that the mass and light profiles are the same,
  , a reasonable assumption for quiescent galaxies, which exhibit only weak color gradients (e.g., Guo et al. 2012; Szomoru et al. 2012; Wuyts et al. 2012).
By integrating Equation (4) to r = 1 kpc, we obtain a relation for  as a function of re (or
  ) and M⋆:

This can be expanded in terms of the log-linear size–mass and  relations to calculate the slope and scatter of the
  relation [β,
 ![$\sigma (\mathrm{log}{{\rm{\Sigma }}}_{1})]$](https://content.cld.iop.org/journals/0004-637X/840/1/47/revision1/apjaa6b05ieqn171.gif) in terms of the slope and scatter of the other two ([a,
in terms of the slope and scatter of the other two ([a, ![$\sigma (\mathrm{log}{r}_{{\rm{e}}})]$](https://content.cld.iop.org/journals/0004-637X/840/1/47/revision1/apjaa6b05ieqn172.gif) and [α,
and [α,  ]). We find:
where  , and c1 is the linear coefficient of the re polynomial expansion of the incomplete
  function (see Appendix
  and
and  relations are not independent and can be derived from one another (see also Saracco et al. 2012). In other words, the mapping of
  into
into  (and vice versa) depends on the Sérsic profile.
Figure 3 illustrates this idea by showing the same panels as Figure 2 but overplotting the predicted  relations for SFGs and quiescent galaxies (left panel) based on the best-fit
  relations and vice versa (right panel). For example, the red line in the left panel represents the value of
  predicted from the mean
  relation for quiescent galaxies in Figure 2 using the transformation relations described in Appendix
  relation for SFGs with n = 1.5, which also exhibits a good agreement with n = 1.5 galaxies.

Figure 3.
 (left) and
  (right) vs. stellar mass for SFGs at
  , color-coded by median Sérsic index. The dashed gray lines indicate the typical scatter of the quiescent relations at z = 2 depicted in Figure 2. The SFGs in the overlapping region with the quiescent
  relation exhibit higher Sérsic indices than SFGs that are farther from the quiescent relation. This is as expected if these objects have evolved almost to the quenched state and have light (and mass) profiles that are nearly identical to those of fully quenched galaxies (see text for further remarks). The purple line on the right panel indicates the physical upper limit to
  ; above this,
  , which is impossible. The red lines show the
  relation inferred from the observed
  relation in the right panel (left panel), and vice versa (right panel). The inferred relations are determined using Equations (10) and (11) (see Appendix
  relations derived from
  assuming n = 1.5 (left panel) and vice versa. Qualitatively, the predicted relations trace the locus of the observed galaxy distributions, and also match relatively well the linear slopes. This indicates that the
  and
and  relations are not independent but can be derived from one another assuming the appropriate Sérsic profile. Note that the asymptotic behavior of the red line prediction in
  is because the
  relation approaches the unphysical regime at
  .
.
Download figure:
Standard image High-resolution imageAs indicated by Equation (6), the relation between the scatter in  and
and  depends on the Sérsic index. Quiescent galaxies typically have high Sérsic values,
  (Williams et al. 2010; Bell et al. 2012). For a value of n = 4, the linear coefficient is
  (see Figure 11), which gives
  ). This result indicates that the smaller scatter in
  with respect to
  is a direct consequence of the smaller dynamical range in 1 kpc values for a given Sérsic profile (the same point was made by Saracco et al. 2012). Furthermore, the linear approximations in Equation (6) also show that, given the observed slope of the quiescent
  relation,
  , the expected slope of the
  relation is
  , which is broadly consistent with the best-fit value. Note that when using the second-order polynomial expansions of Equations (10) and (11) instead of the linear approximation, the mapping of the
  relations is not linear in
  and vice versa (red lines in Figure 3). Nevertheless, this comparison shows that, to first order, the similarities and differences between the
  and
and  relations for quiescent galaxies can be explained under the assumption of a single Sérsic profile with high values of
  .
.
SFGs, on the other hand, exhibit a broad range in Sérsic values. This is illustrated in Figure 3, which, as mentioned above, repeats Figure 2 for galaxies in the redshift range  , but now for SFGs only and with pixels color-coded by median Sérsic values. Sérsic values of SFGs vary all the way from n = 0 to n = 4. At a given stellar mass, the Sérsic index increases with
  , i.e., the spread in the
  distribution for SFGs reflects differences in their effective (i.e., global) structure and the same is also true of
  . This trend has two interpretations. One is that as SFGs grow a dense core, their global mass profiles become more centrally concentrated. A second interpretation is that the trend is primarily driven by disk fading, whereby star formation in the disk fades, causing re to shrink and the Sérsic value to increase. Regardless of interpretation, we note that SFGs in the overlapping regions with the quiescent Σ relations (dashed gray lines) have Sérsic values that are very similar to quiescent galaxies, implying that SFGs in that region are structurally very close to being quiescent.
To summarize this section, we have shown that the two sets of scaling relations in  and
and  are closely equivalent, given the known variation of the Sérsic index with the star formation level. We derived equations that relate the slope and the scatter of each relation with one another. In the next section, we will use these relations to compare the predictions of different evolutionary channels for quiescent galaxies.
3.3. Redshift Evolution of the Zero Points of the Quiescent Structural Relations
As shown in Section 3.1, the zero points of the density–mass relations for SFGs and quiescent galaxies decline with time while their slopes remain approximately constant. These properties of the scaling relations constrain the possible structural evolutionary mechanisms for both populations. The present section focuses on quiescent galaxies, which evolve only as a result of non-star-forming mechanisms. SFGs have an evolutionary channel that is primarily fueled by in situ star formation; this is discussed with the help of models in Section 4. Here, we analyze some of the most common mechanisms proposed to explain the structural evolution of quiescent galaxies (e.g., mergers or adiabatic expansion) to study whether they can explain the observed decline in the zero point of the structural scaling relations at constant slope.
We quantify the change in the zero point of the  and
and  relations by integrating Equation (4) and using the relation between
  and re (see Appendix
  . Note that assumption (1) does not imply that the profiles of quiescent galaxies remain unchanged by the evolutionary mechanisms, but rather that the central part (which dominates the Sérsic profile) remains approximately constant. With these assumptions, the zero points of
  (
( ) and
) and  (
( ) change as
  , which leads to


Equations (7) and (8) can now be used to test whether the proposed evolutionary processes for quiescent galaxies are consistent with the observed evolution in the zero points of their structural relations (Table 1). Figure 4 summarizes visually this evolution and shows the best fits to power laws that characterize their redshift dependence ( ,
,  ). For quiescent galaxies, where the relative evolution in the zero points of
  versus
  is large, there are three main evolutionary channels that can explain this difference. (1) The leading explanation is that quiescent galaxies experience a large increase in effective radius compared to mass due to dry minor mergers (i.e., accretion of smaller satellite galaxies; Bezanson et al. 2009; Hopkins et al. 2009; Naab et al. 2009; van Dokkum et al. 2010, 2014; Oser et al. 2012). (2) Part of the increase in the overall radius can also be caused by additional processes, such as stellar mass loss associated with passive evolution (i.e., death of old stars), which causes adiabatic expansion (Damjanov et al. 2011; Poggianti et al. 2013; Porter et al. 2014; van Dokkum et al. 2014). (3) Lastly, the strong decline in
  could also be caused by the arrival of new quiescent galaxies with progressively larger effective radii at lower redshifts (e.g., Carollo et al. 2013; Poggianti et al. 2013; Porter et al. 2014). Each of these scenarios leads to a different evolution in the zero points of
  and
and  , and thus we can test whether any of them matches the observed evolution in the ratio of zero points. Based on the best fits to the redshift evolution of log AQ and log BQ shown in Figure 4, any evolutionary process must verify that the ratio of change is
  /
/ .
.

Figure 4. Redshift evolution in the zero point of the  (stars;
  ) and
) and  (circles;
  ) relations for SFGs (blue) and quiescent galaxies (red). The plotted values are taken from Table 1. The dashed and solid lines show the best-fit relations to the zero points in
  and
and  as a function of redshift. The dashed–dotted gray line shows the predicted evolution in
  due to minor mergers, assuming that
  evolves only due to mass growth outside 1 kpc. The dashed–dotted black line shows the predicted evolution in
  assuming that
  evolves only due to mass loss and consequent adiabatic expansion.
Download figure:
Standard image High-resolution imageIn the first scenario, the evolution of quiescent galaxies is driven by minor mergers, and the expectation is that the core mass remains relatively unchanged (e.g., Naab et al. 2009; Oser et al. 2012). In such a case, instead of Equation (7), the zero point in  changes simply due to the total mass growth as
  (i.e., Δ
 = 0), while the zero point in
  follows Equation (7) as
  , for a conservative value of
  (e.g., Newman et al. 2012). The predicted relative change is then
  /
/ . This is substantially smaller than the ratio of the observed evolution trends in Figure 4, which, as we have noted above, is closer to 4. This shortfall is illustrated by the gray dotted model curve labeled "minor mergers" in Figure 4, which shows the predicted trend in effective density due to mergers, assuming that the slope of the observed decline in the zero point of
  is multiplied by 2.6. This curve falls far short of matching the steep slope of the observed effective density curve, shown as the heavy red line. This tension can be partially alleviated if mergers cause a larger size growth (
 ) or if they also cause an increase in
  , e.g., due to projection effects in the 2D surface density. The latter, however, is inconsistent with the results of van Dokkum et al. (2014), who showed that the 3D mass density within 1 kpc tends to decline with time, at least for massive quiescent galaxies.
The second evolutionary scenario, which also preserves the shape (Sérsic index) of the mass profile, is adiabatic expansion. Quiescent galaxies must puff up due to a decline in the gravitational potential caused by the death of old stars that ejects gas outside the galaxy. For a value of  in this case (e.g., Damjanov et al. 2009), Equation (8) indicates that
  decreases as
  , while
  decreases as
  (note that
  as it is a mass loss). Thus, the ratio between the two is
  /
/ , which is larger than the prediction from minor mergers (black versus gray dotted lines in Figure 4), but still fails to match the observed steep decline in
  (heavy red line). Interestingly, the nearly unity relation in
  in this case implies that the mass loss required to reproduce the observed evolution in
  from adiabatic expansion would have to vary with time as
  , or 0.67 dex between z = 2 and z = 1 (Figure 4). However, as noted by van Dokkum et al. (2014), a simple formation model in which quiescent galaxies quenched as early as
  implies a much slower mass decline at later times,
  or
or  for Salpeter and bottom-heavy IMFs, respectively. These amounts are 10–20 times smaller than the required decrease in stellar mass above. The main reason is that most of the stellar mass is lost in the first few gigayears after quenching (e.g., Damjanov et al. 2009).
The third scenario to explain the fast decline in the zero point of  is that newly quenched galaxies at lower redshifts may arrive on the quiescent relation with significantly larger re, and hence smaller
  , at a given mass than did earlier galaxies (e.g., Carollo et al. 2013; Poggianti et al. 2013). This is an example of the "progenitor bias" effect pointed out by van Dokkum & Franx (2001), in which galaxy samples are polluted by a mixture of galaxies forming at different times with different properties. At face value, the effect would appear to be small since the zero points of
  and
and  evolve together, and so there is no obvious differential effect to make
  fall more steeply than
  . However, this would change if quenching SFGs were drawn from a different region of the
  relation at different times. Say, for example, that late-quenching SFGs have systematically larger re and smaller
  (at fixed stellar mass) than early-quenching SFGs. Due to the large scatter in the
  relation, these late arrivals could pull down the zero point of
  substantially. Hydrodynamic models of SFGs to be discussed in Section 4.2 show some evidence that late-evolving SFGs actually do follow lower tracks in
  than early-evolving SFGs, giving some weight to this possibility. The effect is larger in
  but is also significant in
  , helping to explain the fall in zero point of that relation as well.
To summarize, we study four density scaling relations versus mass: for SFGs versus quiescent galaxies, and for  versus
  . The zero points of three of the four relations evolve almost identically, with projected density declining by ∼0.3 dex at fixed mass from
  to z = 0.75. The fourth,
  , shows a much larger fall of ∼1 dex. The important conclusion is that the "central" properties of galaxies as a function of mass are quite stable with time and they evolve in parallel with the effective properties as long as galaxies are star forming. In quenched galaxies, this link is broken (i.e.,
  declines much faster), most likely because extra mass is added to the outer parts from minor mergers without affecting the inner parts. However, under the typical assumptions for the effects of minor mergers, such growth alone seems unable to account for the observed evolution of the
  zero point from
  to z = 0.75—although minor mergers may play a more dominant role at low z (e.g., Newman et al. 2012; Belli et al. 2014). Two other factors—adiabatic expansion due to stellar mass loss and the late arrival of SFGs with systematically larger effective radii—may also be substantial contributors to the effect. Minor mergers change both mass and Sérsic value and are thus in principle distinguishable from the other two mechanisms, which have smaller effects on these quantities.
As pointed out in previous works, the most likely evolutionary scenario, particularly at  where the number density of quiescent galaxies is still small, is that all these evolutionary channels play a role in the evolution of the zero points (e.g., Belli et al. 2014; van der Wel et al. 2014; van Dokkum et al. 2014). Nonetheless, quantifying their relative contribution as a function of time requires precise estimates of the ages and quenching times of quiescent galaxies, as well as large enough samples to characterize the number densities at the extremes of the distributions (i.e., the smallest or densest galaxies) whose disappearance indicates the need for both size growth and stellar mass loss.
4. Evolutionary Paths of SFGs in , versus M⋆


4.1. Observational Trends
Here we address the topic of whether the population loci in the various scaling relations shown in Figure 2 can be interpreted as approximate evolutionary tracks, and more generally how individual galaxies are moving in these diagrams. This topic was touched on in Section 3.1, where we noted that the  relation for SFGs is both relatively narrow in mass (σ(
 dex)) and that its zero point changes by only a factor of two over the redshifts probed. Since galaxies are believed to evolve in mass by much more than either of these numbers, i.e., by
  over the same redshift range (van Dokkum et al. 2010; Behroozi et al. 2013; Moster et al. 2013; Papovich et al. 2015), the excursions and zero point changes are therefore both small compared to the overall mass trend. This suggests that
  can be interpreted as an approximate evolutionary track and that galaxies evolve along it while still star forming (neglecting the small decline in zero point). A relevant conclusion based on this assumption is that galaxies would build their core densities continuously over time as long as they are in the star-forming phase, and do so in a way that is closely correlated with their instantaneous stellar mass. A similar evolutionary trend was proposed by Fang et al. (2013) at z = 0, and by Tacchella et al. (2015) at
  . Tacchella et al. (2015), however, suggest that all massive SFGs exhibit fully quenched cores at that redshift, and therefore the slope of their evolutionary tracks flattens
  at
at  .
.
The scatter in the  relation is larger (σ(M⋆) ∼ 0.6 dex), but it is still smaller than the estimated mass growth. Furthermore, as shown in Figure 3, the
  and
and  relations are tightly related to one another for a given Sérsic profile. Thus, on average, galaxies would evolve along this relation as well. A similar statement can also be made about the
  relation, as shown in van Dokkum et al. (2015), which is equivalent in information to
  . In that paper, the authors advocate for a slightly steeper slope (a = 0.3) compared to that of the observed size–mass relation (a = 0.22; van der Wel et al. 2014). This slope is meant to be a time and population average of the overall size growth trend rather than the evolutionary track of individual galaxies.
In the following, we assume that SFGs approximately follow evolutionary tracks in density–mass space characterized by the instantaneous slopes from Table 1,  with
with  and
and  , and we discuss the physical processes that could be involved in creating such pathways. These evolutionary vectors are shown in Figure 5 with blue arrows. SFGs growing along the
  relation progressively increase their surface density with time. However, since
  the mass in the core grows more slowly than the total mass of galaxy, i.e., the core-to-total mass ratio decreases with time. This is consistent with the notion of inside-out growth of an exponential profile (disk) due to galactic-scale star formation and accretion of higher angular momentum material, which causes both re and
  to increase along with stellar mass (e.g., Nelson et al. 2012, 2013). This scenario also agrees with Figure 3, which shows that the
  and
and  relations (cyan lines) approximately match the distribution of galaxies with a constant, low Sérsic index.
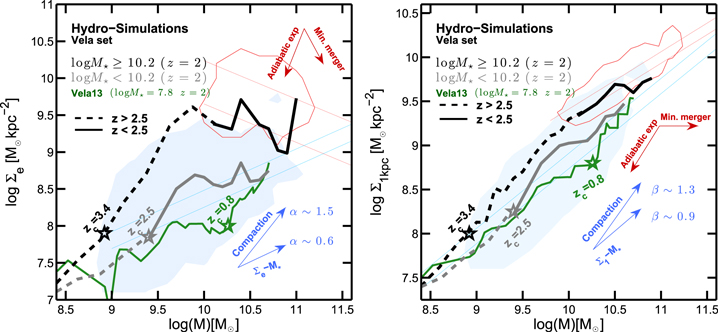
Figure 5. Galaxy evolutionary tracks in  (left) and
  (right) vs. stellar mass as a function of time for the Vela set of 35 hydrodynamical simulations described in Ceverino et al. (2014) and Zolotov et al. (2015). The black and gray lines show the median evolutionary tracks for galaxies above and below
  at z = 2. The dashed and solid parts of the tracks indicate the evolution at redshifts higher and lower than z = 2.5, respectively. The blue and red contours show the observed distributions of SFGs and quiescent galaxies at
  . The blue and red lines show the best-fit
  and
and  relations at
  and
and  from Figure 2 (the z = 2 lines are higher). The model tracks are in excellent agreement with the observed distributions in
  and
and  (see also Figure 12 of Ceverino et al. 2015) and exhibit good agreement with the main evolutionary phases discussed in Section 4.1 (blue arrows), namely (1) a phase of relatively smooth structural growth that follows approximately the best-fit
  and
and  relations from the data (
 ,
,  ) and (2) a phase of compaction, a period of steeper core growth (
 ,
,  ), usually triggered by a strongly dissipational event. The simulations exhibit a downsizing trend, such that the most massive galaxies evolve earlier and experience a stronger compaction event (open star) due to higher gas fraction at high z. The different loci of SFGs and quiescent galaxies are caused by this downsizing trend: massive galaxies arrive at the backbone of the quiescent relation after a strong (fast) compaction at
  however, they remain star forming for a longer period of time (see text for further remarks); low-mass galaxies arrive on the quiescent relation from below in a late compaction event. The green line shows the track of Vela13, which exhibits the latest compaction at z = 0.8, remaining the longest on the Σ–M
 relations. For completeness, the red arrows indicate the possible evolutionary tracks for quiescent galaxies under the minor merger or adiabatic expansion scenarios (see Section 3.3 and Appendix
Download figure:
Standard image High-resolution imageNext, we focus on the evolutionary paths that take SFGs to the higher-density structural relations of quiescent galaxies. To first order, SFGs growing strictly along the  relations would intersect the quiescent structural relations at
  . However, confining quenching to that track would likely overproduce the number of massive quiescent galaxies (e.g., Figure 27 of van Dokkum et al. 2015). An alternative scenario to explain the emergence of denser quiescent galaxies is that at least some SFGs follow a steeper path upwards from the
  relation as a result of some period(s) of fast core growth relative to the smooth growth along the structural
  relations.
At high z, these periods are probably caused by strongly dissipational, wet "compaction" events, e.g., major mergers (Hopkins et al. 2008) or disk instabilities (Elmegreen et al. 2008; Dekel et al. 2009b) which bring existing stars and large amounts of new gas to the center of the galaxy. These events enhance star formation in the core, increasing the central density and, in the most extreme cases, collapsing the whole galaxy to a much smaller re. At low z, the frequency of rapid wet compactions declines with the observed gas fractions in galaxies and other slower events, such as minor mergers and/or secular evolution (e.g., Kormendy & Kennicutt 2004), can play a more important role.
The wet compaction scenario was discussed in Barro et al. (2013, 2014a) on the basis that some dense massive SFGs at  were found to lie on the size–mass relation of quiescent galaxies. Such galaxies are shown by the green points in Figure 2. These compact SFGs exhibit smaller sizes and higher Sérsic indices than typical SFGs, suggesting that they have indeed experienced a substantial structural transformation.
In the following, we refer to any evolutionary paths that move upwards from the  relation due to (wet or dry) phase(s) of high-efficiency core growth as compaction tracks. We emphasize that compaction is, primarily, a core building process, and thus it is more efficient at increasing
  than
than  , as the latter also depends on the overall galaxy size. This is illustrated by the green points in Figure 2 which have uniformly dense cores but vary greatly in
  . We further discuss this difference in Section 5.2.
4.2. Trends in Hydrodynamical Simulations
In order to provide further support for the structural evolutionary paths discussed above and to obtain some insight on the physical mechanism(s) that could motivate them, we study the evolutionary paths of a sample of high-resolution hydrodynamical galaxy simulations in the same parameter space. Figure 5 shows the evolutionary tracks in  and
and  versus mass for the Vela set of 35 simulations described in Ceverino et al. (2014) and Zolotov et al. (2015). In the latter, the authors analyzed the SFR, structure, and kinematics of the simulated SFGs, showing that the driving force behind the most significant changes in all these properties is a phase (or phases) of gas-rich (wet) compaction caused by, e.g., mergers, disk instabilities, interactions, counter-rotating streams, or tidal compressions, which trigger intense episodes of gas inflow and SFR, as mentioned in the previous section.
Following the approach in Zolotov et al. (2015), we divide the sample into two groups according to their mass (in Figure 5, high mass is in black, low mass is in gray), and we show their median evolutionary tracks for the two groups at early (dashed;  ) and late (solid;
  ) times. The late evolution roughly matches the redshift range of the observed galaxy sample, shown as the blue and red contours. Qualitatively, the tracks have a similar behavior in both panels and match the observed distributions rather well. To first order, the evolutionary paths can be broken down into two phases: an early phase of steady structural growth approximately following the slope of the
  relations (
 ,
,  ) and a compaction phase, which causes a steep increase in
  and
and  ,
,  ). The steep increase in
  implies an actual size shrinkage, particularly in the high-mass simulations (see also Figure 9 in Zolotov et al. 2015). Overall, the dependence of
  on re, which can change rapidly due to gas accretion and/or interactions, implies a larger spread in
  with respect to
  for a given stellar mass.
The main differences between the black and gray tracks are as follows: (1) a downsizing effect, i.e., the most massive galaxies evolve earlier and faster, (2) the evolutionary tracks of massive galaxies have a higher zero point, i.e., are denser at fixed stellar mass, and (3) the main compaction event is stronger and happens earlier for the most massive galaxies. The most natural explanation of the higher densities of the more massive galaxies is that they evolve faster and reach a given mass when the universe was denser. The fast growth (i.e., higher SFRs) is also a natural consequence of the higher (gas) densities (Dekel et al. 2013; Zolotov et al. 2015). Hence, at the risk of some oversimplification, the manifold of model galaxies is a two-parameter family given by the mass and time of formation.
The star-forming locus (blue contour) consists mostly of lower-mass galaxies, which arrive on the high-mass region only at lower redshifts ( , gray lines). These galaxies experience weaker compaction events, after which the core becomes quiescent due to gas exhaustion. However, the quenching is only temporary and, when the gas inflow reaches the center of the galaxy, the core becomes star forming again, and the galaxy continues to grow along the
  relations. The combination of a compaction phase followed by a quiescent-core phase can increase or decrease the zero point of the
  relation on which the galaxy evolves. The low-mass simulations can experience further compaction events at a later time, which would cause them to arrive on the quiescent
  relation from below. This is illustrated by the green track of Vela13. This galaxy has the latest compaction event and thus spends most of its life along the star-forming
  relations. Interestingly, during this phase, the gas mass in the central 1 kpc remains almost constant, as expected in the case of a simple "bath-tub" model evolution (e.g., Bouché et al. 2010; Krumholz & Dekel 2012; Dekel et al. 2013). This "bath-tub" phase strengthens the notion that the growth along the
  relations describes a phase of smooth, steady-state evolution that coincides with the SFR main sequence.
The quiescent locus (red contour) consists, almost exclusively, of massive galaxies that experienced a strong compaction event at  , reaching the (high density) quiescent region in just a few hundred megayears (
 black lines in Figure 5). The evolution of these tracks at lower redshift, however, differs substantially from that of fully quenched galaxies, which are expected to grow in mass only by merging. These massive simulations have quenched cores, but they still exhibit star formation (and therefore mass growth) in a re-grown disk (Zolotov et al. 2015; Tacchella et al. 2016). The newly formed disk causes a sudden increase in size, which leads to decreasing tracks with mass in
  , but nearly flat tracks in
  (see also Figure 19 of Zolotov et al. 2015). Thus, the low-z tracks (solid black lines) do not strictly apply to fully quenched galaxies, but they may reflect the evolution of some compact SFGs (green points in Figure 2), which rather than quenching right away sustain low levels of star formation in an extended disk.
4.3. Summary of Evolutionary Paths
Based on the encouraging agreement between the models and data, we suggest that the overall long-term structural evolution of SFGs can be expressed in terms of two phases that follow approximately linear tracks in ![$\mathrm{log}{{\rm{\Sigma }}}_{1,{\rm{e}}}\propto [\alpha ,\beta ]\mathrm{log}\,{M}_{\star }$](https://content.cld.iop.org/journals/0004-637X/840/1/47/revision1/apjaa6b05ieqn370.gif) . First, the evolution along the
. First, the evolution along the  relations (
 ,
,  ), which is a relatively smooth phase of structural growth, is consistent with a period of continuous gas accretion and galactic-scale star formation. As a result, both central and effective densities increase with time, as does the overall galaxy radius, i.e., similar to the growth of an exponential disk. Compaction is a phase (or phases) of enhanced core growth (
 ,
,  ) relative to the
  relations. At high z, compaction is a wet process, fueled by strong gas infall to the galaxy center, as a result of gravitational instabilities and other processes. As a result, the central and effective densities increase steeply, and the galaxy's effective radius can decrease due to the large increase in stellar mass close to the center, or due to a structural collapse.
Overall, the intensity and duration of compaction events decreases with time due to the similarly decreasing gas fractions. This leads to the conclusion that at late times, when galaxies are less gas-rich, compaction processes must also include minor mergers and/or secular evolution that operate on longer dynamical timescales (e.g., Kormendy & Kennicutt 2004). The main idea is that even a largely dry compaction process can put some gas at the centers at any time until full quenching (e.g., Dutton et al. 2011; Wuyts et al. 2012; Forbes et al. 2014) so there is always star formation in the core of SFGs. Note also that there can always be a relative increase in core mass relative to total mass (compaction) from a global decline of the total mass growth (due to lower star formation in the disk) rather than an acceleration of the core growth.
5. The Relative Distances from the SFR–MS and the Quiescent Structural Relations: Compaction and Quenching
In this section, we study the relative distributions of massive galaxies,  , with respect to the SFR–MS and the
  structural relations to identify candidate quenching galaxies as a function of redshift. Qualitatively, this analysis is similar to studying the distribution with respect to the SFR–MS and
  –M
–M relations for SFGs (e.g., Whitaker et al. 2017; J. J. Fang et al. 2017, in preparation). However, using
  frames the selection around quiescent galaxies, searching for SFGs with similar structural properties to them.
5.1. Compact SFGs as Progenitors of Quiescent Galaxies
As discussed in the previous section, the higher normalization of the quiescent structural relations with respect to those of SFGs suggests that quenching is preceded by an increase in the surface density above a certain threshold. However, as shown in Figure 2, such characteristic density scales with stellar mass, challenging the simple notion of a fixed quenching threshold at a given surface density or stellar mass (e.g., Kauffmann et al. 2003; Franx et al. 2008). In turn, the most effective quiescent criterion is a selection with respect to the  or
or  sequences with stellar mass, i.e., a relative offset from the structural relations. Such relative selection includes fewer SFGs. However, there is always overlap with quiescent galaxies at every redshift. A possible interpretation, outlined in the previous section, is that those overlapping SFGs acquire quiescent morphologies while they are still star-forming as a result of a compaction process, i.e., a structural transformation that increases the central density and Sérsic index, and possibly reduces the size before quenching star formation. Such an evolutionary sequence was confirmed in Barro et al. (2013, hereafter B13; Barro et al. 2014a) for SFGs at
  . In B13, the authors used a selection on specific SFR and relative distance to the quiescent size–mass relation to identify compact SFGs at
  , finding that those galaxies have similar sizes, Sérsic indices, and spheroidal morphologies to the quiescent population.
Building on this idea, in this work we define compact SFGs as those SFGs ( dex) found within the
  the scatter of the quiescent structural scaling relations at a given redshift,
  , where
  is either the central or effective mass density, and we use
  dex and
  dex, respectively. This definition differs from previous works where compact is an absolute term to identify the smallest galaxies at high z(
 e.g., Cassata et al. 2011, 2013). Here, compact is a relative term referring to the densest/smallest SFGs at every redshift. Panels A and B of Figure 6 illustrate the selection of compact SFGs in
  and
and  (dashed line). In the x-axis, we add the zero point at each redshift to illustrate the different time evolutions in the normalization of these relations. Panel A also shows the compactness threshold of B13 (purple line), which, by definition, matches
  dex at
  . However, as the normalization of
  declines with time, a fixed selection threshold obtains progressively fewer galaxies. In contrast,
  is essentially a redshift-independent extension of the method to identify star-forming progenitors of quiescent galaxies (see the next section).

Figure 6. ΔSFR vs.  distributions with respect to the SFR–MS and the
  (top) and
  (bottom) quiescent structural relations as a function of redshift for galaxies with
  . The x-axis is normalized to the zero point of the quiescent relations to illustrate its evolution with time. The blue circles depict "extended" SFGs with
  , and the green circles show compact SFGs with central densities within the
  scatter of
  (dashed lines). The relative fractions of SFGs and quiescent galaxies found within the
  scatter of
  and
and  (dashed lines) are indicated in the bottom left. The L-shaped nature of the distributions indicate that SFGs become compact before they fully quench their star formation. The distributions in the top and bottom panels are very similar; however,
  exhibits a tighter scatter and a slower evolution of the zero point. The purple line shows the compactness threshold in
  from B13, which is only efficient at
  because it does not evolve. A fraction of the compact SFGs selected with Δ
 are not compact in
  . This indicates that those SFGs have compact cores, but have a larger re than typical quiescent galaxies. Thus, a threshold in
  is a more efficient selection criterion to identify compact SFGs and quiescent galaxies.
Download figure:
Standard image High-resolution imageThe relative distributions of SFGs and quiescent galaxies in both panels of Figure 6 are qualitatively very similar. By definition, both  and
and  select the majority of the quiescent galaxies within the typical scatter of the average quiescent structural relations. Nonetheless, there are some noticeable differences between them. First, selecting quiescent galaxies using
  leads to a few more catastrophic outliers, most likely due to extreme values of the Sérsic index also affecting the re (see, e.g., van der Wel et al. 2012). Second, the selection of compact SFGs using
  yields ∼10%–15% more compact SFGs at each redshift. These SFGs characterized as compact by
  but scattered outside the
  selection threshold have dense centers similar to those of quiescent galaxies, but more extended profiles with ongoing star formation. In terms of an evolutionary sequence, one could speculate that these galaxies will eventually become fully quiescent once the extended star-forming disk fades (e.g., Fang et al. 2013; Tacchella et al. 2015). Some of these galaxies exhibit radial profiles that can be characterized by two Sérsic components (bulge+disk; e.g., Bruce et al. 2012; Lang et al. 2014), where the "bulge" is already quiescent. Thus,
  appears to be a more efficient criterion to account for all the SFGs that are most likely to join the quiescent population based on structural considerations.
The difference between Δ and Δ
and Δ is also a reflection that effective quantities are prone to larger fluctuations due to the continuous accretion and disruption processes in galaxies that make the evolution of re not monotonic with time. On the contrary,
  is more stable and therefore closer to a clock (it only increases). It also exhibits a tighter scaling relation with mass and a slower evolution with redshift of the normalization. As shown in panel B of Figure 6, the compactness threshold in
  ,
,  B(z)-0.2, exhibits a small range between 9.6 and 9.3 M⊙ kpc−2, and thus a threshold of ∼9.5 M
 kpc−2 identifies the majority of compact SFGs and quiescent galaxies at redshift
  . Hereafter, we will refer to compact SFGs as those selected in terms of
  .
.
5.2. A Redshift-independent Sequence Relating Galaxy Structure and Quenching
The remarkable similarity in the galaxy distributions of Figure 6 as a function of time suggest that the relative distance from the SFR–MS and  relations describes a common evolutionary sequence toward quiescence for massive galaxies, which is independent of redshift. Figure 7 illustrates this sequence showing the stacked distribution in
  versus
  for massive galaxies (
 ) in the redshift range
  . The upside-down, L-shaped sequence summarizes the notion that forming a dense core is a pre-requisite for quenching star formation (cf. Bell et al. 2012; Cheung et al. 2012; Fang et al. 2013; van Dokkum et al. 2014). The color code of the Sérsic index emphasizes that the evolution requires both the growth of a dense core and a structural transformation from an exponential (disk) profile to more of a concentrated (
 ) Sérsic profile. Incidentally, Figure 7 also illustrates why the Sérsic index is a better quiescent indicator than a constant threshold in
  or velocity dispersion, σ (e.g., Bell et al. 2012).

Figure 7. Stacked ΔSFR–MS vs.  (left) and
  (right) for all massive galaxies at
  , color-coded by the Sérsic index. The distribution show all galaxies in Figure 6 after correcting for the zero-point evolution of the structural relations and normalized at log A = log B = 10 M
 kpc−2. The gray lines show the best-fit linear relations for SFGs and quiescent galaxies. The numbers and the legend on the right side of the panel summarize the approximate evolutionary phases along the L-shape sequence: (1) the inside-out growth of a SFG in the SFR–MS, which increases both its effective radius and central mass at a relatively constant Sérsic index (i.e., disk growth); (2) a phase of enhanced core growth, relative to the previous phase, which increases the Sérsic index; the slight tilt of the steps 1–2 suggests that the onset of quenching goes hand in hand with the compaction process; (3) a complete shutdown of star formation at maximum
  and
and  in compact SFGs; and (4) a passive phase in which
  remains relatively constant while
  decreases quickly due to size growth and the quenching of new (larger) galaxies.
Download figure:
Standard image High-resolution imageIn terms of the galaxy evolutionary paths discussed in Section 4, the nearly horizontal branch, which consists of main sequence SFGs, can be qualitatively described as the inside-out growth of an exponential disk ( ) due to in situ star formation. This growth increases the overall size of the galaxy as well as
  and
and  . The slight tilt of this branch,
  ,
,  (gray lines), which follows an increase in the Sérsic index, suggests that the onset of quenching goes hand in hand with a structural transformation that increases the concentration of the galaxy. Following the discussion in the previous section, we refer to this transition phase at the knee of the L-shaped distribution as the compaction phase, as it involves a stronger increase in
  and
and  relative to the average evolution during the inside-out growth phase, which makes the mass profile more concentrated (
 ) and possibly leads to smaller
  . The vertical branch shows that quenching, defined as a hard threshold in sSFR (or
  dex), takes place at maximum central density in compact SFGs that have already acquired similar morphologies to the quiescent population, i.e., compaction precedes the full shutdown of star formation, although it may start approximately at the same time as the quenching process.
Following the interpretation of B13, we characterize the evolution in the L-shape diagram as declining from fast to slow as a function of time. The gradient in quenching speed arises naturally from the global decline in sSFR with time (e.g., Speagle et al. 2014). Since  , the central densities increase more slowly with time. The larger SFR at high z is associated with higher gas fractions (Tacconi et al. 2010; Tacconi et al. 2013), which are likely related with larger accretion rates from the dark matter halos (Dekel et al. 2013; Dekel & Burkert 2014). Simple stability arguments predict that such gas-rich galaxies are also prone to stronger gravitational instabilities, and thus favor more rapid compaction, and hence quenching, processes. In such case, the downward tilt in Figure 7 could be due to gas starvation after an instability-induced starburst, i.e., a wet inflow that causes a peak in the SFR at the maximum gas density and declines progressively with the gas supply, while the core mass increases (see, e.g., Feldmann & Mayer 2015; Zolotov et al. 2015 in simulations and Ikarashi et al. 2015 and Barro et al. 2016 for recent observations of compact nuclear starburst at
  ). The truncation of the gas supply to the galaxy center could be caused by a combination of feedback (e.g., outflows) and stabilization of the disk due to the increasing central density (Martig et al. 2009).
At lower redshift, the smaller gas fractions and longer dynamical timescales suggest that compaction mechanisms would likely become a mixture of weaker instabilities, which can still cause enhanced gas inflows or inward migration of stellar clumps (e.g., Dekel et al. 2009b; Bournaud et al. 2011; Genel et al. 2012), and secular processes (Kormendy & Kennicutt 2004) associated with torques and dynamical friction in the presence of bars and spiral arms. The latter play an important role in increasing the central density in SFGs that already exhibit relatively quiescent centers, i.e., lacking enough star formation to sustain the core growth required to reach the  relation (Wuyts et al. 2012, 2013; Bruce et al. 2014a, 2014b; Lang et al. 2014). In those SFGs, quenching is also expected to be a slow process, related with gas consumption in the star-forming disk (fading; e.g., Fang et al. 2013; Tacchella et al. 2015). The slow quenching process also depends on additional mechanisms to prevent further gas accretion onto the disk, e.g., virial shock heating in massive halos (Croton et al. 2006; Dekel & Birnboim 2006) or AGN feedback. As mentioned in the previous section, some of these SFGs are compact in
  but not in
  . Therefore, the tilt in
  versus Δ
 can be caused by the size shrinkage (re) associated with fading rather than with an increase in their core mass (see, e.g., Feng et al. 2013).
5.3. Number Density of Compact SFGs and Quiescent Galaxies
The structural similarities between compact SFGs and quiescent galaxies and the increasing number density of the latter as a function of time supports the idea that the L-shaped diagram is indeed an evolutionary sequence, i.e., compact SFGs in the knee of the relation are immediate progenitors of the quiescent galaxies at lower redshifts. Figure 8 shows the evolution in the number density of compact SFGs, selected using Δ
 , and all quiescent galaxies, regardless of their structural properties, since
  . The latter grows approximately as a power law,
  , in good agreement with previous results (e.g., Muzzin et al. 2013). Assuming that quiescent galaxies are descendants of compact SFGs at higher redshift, the number of quiescent galaxies is the cumulative distribution of quenching compact SFGs as a function of time. To quantify the relative numbers of these two populations, we assume that the number density of compact SFGs also follows a power-law evolution as the result of two opposite processes that cause either an increase (due to compaction) or decrease (due to quenching) in their total number:
  . In this model, the evolution in the number of quiescent galaxies is proportional to the number of quenching SFGs and thus inherits the power-law dependence:
  . There are two additional parameters that determine the initial number of compact SFGs and quiescent galaxies,
  and
and  . We set
  at
at  , and we fit the other three parameters to the observed number density of compact SFGs and quiescent galaxies, which yields
  ,
,  and
and  Mpc−3. Thus, the characteristic quenching timescale for a compact SFG in units of redshift is
  , which implies that the quenching time increases from
  to 1.1 Gyr at z = 3 and z = 1. In spite of its simplicity, this model provides a more realistic approximation than previous assumptions that all compact SFGs form and quench in discrete intervals of time. In this case, the number densities vary continuously while preserving the evolutionary connection as a characteristic quenching time.

Figure 8. Redshift evolution of the number density of massive ( ) compact SFGs and quiescent galaxies. Compact SFGs are selected using the
  criterion. The red triangles indicate the evolution in the number density of quiescent galaxies in different mass ranges from Muzzin et al. (2013). The green and red lines show the best-fit evolutionary model to the observed number of compact SFGs and quiescent galaxies. The model is based on the assumption that quiescent galaxies are descendants of compact SFGs that have a characteristic quenching timescale
  , but can also increase in number due to compaction events in more extended SFGs that have a frequency
  . This simple model which assumes a continuous replenishment of compact SFGs at every redshift can account for the observed evolution in the two populations.
Download figure:
Standard image High-resolution image5.4. Galaxy Morphologies in the Sequence

Although the L-shape of the ΔSFR sequence is nearly independent of redshift, the evolution in the zero points of the SFR–MS and the structural
  relations, from which the relative distances are computed, implies that both the star formation and the structural and morphological properties of the galaxies in a given point of the sequence vary with redshift. To illustrate this change in structural properties and visual appearances within the L-shaped evolutionary path, Figure 9 shows images of galaxies in the three regions of the L-sequence at different redshifts and with increasing stellar masses as a function of time following a typical mass growth track. For this particular example, we adopt a smaller mass growth factor of
  (compared to
  in Section 3.1) because the initial progenitors are more massive,
  at z = 2.75 (see, e.g., the predicted mass tracks in Wellons et al. 2016).
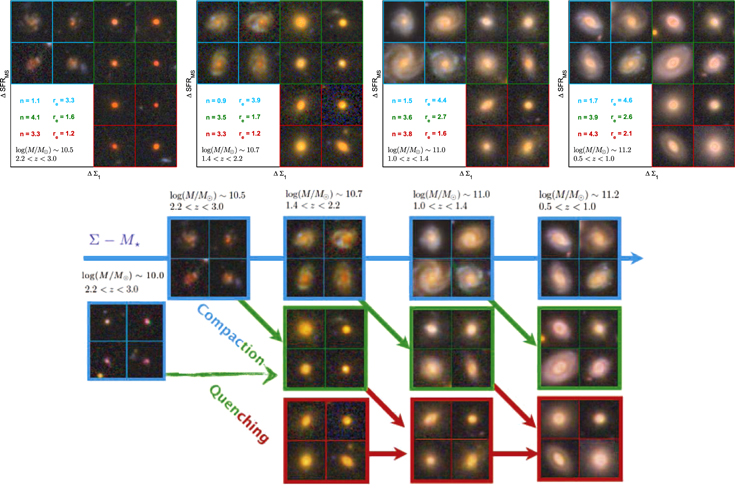
Figure 9. Top: snapshots of galaxies in the different phases of the evolutionary sequence in ΔSFR  (see Figure 6): extended SFGs (blue), compact SFGs (green) and quiescent galaxies (red). Each panel shows galaxies with increasing stellar masses as a function of time (left to right) following the mass growth track from z = 3 to z = 0.5 in Behroozi et al. (2013). The numbers in the bottom-left inset indicate the median n and re of the galaxies in each group. Bottom: examples of possible evolutionary pathways following the mass growth track with redshift. For the same mass growth, some SFGs may remain in the SFR–MS, since from z = 3 to z = 0.5, they are growing in size and central density, and acquiring progressively more settled disk-like appearances (blue), while others would experience a faster core growth, relative to the latter, resulting in a strong increase in
  and
and  (green). The compaction and quenching processes are likely entwined, and once both are started, the complete shutdown of star formation takes place after galaxies have reached a maximum central density, showing only minor changes in their structural and visual appearances relative to their compact SFG progenitors (red).
Download figure:
Standard image High-resolution imageThe upper panel of Figure 9 indicates the average values of the Sérsic index and effective radius for the galaxies in each of the three groups (blue, green, and red) at a given redshift snapshot. The bottom panel illustrates the possible evolutionary sequences within the L-shaped diagram following the mass-growth track. The blue arrow illustrates a possible track for "extended" SFGs that remain in the SFR–MS and the  relations from redshift z = 3 to 0.5. These galaxies increase both their sizes and central densities with time and the change in their visual morphologies is consistent with the notion of an inside-out growing disk (
 ), starting from smaller, more disturbed, and clumpier appearances at
  to progressively acquire more settled disk-like structures and to grow larger cores with redder colors at
  (cf. Bruce et al. 2012; Wuyts et al. 2012; Lang et al. 2014; Tacchella et al. 2015).
The green arrows illustrate possible compaction tracks for galaxies around the knee of the L-shaped diagram. This evolutionary track implies a larger increase of the central densities, with respect to the evolution of "extended" SFGs in the blue line, for the same mass growth. The more massive cores in the compact SFGs are visually obvious. With time, the morphologies of galaxies in the compact phase change from pure spheroids to more disk-like appearances. The large central density dominates the Sérsic index, which is high at all redshifts ( ), but the diffuse extended components visible at lower redshifts lead to an average size increase with time. This is consistent with the idea that compact SFGs are formed from extended SFGs, which are mostly disk dominated at low z, by increasing their central densities. The evolution toward disk-like morphologies with progressively bigger cores is consistent with the prominence of disks with bulges among massive SFGs at
  , as reported in previous works (e.g., Bruce et al. 2012, 2014a; Buitrago et al. 2013; McLure et al. 2013; Mortlock et al. 2013; Lang et al. 2014; Huertas-Company et al. 2015). Note that rejuvenation and/or the re-growth of a star-forming disk in compact SFGs is also a possibility, although the increasing number of quiescent galaxies with time suggests that the net flow of galaxies is preferentially toward compaction and quenching.
Qualitatively, the morphologies of compact SFGs are almost identical to those of quiescent galaxies at the same redshift, which strengthens the notion that they are their immediate progenitors and that full quenching takes place at maximum surface density in SFGs that have acquired quiescent morphology (red arrows). Extended and compact SFGs also exhibit qualitatively similar morphologies at  , showing increasingly larger cores (bulges) along the green compaction arrow. However, at higher redshifts, the formation of compact SFGs, with almost pure spheroidal morphologies, from irregular, clumpy, extended SFGs suggests the action of strongly dissipative processes that redistribute the gas reservoir toward the galaxy center, removing it from the extended irregular component and forming a dense core. An alternative formation scenario could be that compact SFGs follow a much faster mass-growth track (e.g., by a factor of
  from
from  to 2), evolving rapidly from small, low-mass SFGs (e.g., William et al. 2014; Wellons et al. 2016) that typically show smooth, spheroid-like morphologies, although their Sérsic indices are disk-like.
Lastly, we discuss the possible evolutionary path of the quiescent population (bottom row, red squares). The images in Figure 9 illustrate how quiescent galaxies are progressively increasing their size as a function of time. This increase becomes more evident at  , which is the approximate epoch where the number density of "naked" compact SFGs experiences a steep decline (Barro et al. 2013; van Dokkum et al. 2015). Thus, an intuitive notion to explain the morphological evolution of the quiescent population is that the disappearance of "naked" star-forming cores leads to newly quenched galaxies coming from larger (more extended) progenitors (diagonal downward-pointing red arrow). Simultaneously, the already existing quenched galaxies may also grow in size (horizontal red arrow) either by minor merging13
or perhaps by accreting stars (and/or gas) that could rebuild a disk, which in some cases could host some star formation (diagonal up, not shown), and eventually lead to the formation of early-type (passive) disks (e.g., Bundy et al. 2010; Margalef-Bentabol et al. 2016), which nonetheless maintain the same stellar density within the central 1 kpc. The disk regrowth scenario could explain the apparent decline in the number of the most compact quiescent galaxies (defined as having small sizes of
, which is the approximate epoch where the number density of "naked" compact SFGs experiences a steep decline (Barro et al. 2013; van Dokkum et al. 2015). Thus, an intuitive notion to explain the morphological evolution of the quiescent population is that the disappearance of "naked" star-forming cores leads to newly quenched galaxies coming from larger (more extended) progenitors (diagonal downward-pointing red arrow). Simultaneously, the already existing quenched galaxies may also grow in size (horizontal red arrow) either by minor merging13
or perhaps by accreting stars (and/or gas) that could rebuild a disk, which in some cases could host some star formation (diagonal up, not shown), and eventually lead to the formation of early-type (passive) disks (e.g., Bundy et al. 2010; Margalef-Bentabol et al. 2016), which nonetheless maintain the same stellar density within the central 1 kpc. The disk regrowth scenario could explain the apparent decline in the number of the most compact quiescent galaxies (defined as having small sizes of  kpc) with time (e.g., Cassata et al. 2013; Damjanov et al. 2014, 2015; Trujillo et al. 2014; Ferré-Mateu et al. 2017) since they would be hidden as the bulges of today's massive early-type disks (Driver et al. 2013; Graham & Scott 2013; Graham et al. 2015).
6. Summary
We analyze the star formation and structural properties of massive galaxies in the CANDELS/GOODS-S field to study the relation between stellar mass and structural growth, and the role of the latter in the quenching of star formation since  . The principal tools of analysis are the correlations in the mass surface density within the effective radius,
  , and within the central 1 kpc,
  , versus stellar mass.
  traces the stellar mass growth in the galaxy core, and thus it is close to the concept of a cosmic clock (i.e., it can only increase with time).
  , however, depends on the relative balance between stellar mass and size growth, and thus in principle can exhibit both positive and negative fluctuations.
We find that SFGs and quiescent galaxies follow clear and distinct correlations in  and
and  versus stellar mass that were already firmly in place at
  , confirming and extending recent findings that the basic scaling relations of galaxies were established quite early (e.g., Franx et al. 2008; Saracco et al. 2012; Wuyts et al. 2012; van der Wel et al. 2014). These correlations are well-described by linear relations in log-log space. The slopes and scatter of these relations are relatively constant with time, while their zero points decline (see Table 1). The scatter in the
  structural relations is ∼2× tighter than in the
  relations for both SFGs and quiescent galaxies. For SFGs, the zero points in
  and
and  decrease by less than a factor of ∼2 from z = 3 to z = 0.5. For quiescent galaxies, the decline in
  is 5× larger than in
  (∼0.3 dex versus ∼1 dex, respectively). Thus, the "central" properties of galaxies as a function of mass are quite stable with time and they evolve in parallel with the effective properties as long as galaxies are star forming.
Based on the tight scatter and the slow decline in the zero points of the structural relations for SFGs compared to their expected mass growth since  , we speculate that, while star-forming, these galaxies could follow evolutionary tracks along both the
  and
and  relations. These tracks are in excellent agreement with the predictions of recent hydrodynamical simulations, and they are qualitatively consistent with the notion of inside-out growth in disk-like galaxies, i.e., SFGs in the SFR–MS that increase their size and central density with time at relatively constant Sérsic index.
At every mass and redshift, quiescent galaxies follow structural relations with higher surface densities than SFGs and have cuspier mass profiles (higher Sérsic). This implies that growing a dense core is a prerequisite for quenching star formation (cf. Cheung et al. 2012; Fang et al. 2013; van Dokkum et al. 2014) and suggests that the immediate star-forming progenitors of quiescent galaxies experience a phase of stronger core growth that increases their concentration with respect to galaxies growing along the  relations. At high redshifts, this phase is consistent with the compaction evolutionary tracks predicted in hydrodynamical simulations (Ceverino et al. 2015; Zolotov et al. 2015; Tacchella et al. 2016), which are typically associated with strongly dissipational (gas-rich) processes such as major mergers and interaction driven gravitational instabilities (Dekel et al. 2009a; Ceverino et al. 2010; Dekel & Burkert 2014). At lower redshifts, these gas-rich processes probably coexist with minor mergers and secular instabilities (e.g., bars and spiral arms; Kormendy & Kennicutt 2004). Furthermore, at late times, core growth may not accelerate, but rather total mass growth may decelerate as the star formation declines. Figure 10 summarizes possible evolutionary tracks for SFGs growing along the structural relations and forming a dense core as a result of both wet and dry compaction events.

Figure 10. Schematic summary of possible evolutionary paths with redshift for SFGs in the  diagram. The blue and red contours show the loci of SFGs and quiescent galaxies at
  . The arrows indicate possible evolutionary tracks either along the
  relation (light blue) or in a wet or dry compaction phase (dark blue and orange). The schematic galaxies illustrate the process of disk and core growth during those phases. While growing along the
  relation, both the core and total masses increase almost synchronously with approximately constant Sérsic index (see Figure 3). Thus, it resembles the inside-out growth of a disk. The compaction tracks depict a phase of faster core growth (relative to the evolution along
  ) and increasing Sérsic index, which resembles the process of "bulge" growth. Compaction can be caused by dissipational processes that can be either wet (gas rich), such as mergers and disk instabilities, or dry (gas poor), such as mergers or secular instabilities. Strong compaction events are more common at high z due to the higher gas content, while secular processes may play a more important role at low z as the gas reservoirs and SFRs decline.
Download figure:
Standard image High-resolution imageWe find that the distribution of massive ( ) SFGs and quiescent galaxies relative to the SFR–MS and the quiescent structural relations,
  , exhibits a characteristic L-shape that is independent of redshift (Figure 6). Qualitatively, this sequence describes an evolutionary sequence that follows the main phases of structural evolution mentioned above: a nearly horizontal branch of SFR–MS disks growing inside-out that transition into the compaction knee as a result of a significant increase in central/effective density and Sérsic index, and lastly, a vertical quenching branch that indicates that galaxies shut down star formation after reaching a maximum central and effective density determined by the zero point of the
  relations.
The similar structural properties and morphologies between compact SFGs, in the knee of the L-shaped diagram, and quiescent galaxies, and their matching evolution in number densities suggests that compact SFGs at a given redshift are the most likely progenitors of quiescent galaxies at lower z. The selection of compact galaxies within the scatter of  is more efficient than using
  , as it yields fewer quiescent outliers and a higher fraction of compact SFGs. Furthermore, owing to the mild decline in the normalization of the
  relation with time, the compactness threshold, defined as
  B(z)-0.2, exhibits a small variation from 9.6 to 9.3 M
 kpc−2 from z = 3 to z = 0.5, and thus it is the most effective criterion to identify the immediate progenitors of quiescent galaxies as a function of redshift.
Support for program number HST-GO-12060 was provided by NASA through a grant from the Space Telescope Science Institute, which is operated by the Association of Universities for Research in Astronomy, Incorporated, under NASA contract NAS5-26555. G.B. acknowledges support from NSF grant AST-08-08133. P.G.P.-G. acknowledges support from grant AYA2012-31277. This work has made use of the Rainbow Cosmological Surveys Database, which is operated by the Universidad Complutense de Madrid (UCM), partnered with the University of California Observatories at Santa Cruz (UCO/Lick,UCSC). This work was partly supported, by MINECO grant AYA2012-32295. F.L. acknowledges support from NSFC grant 11573017.
Appendix A: Data Validation: Selection of Star-forming and Quiescent Galaxies and Their Scaling Relations
In this appendix, we study the robustness of the selection criterion to identify SFGs and quiescent galaxies. As described in Section 3.1, we distinguish between these two populations by means of a threshold in the distance of the galaxies to the star-forming sequence at each redshift ( ). This criterion has been shown to be very effective at splitting galaxy samples into two groups that accurately match known bimodalities in galaxy structure, morphology, or rest-frame colors (e.g., Maier et al. 2009; Brammer et al. 2011; Wuyts et al. 2011b). Following a similar approach to previous works, here we study the robustness of our quiescence threshold in
  by comparing to an independent color–color criterion based on rest-frame optical/NIR colors, the so-called UVJ diagram (Wuyts et al. 2007; Williams et al. 2009).
Figure 11 shows the UVJ diagram for all galaxies with  in the same four redshift bins used in Figure 1. The blue and red colors indicate SFGs and quiescent galaxies identified using the distance to the star-forming sequence criterion,
  dex. The solid black lines in the upper left of the panels depict the quiescent region of the UVJ diagram based on the redshift-dependent definitions of Whitaker et al. (2014). This figure shows that the two selection methods are largely consistent. The quiescent subsample contains fewer galaxies regardless of the selection method, and therefore it is more sensitive to variations due to contamination or incompleteness. The numbers in the bottom-left region of the diagram indicates the fraction of quiescent galaxies identified with the
  method that are not UVJ quiescent, and vice versa. These fractions are relatively small, except at the highest redshifts where the total number of quiescent galaxies is much smaller. The numbers also indicate that the
  method tends to identify as quiescent a slightly larger fraction of the galaxies at all redshifts—see the red circles near the edge of the quiescent limit. This trend is consistent with the fact that our threshold in
  is
is  below the star-forming sequence, and therefore it includes in the quiescent sample some "transition" galaxies located in what is traditionally considered the "green valley" (e.g., Bell et al. 2003). This difference is inevitable when using a binary selection; nevertheless, the information encoded in the
  gradient is not lost, as our analysis in Section 5 makes use of the transition values rather than only the binary selection. In the following, we also demonstrate that the results on the scaling relations of SFGs and quiescent galaxies are not significantly affected by using the more restrictive UVJ-quiescent criterion, which would only remove a small percentage of the
  -quiescent galaxies.

Figure 11. Rest-frame UVJ diagram (Williams et al. 2009) for the galaxies in the CANDELS/GOODS-S sample at different redshifts. The blue and red circles indicate SFGs and quiescent galaxies identified using our primary criterion based on their relative distance to the star-forming sequence at each redshift. The two criteria for selecting quiescent galaxies are largely consistent at every redshift. Only a small fraction of the galaxies, indicated by numbers in the bottom left, are identified as quiescent by only one of the criteria ( /not-UVJ, left; UVJ/not-
 , right.)
Download figure:
Standard image High-resolution imageFigure 12 shows the same structural scaling relations as a function of redshift as in Figure 2 but computed using different values for the photometric redshifts, stellar masses, rest-frame colors, and structural properties, and using the UVJ criterion to distinguish SFGs and quiescent galaxies. The purpose of this test is to verify that the best-fit values for the scaling relations listed in Table 1 are robust against different systematic effects. All the new galaxy properties used in this test are drawn from the 3D-HST catalog presented in Skelton et al. (2014) and Momcheva et al. (2016). Briefly, the 3D-HST survey provides NIR-selected catalogs in the five CANDELS fields, which include photometric redshifts and physical propeties for the same galaxies discussed in this paper. Although the values are largely consistent with those in the CANDELS catalog (see, e.g., Santini et al. 2015 or Momcheva et al. 2016 for a comparison of the redshifts and stellar masses with the CANDELS catalog), using the 3D-HST catalog provides a straightforward test of the effect of systematic uncertainties by using new values for the same set of galaxies. By fitting the density–mass distributions based on the 3D-HST data, we can assess whether the new results are consistent with our previous analysis within the confidence intervals determined from bootstrapping on the uncertainties of the galaxy's physical properties. First, we divided the sample into SFGs and quiescent galaxies (blue and red circles, respectively) using the UVJ criterion described above. Next we used different values for the physical properties to compute the best fit to the  and
and  relations for SFGs and quiescent galaxies (blue and red circles). The solid blue and red lines show the new fits compared to the dashed gray lines, which indicate the previous fits from Figure 2. The results for both relations at all redshifts are always consistent with our previous fits within the uncertainties. The largest difference is seen in the slope of the quiescent
  relation, which nonetheless exhibits the largest uncertainties. Note also that, as indicated in Section 3, for the highest redshift bin at
  , the slope of the quiescent relation is fixed to that of the
  bin, therefore limiting the impact of change due to the use different physical properties.
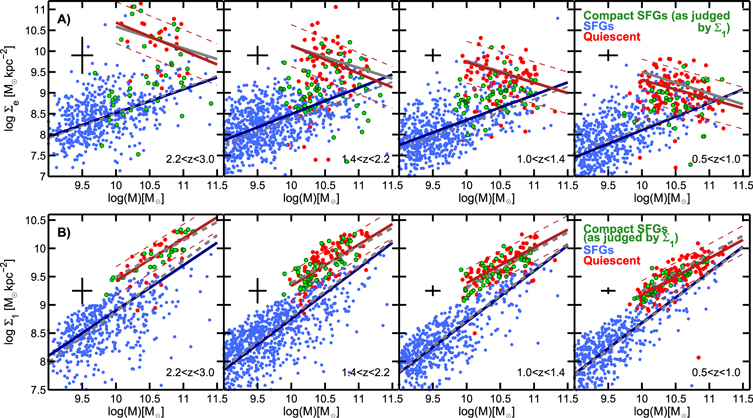
Figure 12. Same structural scaling relations as those shown in Figure 2 but using the UVJ criterion to distinguish between SFGs and quiescent galaxies and replacing the stellar mass and effective radius estimates with the equivalent values drawn from the 3D-HST survey catalogs (Skelton et al. 2014) in the same redshift bins. The gray lines indicate the best-fit scaling relations from Figure 2 to illustrate the differences with respect to the fits based on the new values (blue and red lines). Overall, we find only small differences in the best-fit values that are consistent within the errors with the values presented in Section 3.
Download figure:
Standard image High-resolution imageAppendix B: Relating and Through the Mass Profile of the Galaxy


Here we calculate in more detail the relation between  and
and  for galaxies whose mass profile are described by a Sérsic profile:

By integrating Equation (9) to r = 1 kpc we obtain

where γ is the incomplete gamma function, which depends on n and re (see, e.g., Graham et al. 2005). As shown in Figure 13, the γ function can be approximated as a second-order polynomial for a given n:

where the ci coefficients depend on the Sérsic index (Figure 11). Taking only the linear term, Equation (10) becomes

and thus the variation of  as a function of re at a constant stellar mass is

By substituting the  term in these equations with the
  –M⋆ and
  scaling relations, we obtain the relation between the slope and scatter of the
  –M⋆ relation,
  , and that of the other two. The value of
  indicates that the mass is normalized to
  so that the zero points are directly comparable to those in Table 1.

Figure 13. Ratio of the mass in the central 1 kpc to the total mass (core-to-total; C/T) as a function of the effective radius, re, and n for a single-Sérsic mass profile. The C/T ratio follows a gamma function (Equation (10)), which can be expressed as a second-order polynomial in re for different values of n (bottom-left corner; Equation (11)). The linear coefficient of those relations, c1, determines the relative values of the slope and typical scatter of the  ,
,  , and re scaling relations with stellar mass (Equation (6)). The best-fit structural relations for the quiescent galaxies,
  and
and  , agree well with one another for a Sérsic profile of n = 4 (see gray and red lines in Figure 3).
Download figure:
Standard image High-resolution imageFor a size–mass relation described as  , we obtain

For  , described as
  , and
, and  :
:
For completeness, we also derive the relation between the slopes of the  and size–mass relations:

B.1. Evolution of the Zero Points of the Scaling Relations as a Result of Size and Mass Growth
In Section 3.3, we studied the change in the  and
and  relations as a result of evolutionary processes that cause a relative change in the effective radius and stellar mass of the galaxy,
  . As shown above, the variations in
  and
and  as a result of a change in stellar mass and re are
The coefficients on the right-hand side terms can be interpreted as the slope of the evolutionary tracks in  and
and  versus mass as a result of the process η. In particular, for minor mergers (
 ), we would obtain
  and
and  (assuming that the mergers do not change the central mass), while for adiabatic expansion we obtain (
 ),
),  and
and  (assuming n = 4). Note that these relations apply to both SFGs and quiescent galaxies. However, SFGs also have ongoing star formation, which would also contribute to the change in size and mass.
Furthermore, if the evolutionary processes affect equally all galaxies lying in the  and
and  scaling relations, the slope of those relations is preserved in the evolution, and the change in the zero points of the relations in terms of the stellar mass change is

The equations above depend on the slope of the scaling relations. In Section 3.3, we discussed in particular the effect on the quiescent relations ( ,
,  ). For a minor merger scenario (
 ), we obtain
  and
and  (assuming again that the mergers do not change the central mass). For adiabatic expansion (
 ), we obtain
  and
and  (assuming n = 4).
Appendix C: PSF Correction to the Estimate of the Mass Surface Densities Within the Central 1 kpc
The PSF of the HST/F160W imaging sets the minimum resolution element that we are able to resolve. For a half width at half maximum of HWHM = 009, the galaxy profiles have an intrinsic spatial resolution ranging from  within the redshift range of the sample and thus resolve the inner 1 kpc of the galaxies. However, part of the light is smeared to a larger radius. To correct for this effect, we estimate a size- and Sérsic-index-dependent correction to the mass profile within 1 kpc.
We estimate this correction by comparing the observed growth curves for all galaxies in our sample measured on concentric, elliptical apertures using IRAF/ellipse (Liu et al. 2016; F. Liu et al. 2017, in preparation) and the deconvolved growth curves estimated from the best GALFIT results for each galaxy in the F160W band from van der Wel et al. (2014). The correction is determined using the following formula:
Then the surface density is determined as  . The value of
  is therefore similar to the one obtained by integrating directly the F160W Sérsic profile and scaling the integrated luminosity within the central 1 kpc using a galaxy-averaged mass-to-light (M/L) ratio. The difference arises because we estimate
  by integrating the mass profile within
  determined by running an SED-fitting code on the multiwavelength surface brightness profiles. If galaxies exhibit only weak color gradients (e.g.; Szomoru et al. 2011, 2012), the results would be similar because the galaxy-averaged M/L would be similar to the (M/L)
 determined with our method. However, for galaxies with a more prominent color gradient (e.g., red bulge+blue disk) our method provides a first-order correction by measuring an M/L that is closer to the critical region that we are studying.
Figure 14 shows the distribuion of values of  as a function of Sérsic index and re (color bar). At each redshift, we model the dependence of
  on the Sérsic index using a fifth-order polynomial, and we chose three bins in re that cover approximately the whole parameter space. The coefficients of these polynomials are given in Table 2. Figure 14 also shows that the redshift dependence of the correction is weak at
  . At lower redshifts, the shape of the distribution is very similar but the correction becomes smaller, as expected given the increase in the intrinsic resolution of the galaxy profiles as the scale factor decreases with time, and we are able to probe the central regions with better spatial resolution.
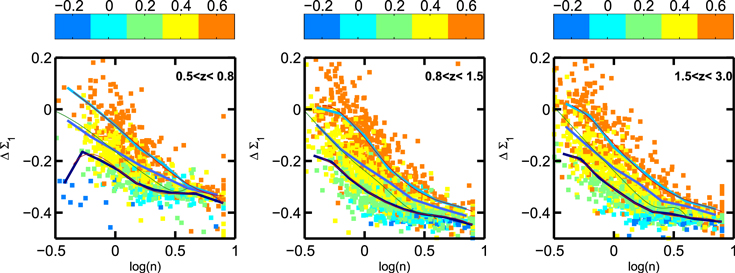
Figure 14. Correction to the  values, determined from multiband photometry measured in concentric elliptical apertures, due to PSF effects. The smearing effect of the PSF depends on both the Sérsic index and the effective radius (see color bar in
  ) of the galaxies being larger for higher concentrations and smaller sizes. The solid lines indicate the best fit to the Δ
 dependence with Sérsic in three different size bins using fifth-order polynomials (see Table 2). The similar distribution at
  and
and  indicates that the correction is only weakly dependent on redshift at
  .
.
Download figure:
Standard image High-resolution image
Table 2. Polynomial Fits

|
a0 | a1 | a2 | a3 | a4 | a5 |
|---|---|---|---|---|---|---|

|
0.1341 | −1.5082 | 1.6952 | −0.1720 | −0.3637 | −0.2235 |

|
−0.0147 | 0.1541 | −0.0712 | 0.0323 | −0.2623 | −0.1616 |

|
−0.0124 | 0.1175 | 0.0720 | −0.0472 | −0.3946 | −0.0640 |

|
a0 | a1 | a2 | a3 | a4 | a5 |

|
0.0471 | −0.5231 | 0.5043 | 0.1884 | −0.3735 | −0.3054 |

|
0.0099 | −0.1131 | 0.1328 | 0.1440 | −0.3680 | −0.2261 |

|
0.0421 | −0.4842 | 0.6341 | 0.0363 | −0.5126 | −0.1333 |
Note. Coefficients of the best-fit fifth-order polynomial to the Δ correction as a function of the Sérsic index, in three bins of effective radius, re(kpc), i.e.,
  = a0 + a1 log(n) + a2 log(n)2 + a3 log(n)3 + a4 log(n)4 + a5 log(n)5.
Download table as: ASCIITypeset image
Footnotes
- 13
In this case, we denote dry mergers by the more narrow concept of nearly binary mergers between gas-poor but already quenched galaxies, as opposed to other interactions involving low gas fractions that could fuel weak star formation.