


Abstract
Previous findings show that massive ( ) star-forming (SF) galaxies usually have an "inside-out" stellar mass assembly mode. In this paper, we have for the first time selected a sample of 77 massive SF galaxies with an "outside-in" assembly mode (called the "targeted sample") from the Mapping Nearby Galaxies at the Apache Point Observatory (MaNGA) survey. For comparison, two control samples are constructed from the MaNGA sample matched in stellar mass: a sample of 154 normal SF galaxies and a sample of 62 quiescent galaxies. In contrast to normal SF galaxies, the targeted galaxies appear to be smoother and more bulge-dominated and have a smaller size and higher concentration, star formation rate, and gas-phase metallicity as a whole. However, they have a larger size and lower concentration than quiescent galaxies. Unlike the normal SF sample, the targeted sample exhibits a slightly positive gradient of the 4000 Å break and a pronounced negative gradient of Hα equivalent width. Furthermore, the median surface mass density profile is between those of the normal SF and quiescent samples, indicating that the gas accretion of quiescent galaxies is not likely to be the main approach for the outside-in assembly mode. Our results suggest that the targeted galaxies are likely in the transitional phase from normal SF galaxies to quiescent galaxies, with rapid ongoing central stellar mass assembly (or bulge growth). We discuss several possible formation mechanisms for the outside-in mass assembly mode.
Export citation and abstract BibTeX RIS
1. Introduction
Thanks to a large number of imaging and spectroscopic surveys, the knowledge of galaxies has drastically increased in the past two decades. Galaxies are mainly separated into two types according to their bimodality of color: star-forming (SF) galaxies and quiescent galaxies (e.g., Baldry et al. 2004; Bell et al. 2004; Blanton et al. 2005). The SF galaxies typically have ongoing star formation with disklike morphology, while red quiescent galaxies typically have no or very weak star formation with bulge-dominated morphology (Strateva et al. 2001; Kauffmann et al. 2003a; Baldry et al. 2004; Brinchmann et al. 2004; Li et al. 2006; Muzzin et al. 2013; Barro et al. 2017). However, the spatially resolved stellar mass assembly histories of galaxies are still poorly understood.
Galaxies appear to assemble their stellar mass mainly in two distinct modes: "inside-out" and "outside-in" (Pérez et al. 2013; Li et al. 2015; Ibarra-Medel et al. 2016; Pan et al. 2016; Goddard et al. 2017). In the inside-out assembly mode, star formation cessation occurs first in the galactic center with respect to the outskirts, which may be due to active galactic nucleus feedback (e.g., Kauffmann et al. 2004; Bower et al. 2006; Fabian 2012; Bournaud et al. 2014; Dekel & Burkert 2014), "morphological quenching" (Martig et al. 2009), or environmental effects (e.g., Gunn & Gott 1972; Moore et al. 1996; Conselice et al. 2003; Cox et al. 2006; Cheung et al. 2012; Smethurst et al. 2015; Wang et al. 2015). This inside-out stellar mass assembly mode has been found in massive disk/SF galaxies ( ) at both low and high redshift (e.g., Muñoz-Mateos et al. 2007; Sánchez-Blázquez et al. 2007; Bezanson et al. 2009; Patel et al. 2013; Pérez et al. 2013; van de Sande et al. 2013; Tacchella et al. 2015). For less massive galaxies (
 ), the main galaxy assembly mode is very different and may be better interpreted as an outside-in scenario (Bernard et al. 2007; Gallart et al. 2008; Zhang et al. 2012; Pérez et al. 2013; Pan et al. 2015).
Recently, several large integral field spectroscopy (IFS) surveys have been performed, such as  (Cappellari et al. 2011), Calar Alto Large Integral Field Area (CALIFA;Sánchez et al. 2012), utilizing the Sydney Australian Astronomical Observatory Multi-object Integral Field Spectrograph (SAMI; Bryant et al. 2015), and Mapping Nearby Galaxies at the Apache Point Observatory (MaNGA; Bundy et al. 2015), that enable people to study the spatially resolved mass assembly histories of galaxies. By applying the fossil record method to 105 CALIFA galaxies, Pérez et al. (2013) found that the spatially resolved stellar mass assembly pattern of local galaxies depends on the global stellar mass. Specifically, massive galaxies grow their stellar mass inside-out, while less massive galaxies show a transition to outside-in growth. In agreement with this, Pan et al. (2015) proposed that the typical galaxy assembly mode is transitioning from outside-in to inside-out from low to high stellar masses, indicated by the
  color gradients of ∼10,000 low-redshift galaxies. By analyzing 533 galaxies selected from MaNGA, Ibarra-Medel et al. (2016) generated the global and radial stellar mass growth histories with the fossil record method and confirmed that the massive SF galaxies, on average, show a pronounced inside-out mass assembly mode. They also found that the less massive galaxies show diverse mass assembly histories, with periods of both outside-in and inside-out modes. González Delgado et al. (2015, 2016) generated maps of the mean stellar age and metallicity for 416 galaxies from CALIFA and found that the negative gradients of light-weighted stellar age are consistent with the inside-out growth of galaxies, especially for Sb-Sbc galaxies. These findings agree well with the negative stellar age gradients for massive SF galaxies (e.g., Wang et al. 2011; Lin et al. 2013; Li et al. 2015; Dale et al. 2016; Goddard et al. 2017).
In this paper, we select for the first time a small but significant fraction (∼14%) of massive SF galaxies ( < 5) with a recent outside-in mass assembly mode from the MaNGA released data (SDSS Collaboration et al. 2016). These galaxies are selected to have a higher 4000 Å break at the 1.5 times effective radius (
 ) than at the galaxy center. The 4000 Å break is commonly used to indicate recent star formation histories within 2 Gyr (Bruzual & Charlot 2003; Kauffmann et al. 2003a). For comparison, we build two control samples matched in stellar mass.
This paper is organized as follows. In Section 2, we describe the data we used and the sample selection. We present our results in Section 3, including the global properties, resolved star formation histories, and environments of the targeted sample and two control samples. In Section 4, we discuss the possible formation mechanisms of the targeted galaxies and the implication of star formation quenching based on our results. We summarize our results in Section 5. Throughout this paper, all the distance-dependent parameters are computed with  ,
,  , and
, and  .
.
2. Data
2.1. MaNGA Data Overview
Our main sample is the MaNGA released data, including 1390 galaxies, which enables us to select a sample of massive SF galaxies with the outside-in assembly mode. Here we briefly introduce the MaNGA data. A full description of both observations and data reduction are presented in Bundy et al.(2015).
The MaNGA project is an ongoing large IFS survey aimed at mapping 10,000 nearby galaxies with redshifts from 0.01 to 0.14. The MaNGA instrument covers a wavelength range from 3600 to 10300 Å at a typical resolution R ∼ 2000. The absolute flux calibration is better than 5% for more than 89% of the MaNGA wavelength range (Yan et al. 2016). The raw data were reduced using the MaNGA Data Reduction Pipeline, which was developed by Law et al. (2015).
The MaNGA released sample is mainly composed of the "primary" (∼2/3) and "secondary" (∼1/3) samples (SDSS Collaboration et al. 2016), which are defined by two radial coverage goals: the former of 1.5 , and the latter of 2.5
 . The released data cubes have a spaxel size of 0
 5, and the typical effective spatial resolution can be described by a Gaussian with an FWHM ∼ 25.
2.2. Spectral Fitting
The spectral fitting methods and parametric measurements are described in Li et al. (2015). Here we briefly summarize the fitting procedure and the measurements of the referred parameters. To fit the continuum, we adopt the χ2 minimization fitting method developed by Li et al. (2005) that can carefully mask the emission-line regions by iteration. The templates we use are galactic eigenspectra generated by the principal component analysis method. This fitting code is efficient and stable, even for spectra with low signal-to-noise ratios (S/Ns). However, this code cannot fit the line-of-sight velocity automatically. Thus, we use the line-of-sight velocity measured by the public code, STARLIGHT (Cid Fernandes et al. 2005), as input for each spectrum. The templates used in STARLIGHT fitting are 45 single stellar populations from Bruzual & Charlot (2003) with a Chabrier (2003) initial mass function. The intrinsic stellar extinction law is from Cardelli et al. (1989) in both fittings. For each galaxy, we perform the spectral fitting to the spaxels separately without a binning scheme. Spectra with the continuum S/N < 5 at 5500 Å are not included in the analysis in this work.
We use the 4000 Å break (Dn(4000)) and the Hδ absorption (EW(HδA)) and Hα emission (EW(Hα)) equivalent widths to trace the recent star formation histories (Bruzual & Charlot 2003; Kauffmann et al. 2003a; Li et al. 2015), since these parameters are more model-independent than the mean stellar age and star formation rate (SFR). Here Dn(4000) and the HδA index are measured based on the best-fitting spectra, while EW(Hα) is measured based on the stellar component-subtracted spectrum by fitting a Gaussian profile to the Hα emission lines. A full description of the spectral fitting and parametric measurements are presented in Li et al. (2015).
2.3. Sample Selection
In previous works, galaxies were usually separated according to their global properties, such as SFR, stellar mass, and color. The IFS surveys show that different regions of galaxies can have very different star formation properties, suggesting that only using global parameters is not enough. Thanks to the IFS survey MaNGA, we are able for the first time to select the galaxies with an outside-in mass assembly mode and study their global and resolved properties.
We use the 4000 Å break to select the targeted galaxies. The 4000 Å break is defined as the ratio of the flux in the red continuum to that in the blue continuum at the 4000 Å wavelength (Balogh et al. 1999; Brinchmann et al. 2004). The Dn(4000) has been widely used to trace the mean stellar ages of stellar populations younger than 1–2 Gyr. We note that mass assembly histories can be diverse in different periods (Ibarra-Medel et al. 2016), and the mass assembly mode referred to in this work is the recent assembly mode (<2 Gyr).
The targeted sample was selected from the SDSS-IV MaNGA released sample (SDSS Collaboration et al. 2016), which contains 1390 galaxies with 0.01 < z < 0.14. Since we are just interested in massive galaxies with an outside-in assembly mode, the sample was required (1) to have  > 9.8, (2) to have a larger 4000 Å break in the 1.5
 radial bin (
 ) than in the center (
 ), and (3) to consist of SF galaxies or partially SF galaxies (
 < 5). The reason that we used
  rather than
  and
and  < 5 rather than
  < 4 is so that we could select more galaxies. This is useful for measuring the clustering properties of our sample in Section 3.4. In addition, we excluded mergers and heavily disturbed galaxies by visual inspection. In total, 77 galaxies were selected according to the above criteria, accounting for 14% of all galaxies with
  > 9.8 and
  < 5.
< 5.
For comparison, we built two control samples closely matched in stellar mass with the targeted sample but not in outside-in assembly mode. The control samples were randomly selected from the MaNGA released sample with several criteria. We call them the blue control (BC) sample and red control (RC) sample. The BC sample was selected to have  >
>  and
and  < 5, while the RC sample was selected to have
  > 5. In total, 154 BC galaxies and 62 RC galaxies were selected.
Since we do not limit the galaxy inclination in the sample selection, 12 out of 77 targeted galaxies have an inclination angle greater than 70°, based on the minor-to-major axis ratio from the NASA-Sloan Atlas (NSA). One may worry that the measurements of Dn(4000) are heavily affected by the dust extinction for these highly inclined galaxies, which may pollute the identification of targeted galaxies. We have checked the Dn(4000) and  profiles of these highly inclined galaxies and found that they exhibit positive Dn(4000) gradients and prominently negative
  gradients in general. The measurements of EW(Hα) are not sensitive to the dust extinction, which confirms that these highly inclined galaxies are in the outside-in assembly mode. In addition, we have reproduced our main results while excluding these highly inclined galaxies and found that the basic results are not changed. Thus, we keep these highly inclined galaxies in this paper.
The left and middle panels of Figure 1 show the targeted sample (green circles), BC sample (blue crosses), and RC sample (red triangles) on the diagrams of  versus
  and
and  versus
  . For comparison, we plot all MaNGA galaxies with
  as gray circles in these two panels. The right panel shows the fraction of our targeted galaxies with respect to massive SF galaxies (
 < 5 and
  ) as a function of stellar mass. The errors are estimated by the bootstrap method. The fraction of targeted galaxies has a peak at
  and drops heavily at
  .
.

Figure 1. Sample selection. Left: comparison between the 4000 Å break at galactic center and at the 1.5 radial bin. Middle panel: comparison between
  at galactic center and at the 1.5
  radial bin. In both panels, the green circles, blue crosses, and red triangles represent the targeted galaxies, BC galaxies, and RC galaxies, respectively; the red solid line is a one-to-one line. For comparison, we plot all MaNGA galaxies as gray circles. Right panel: fraction of the targeted galaxies in SF galaxies (
 < 5) as a function of stellar mass. The errors are estimated by the bootstrap method.
Download figure:
Standard image High-resolution imageAs shown in Figure 1, these three samples are well separated in the diagrams of  –
– and
and  –
– . Most galaxies have a higher 4000 Å break in their centers than in their 1.5
 radial bins, which is consistent with the previous findings of inside-out assembly mode for massive galaxies (Pérez et al. 2013; Pan et al. 2015; Goddard et al. 2017). However, we do see a small fraction of massive SF galaxies with
  <
<  , shown by green circles in the figure. As expected, they have larger
  in their centers than in their 1.5
 radial bins, indicating the dramatic ongoing star formation activity in their centers. In contrast, the BC galaxies have a larger 4000 Å break and smaller EW(Hα) in their centers than in their 1.5
 radial bins, representing a normal SF population. The RC galaxies show no or very weak star formation activity, representing a quiescent population. They have a larger 4000 Å break and smaller EW(Hα) in both their centers and their 1.5
 radial bins than the targeted and BC galaxies.
Examples of a BC galaxy (top row), targeted galaxy (middle row), and RC galaxy (bottom row) are shown in Figure 2. In each row, the columns represent the SDSS color image, 4000 Å break, HδA index, and  maps of the shown galaxy. The hexagon in each panel displays the area covered by IFS bundles. Here HδA is the Lick/IDS index of the Hδ absorption line (Worthey & Ottaviani 1997), and
  is the logarithm of the Hα emission line equivalent width. These three parameters are good indicators of recent star formation histories (Bruzual & Charlot 2003; Kauffmann et al. 2003a; Li et al. 2015). The HδA index traces the star formation that occurred 0.1–1 Gyr ago, and EW(Hα) traces the strength of very recent (within 50 Myr) or ongoing star formation activity.

Figure 2. Examples of two-dimensional maps of SDSS images and diagnostic parameters. The top row shows an example of a galaxy in the BC sample with the inside-out assembly mode. The middle row shows an example of a galaxy in the targeted sample with the outside-in assembly mode. The bottom row shows an example of a galaxy in the RC sample. In each row, the columns show the SDSS color image, 4000 Å break, HδA index, and  maps (left to right). The hexagons represent the area covered by IFS bundles for each galaxy.
Download figure:
Standard image High-resolution imageAs shown in Figure 2, the two-dimensional star formation properties of the targeted galaxy (3704@8618, the galaxy located on plate 8618 with a bundle ID of 3704) and the BC galaxy (6101@8256) are significantly different. The BC galaxy has a higher Dn(4000), lower HδA index, and  in its center rather than its outer regions. The star formation activity has already been shut down in its center, where a bulge and bar can be seen. According to its
  map, ongoing star formation activity can be seen at its outer regions. In contrast, the targeted galaxy (3704@8618) has a lower Dn(4000), higher HδA index, and
  in its center rather than its outer regions. It has a smooth morphology without spiral arms seen from the SDSS color image. It has strong star formation activity in its center, while very weak star formation activity is shown in its outer regions. The RC galaxy (3701@8440) is a quiescent galaxy with no prominent Hα emission lines.
3. Results
3.1. Global Properties
In the previous section, we selected the galaxies with a recent outside-in mass assembly mode. Now questions arise as to whether their global properties, such as size, structure, SFR, and metal abundance, are different from those of control galaxies.
Figure 3 shows the comparison of the global properties of the targeted sample and two control samples. These four panels show the stellar mass versus size, concentration ( ), SFR, and gas-phase metallicity for the targeted sample (green circles), BC sample (blue crosses), and RC sample (red triangles). The measurements of these four parameters for the targeted galaxies are listed in Table 1. In the bottom right panel of the figure, only the targeted and BC samples are shown, because the gas-phase metallicity is computed using emission lines and RC galaxies usually do not have prominent emission lines. In the top left panel, the blue and red curves represent the mass–size relation for late-type galaxies (Sérsic n < 2.6) and early-type galaxies (Sérsic n > 2.6) taken from Shen et al. (2003). The gray dashed lines represent a constant stellar mass surface density of
  , 108, 109, and 1010
  kpc−2 (top left to bottom right). In the bottom left panel, the gray solid line shows the star formation main sequence taken from Chang et al. (2015), and the gray dashed lines show the 14%−84% region. In the bottom right panel, the black solid line shows the mass–metallicity relation taken from Tremonti et al. (2004), and the black dashed lines show the 1σ region.

Figure 3. Comparison of global properties for the targeted sample and two control samples. The four panels show the stellar mass vs. size, concentration, SFR, and gas-phase metallicity for the targeted sample (green circles), BC sample (blue crosses), and RC sample (red triangles). We also present the distribution of the four parameters for the three samples. The K-S test probabilities for the difference in size, concentration, SFR, and gas-phase metallicity between the targeted sample and the BC and RC samples are denoted in the top right corner of each panel. For comparison, a volume-limited sample selected from NSA is shown by the background contours in all panels except the bottom right one. In the top left panel, the blue and red curves represent the mass–size relation for late-type galaxies (Sérsic n < 2.6) and early-type galaxies (Sérsic n > 2.6) taken from Shen et al. (2003). The gray dashed lines represent a constant surface mass density of  , 108, 109, and 1010
  kpc−2 (top left to bottom right). In the bottom left panel, the gray solid line shows the star formation main sequence taken from Chang et al. (2015), and the gray dashed lines show the 14%–84% region. In the bottom right panel, the black solid line shows the mass–metallicity relation taken from Tremonti et al. (2004), and the black dashed lines show the 1σ region.
Download figure:
Standard image High-resolution imageTable 1. List of Targeted Galaxies
| IDa | R.A. | Decl. | log10M* | Re | log10SFR | Zgas | B/Tb | Bar/Unbarc | Morphologyc | Dpd |
|---|---|---|---|---|---|---|---|---|---|---|
| (J2000.0) | (J2000.0) | ( ) ) |
(kpc) | ( ) ) |
(kpc) | |||||
| 7443–12701 | 15:22: 1.79 | 43:31:56.4 | 10.0 | 1.58 | −1.4 | 8.96 | 0.33 | unbar | smooth | ⋯ |
| 8257–12701 | 11:01:59.00 | 45:13:40.9 | 10.7 | 3.55 | 0.8 | 9.11 | ⋯ | unbar | disk | 125 |
| 8465–12701 | 13:03:53.56 | 47:23:11.2 | 10.3 | 4.16 | 0.2 | 9.04 | 0.17 | bar | disk | 139 |
| 8318–12702e | 13:05:46.57 | 46:27:42.7 | 10.5 | 6.13 | 0.1 | 9.08 | 0.01 | ⋯ | disk | ⋯ |
| 8138–12703 | 07:45:33.53 | 45:46:20.4 | 11.1 | 6.65 | −0.9 | 9.10 | ⋯ | bar | disk | 159 |
| 8312–12703 | 16:28:50.17 | 39:50: 6.3 | 10.7 | 5.51 | 0.5 | 9.17 | 0.04 | unbar | disk | ⋯ |
| 8550–12703 | 16:30:41.86 | 40:31:45.8 | 10.6 | 4.91 | 0.2 | 9.16 | 0.25 | bar | disk | 41 |
| 7962–12704 | 17:23:31.94 | 27:27:31.4 | 10.2 | 3.48 | −0.1 | 9.06 | 0.16 | unbar | disk | ⋯ |
| 8253–12704e | 10:36:36.79 | 43:30:24.4 | 10.2 | 3.08 | −1.0 | 9.17 | 0.05 | ⋯ | smooth | ⋯ |
| 8312–12704 | 16:29:12.99 | 41:09: 3.1 | 10.5 | 4.30 | −0.3 | 9.21 | 0.26 | bar | disk | 110 |
| 8448–12704e | 11:06:57.52 | 22:50: 8.9 | 10.0 | 2.89 | −0.2 | 9.03 | 0.00 | ⋯ | disk | 107 |
| 8603–12704 | 16:31:34.53 | 40:33:56.2 | 10.9 | 4.52 | 0.5 | 9.19 | ⋯ | unbar | disk | 79 |
| 8315–12705 | 15:43:40.92 | 39:32:25.3 | 10.8 | 7.88 | 0.9 | 9.06 | 0.20 | unbar | disk | ⋯ |
| 8466–12705f | 11:25:12.46 | 45:04: 0.4 | 10.2 | 4.72 | −0.3 | 8.59 | 0.06 | unbar | disk | ⋯ |
| 8551–12705 | 15:35:45.82 | 44:50: 5.3 | 10.6 | 5.20 | 0.7 | 9.00 | 0.22 | unbar | disk | 49 |
| 8082−1901 | 03:13:15.16 | −00:05:38.1 | 10.2 | 1.27 | −1.7 | 9.03 | 0.94 | unbar | smooth | ⋯ |
| 8143−1901 | 07:54:38.45 | 42:32:38.8 | 10.1 | 1.27 | −0.3 | 9.15 | 0.36 | unbar | smooth | ⋯ |
| 8249−1901g | 09:08:52.64 | 44:55:56.2 | 9.9 | 1.27 | 0.0 | 8.99 | 0.72 | unbar | smooth | ⋯ |
| 8253−1901 | 10:32: 4.09 | 43:51:33.4 | 10.5 | 2.04 | −0.6 | 9.09 | 0.80 | unbar | smooth | 130 |
| 8325−1901 | 14:11:11.16 | 46:23:26.0 | 10.1 | 1.14 | −3.3 | 9.08 | 0.54 | unbar | smooth | ⋯ |
| 8452−1901h | 10:23:32.53 | 46:03:27.9 | 10.0 | 1.95 | −1.2 | 8.93 | 0.61 | unbar | smooth | ⋯ |
| 8453−1901 | 10:13:27.73 | 47:30:58.4 | 10.0 | 1.38 | −1.4 | 9.03 | 0.32 | unbar | smooth | ⋯ |
| 8485−1901 | 15:30:10.73 | 48:41:24.7 | 9.9 | 1.07 | −0.2 | 9.16 | 0.87 | unbar | smooth | ⋯ |
| 7990−1902 | 17:38: 5.40 | 57:07: 5.4 | 10.7 | 1.84 | 0.5 | 9.22 | 0.88 | unbar | smooth | 80 |
| 8254−1902g | 10:52:52.59 | 43:25:42.3 | 10.1 | 1.13 | −0.1 | 9.26 | 0.75 | unbar | smooth | 42 |
| 8259−1902 | 11:51:11.07 | 44:00:31.6 | 9.8 | 1.11 | −0.5 | 9.19 | 0.10 | unbar | smooth | ⋯ |
| 8464−1902 | 12:25:36.21 | 45:05: 1.9 | 10.9 | 2.31 | −0.2 | 9.07 | 0.96 | unbari | smoothi | ⋯ |
| 8482−1902 | 16:12:24.62 | 48:31:47.6 | 10.8 | 3.92 | −0.2 | 9.21 | 0.36 | bar | disk | 110 |
| 8552−1902 | 15:07:50.95 | 43:31:21.7 | 10.1 | 1.53 | −1.2 | 9.08 | 0.49 | unbar | smooth | 85 |
| 8263−3701 | 12:19: 3.44 | 46:06:24.5 | 10.0 | 1.82 | −0.3 | 9.18 | 0.13 | unbar | smooth | ⋯ |
| 8332−3701 | 13:55: 5.68 | 42:56:50.5 | 11.0 | 3.38 | ⋯ | 9.15 | 0.94 | unbari | smoothi | 48 |
| 8550−3701 | 16:26:36.65 | 39:51:31.2 | 10.3 | 2.00 | 0.2 | 9.23 | 0.34 | unbar | smooth | 41 |
| 8554−3701g | 12:12: 1.90 | 35:24:15.8 | 10.0 | 1.98 | −0.4 | 9.11 | 0.27 | unbar | smooth | ⋯ |
| 7815−3702 | 21:11:36.77 | 11:29:49.0 | 10.3 | 2.11 | 0.3 | 9.16 | 0.32 | unbari | diski | ⋯ |
| 8244−3702 | 08:47:15.60 | 51:14:44.9 | 10.1 | 2.61 | 0.2 | 9.12 | 0.12 | unbar | disk | ⋯ |
| 8249−3702 | 09:08: 7.84 | 45:55:15.5 | 9.9 | 1.71 | −0.1 | 8.96 | 0.44 | unbar | smooth | ⋯ |
| 8312−3702 | 16:28:58.87 | 41:15:18.9 | 10.2 | 2.80 | −1.1 | 9.15 | 0.31 | unbar | smooth | 70 |
| 8143−3703 | 08:02:33.56 | 42:23:33.7 | 10.2 | 2.25 | −0.9 | 8.92 | 0.43 | unbar | smooth | ⋯ |
| 8249−3703 | 09:18:52.91 | 45:43:40.0 | 10.0 | 2.45 | −0.3 | 9.10 | 0.29 | unbar | smooth | 160 |
| 8253−3703 | 10:29:22.46 | 43:10:14.1 | 10.1 | 1.99 | 0.1 | 9.12 | 0.01 | unbar | smooth | ⋯ |
| 8257−3703 | 11:06:37.37 | 46:02:19.6 | 10.4 | 2.17 | 0.9 | 9.26 | 0.36 | bar | disk | 26 |
| 8606−3703 | 17:03:23.63 | 37:37:56.9 | 10.5 | 2.44 | −4.3 | 9.16 | 0.42 | unbar | smooth | 60 |
| 8083−3704 | 03:25: 8.34 | −00:32:41.8 | 9.9 | 1.65 | −2.8 | 9.20 | 0.88 | unbar | smooth | ⋯ |
| 8252−3704g | 09:41:13.95 | 47:41:19.0 | 10.5 | 2.71 | 0.7 | 9.23 | 0.43 | unbar | smooth | ⋯ |
| 8259−3704 | 11:58:22.39 | 43:48:55.0 | 10.9 | 3.54 | 0.7 | 9.21 | 0.98 | unbar | smooth | ⋯ |
| 8263−3704 | 12:26:13.49 | 45:32:19.4 | 9.9 | 2.29 | −2.1 | 9.09 | 0.97 | unbar | smooth | ⋯ |
| 8332−3704e,g | 13:58:33.55 | 41:43:27.1 | 10.1 | 1.80 | −0.5 | 9.14 | 0.18 | ⋯ | smooth | 178 |
| 8453−3704 | 10:17:55.40 | 46:36:11.8 | 10.1 | 2.25 | 0.4 | 9.12 | 0.49 | unbar | smooth | ⋯ |
| 8554−3704 | 12:18:29.57 | 35:37:20.1 | 10.6 | 3.32 | 0.3 | 9.21 | 0.78 | unbar | smooth | 81 |
| 8618−3704 | 21:15:26.95 | 09:45:28.1 | 10.9 | 3.17 | 0.7 | 9.24 | 0.94 | unbari | smoothi | ⋯ |
| 7990−6101 | 17:24: 9.48 | 56:52:28.1 | 9.9 | 2.52 | −1.4 | 9.13 | 0.19 | unbar | smooth | 47 |
| 8138−6101 | 07:43:51.36 | 44:43:27.6 | 10.3 | 2.53 | −0.0 | 9.17 | 0.10 | unbar | smooth | ⋯ |
| 8249−6101 | 09:10:14.99 | 46:17:35.8 | 10.3 | 2.76 | 0.1 | 9.15 | 0.27 | bar | disk | ⋯ |
| 8250−6101 | 09:15: 0.76 | 42:01:27.8 | 10.4 | 2.75 | 1.0 | 9.14 | 0.58 | bar | disk | 60 |
| 8320−6101 | 13:46:30.61 | 22:42:21.7 | 10.4 | 2.88 | −0.2 | 9.22 | 0.28 | unbar | disk | 48 |
| 7443−6102 | 15:26:25.61 | 42:21:14.5 | 10.5 | 2.92 | ⋯ | 9.14 | ⋯ | unbari | diski | ⋯ |
| 8312−6102 | 16:25:38.67 | 40:05:55.8 | 10.7 | 2.32 | −0.3 | 9.11 | 0.50 | unbar | disk | 105 |
| 8318−6102 | 13:08:57.44 | 45:54:19.6 | 11.5 | 9.76 | ⋯ | 9.04 | 0.48 | unbar | smooth | ⋯ |
| 8326−6102h | 14:20: 4.30 | 47:07:16.8 | 11.1 | 4.27 | ⋯ | 9.25 | 0.55 | bar | disk | ⋯ |
| 8439−6102 | 09:31: 6.76 | 49:04:47.1 | 10.8 | 3.29 | 1.3 | 9.22 | 0.42 | bar | disk | ⋯ |
| 8618−6102h | 21:16:24.77 | 10:16:24.2 | 10.3 | 1.72 | −1.6 | 8.99 | 0.33 | unbari | smoothi | ⋯ |
| 8082−6103 | 03:19: 7.72 | 00:57:21.5 | 10.0 | 2.55 | 0.0 | 9.01 | 0.43 | unbar | disk | 175 |
| 8261−6103 | 12:06:11.03 | 45:08:57.1 | 11.1 | 3.90 | 0.6 | 9.24 | 0.61 | unbar | disk | ⋯ |
| 8448−6103 | 11:06:31.53 | 22:46:39.5 | 10.2 | 1.81 | −0.7 | 9.01 | 0.46 | unbar | disk | 146 |
| 7815−6104h | 21:16:46.34 | 11:02:37.5 | 10.8 | 7.55 | ⋯ | 9.01 | 0.40 | unbari | diski | ⋯ |
| 7990−6104 | 17:26:25.83 | 58:35:19.9 | 10.3 | 3.37 | 0.4 | 9.01 | 0.36 | unbar | disk | 113 |
| 7992−6104 | 17:01: 7.08 | 64:40:36.8 | 10.3 | 3.37 | 0.4 | 9.20 | 0.13 | bar | disk | ⋯ |
| 8250−6104 | 09:21:38.74 | 43:43:34.1 | 10.7 | 4.25 | ⋯ | 9.21 | 0.00 | unbari | diski | ⋯ |
| 8548−6104 | 16:22:59.37 | 46:40:31.2 | 10.4 | 2.75 | 0.5 | 9.18 | 0.21 | bar | smooth | ⋯ |
| 7990–9101 | 17:19: 1.32 | 57:10:24.6 | 10.1 | 3.03 | −0.6 | 9.18 | 0.03 | bar | disk | 150 |
| 8481–9101 | 15:44:36.61 | 54:12:33.6 | 11.0 | 5.65 | −1.2 | 9.27 | 0.81 | unbar | smooth | ⋯ |
| 8549–9101 | 16:09: 6.35 | 46:40:16.3 | 11.3 | 7.69 | −0.9 | 9.09 | 0.76 | unbar | smooth | 155 |
| 8243–9102 | 08:43:17.22 | 52:45:28.5 | 11.5 | 7.85 | −3.4 | 9.22 | 0.60 | unbar | smooth | 95 |
| 8465–9102 | 13:12:45.40 | 46:56: 6.0 | 10.5 | 4.15 | 0.1 | 9.26 | 0.32 | unbar | disk | 73 |
| 8550–9102 | 16:28:50.17 | 39:50: 6.3 | 10.7 | 5.51 | 0.5 | 9.16 | 0.04 | unbar | disk | ⋯ |
| 8604–9102f | 16:25:49.28 | 40:20:42.8 | 10.2 | 3.40 | 0.9 | 8.44 | 0.45 | unbar | disk | 59 |
| 8606–9102f | 17:02:50.17 | 36:42:24.3 | 10.1 | 3.64 | 0.6 | 8.46 | 0.20 | bar | disk | 91 |
Notes. Properties of targeted galaxies. From left to right, the columns represent galaxy ID, right ascension, declination, base-10 logarithm of stellar mass, half-light radius, base-10 logarithm of SFR, gas-phase metallicity, bulge-to-total ratio, hosting a bar or not, disklike or smooth, and projected distance to the nearest neighbor.
a ID of the galaxies, composed of the plate ID and IFS bundle ID. bBulge-to-total fraction based on the SDSS g band (Simard et al. 2011). cBar or unbar and disklike or smooth from Galaxy Zoo 2 (Willett et al. 2013). dProjected distance from the nearest neighbor. Values of Dp greater than 200 kpc are not shown. eHighly inclined galaxies with an inclination angle greater than 75° (Blanton et al. 2005). We note that two of them are classified as smooth, suggesting that the morphological classification in the galaxy zoo may not be reliable for individual sources. However, it is fine to use the catalog to do statistics. fOutliers with very low metallicity in the bottom right panel of Figure 3. g Counter-rotators with kinematically misaligned gas and stars in Chen et al. (2016). h Seyfert galaxies classified by Baldwin, Phillips, and Terlevich (BPT) diagram (Baldwin et al. 1981). i Visual classifications for galaxies not matched in the galaxy zoo catalog.For comparison, a volume-limited sample selected from the NSA (Blanton et al. 2011) is shown by the background contours in all panels of Figure 3 except the bottom right one. The volume-limited sample was selected to have an r-band magnitude brighter than −19.5 and a redshift between 0.01 and 0.055. We also present the distributions of the four parameters for the three samples (except for the gas-phase metallicity distribution of the RC sample). According to the distributions shown in Figure 3, we find significant differences in the size, concentration, SFR, and gas-phase metallicity distributions of the targeted sample and the two control samples. We perform Kolmogorov–Smirnov (K-S) tests to quantify the significance, and the K-S test probabilities are denoted in the top right corner of each panel. The blue ones are for the K-S probability between the targeted and BC samples, and the red ones are for the K-S probability between the targeted and RC samples.
The stellar masses and sizes in Figure 3 are from the NSA. The size is the half-light radius of the SDSS r-band image. The concentration is defined as  , where R90 and R50 correspond to the radii containing 90% and 50% of the light in the SDSS r band. The SFR is the global SFR from Chang et al. (2015), which is computed by the spectral energy distribution (SED) fittings with SDSS and WISE broadband fluxes.
The mass–size relation of galaxies has been well investigated in recent literature (e.g., Shen et al. 2003; McIntosh et al. 2005; Cappellari et al. 2013). Quiescent and SF galaxies have different mass–size relations, suggesting the galaxy structure evolves along with star formation cessation. In the top panels of Figure 3, the targeted galaxies broadly lie between the two control samples. This indicates that galaxies with the outside-in assembly mode have structural properties between those of normal SF galaxies and those of quiescent galaxies. We have checked the fraction of smooth and disklike galaxies in the targeted sample and two control samples by using the data from Galaxy Zoo 2 (Willett et al. 2013). We find an increasing fraction of smooth galaxies from the BC sample (36%), to the targeted sample (54%), to the RC sample (86%). In addition, the targeted galaxies have a median bulge fraction (Simard et al. 2011) of 0.36, which is higher than that of the BC galaxies (0.26) and lower than that of the RC galaxies (0.57). These agree well with the results in the top panels of Figure 3.
The bottom left panel of Figure 3 shows that the targeted galaxies tend to have a higher global SFR than the BC galaxies for about 0.30 dex. The majority of the targeted galaxies with  < 4 are above the median star formation main sequence from Chang et al. (2015). This is in contrast to the general knowledge that more-concentrated galaxies tend to be less active in forming stars (Bell et al. 2012; Fang et al. 2013; Bluck et al. 2014; Barro et al. 2017), suggesting that the targeted galaxies are indeed an unusual population with respect to normal SF galaxies.
The mass–metallicity relation is one of the basic relations in the galaxy formation and evolution field, which has been studied in many works (e.g., Lequeux et al. 1979; Garnett & Shields 1987; Tremonti et al. 2004; Gallazzi et al. 2005; Panter et al. 2008; Sánchez et al. 2013; Lian et al. 2015). The bottom right panel of Figure 3 shows that the targeted galaxies are more metal-rich than the BC galaxies. The oxygen abundance used in this panel is the Hα flux-weighted metallicity for all spaxels based on MaNGA data. For each spaxel, the oxygen abundance is calculated using the N2O2 indicator, adopting log10(O/H) + 12 = log10[1.54020 + 1.26602 × R + 0.167977 × DR2] + 8.93 where ![$R\,={\mathrm{log}}_{10}[{\rm{N}}\,{\rm{II}}]/[{\rm{O}}\,{\rm{II}}]$](https://content.cld.iop.org/journals/0004-637X/844/2/144/revision1/apjaa7bedieqn69.gif) (Dopita et al. 2013). Zhang et al. (2017) proposed that the N2O2 indicator is optimal in measuring metallicity for diffused ionized regions because it is not sensitive to the ionization parameter (Dopita et al. 2000, 2013; Kewley & Dopita 2002). As shown in this panel, the median gas-phase metallicity of the targeted sample is about 0.12 dex higher than that of the BC galaxies.
(Dopita et al. 2013). Zhang et al. (2017) proposed that the N2O2 indicator is optimal in measuring metallicity for diffused ionized regions because it is not sensitive to the ionization parameter (Dopita et al. 2000, 2013; Kewley & Dopita 2002). As shown in this panel, the median gas-phase metallicity of the targeted sample is about 0.12 dex higher than that of the BC galaxies.
There are three targeted galaxies with dramatically low gas-phase metallicities of  , which is about 0.4 dex lower than the median relation from Tremonti et al. (2004). One of them is an edge-on galaxy, and the other two show blue clumpy structures in the SDSS color image. Their low gas-phase metallicities suggest external gas acquisition. In contrast, the cold gas in other targeted galaxies may be pre-existing gas, rather than newly accreted gas from cosmic web, and the metal abundance is enriched by the recent/ongoing star formation activity (Chen et al. 2016).
3.2. 2D Maps and Radial Profiles of Dn(4000), EW(HδA), and EW(Hα)
In addition to the global properties investigated in the previous section, the IFS survey enables us to study the resolved properties of our samples. Figure 4 shows the radial profiles of the 4000 Å break (left panel), HδA index (middle panel), and  (right panel) for these three samples. In each panel, the blue, green, and red lines show the median profile for the BC sample, targeted sample, and RC sample, respectively. The shaded regions correspond to the 20%–80% range. In presenting the radial profile, we scale the radii with the effective radius of the SDSS r band.

Figure 4. Radial profiles of 4000 Å break (left panel), HδA absorption index (middle panel), and  (right panel) for our targeted sample and two control samples. In each panel, the blue, green, and red lines show the median profile for the BC sample, targeted sample, and RC sample, respectively. The shaded regions correspond to the 20%–80% range. We present the radial profile with radii scaled to the effective radius.
Download figure:
Standard image High-resolution imageFor an individual galaxy, the radial profile of the 4000 Å break is computed in the following way. We separate all spaxels with the continuum S/N > 5 at 5500 Å into a set of radial intervals with a constant width of  . At a given radial bin for an individual galaxy, the value of the 4000 Å break profile is estimated by the median Dn(4000) of the spaxels falling in that radial bin. In this process, we have corrected the inclination effect for each spaxel based on the minor-to-major axis ratio from the NSA (Blanton et al. 2011). Throughout the paper, we calculate the radial profiles in the way described above for all referred parameters.
As expected, the targeted and BC samples have lower Dn(4000), higher EW(HδA), and higher  than the RC sample as a whole. The BC sample has negative Dn(4000) gradients and positive EW(HδA) and
  gradients within the effective radius. The radial profiles of the BC sample become flat when the radii are greater than
  . In contrast, the radial profiles of the targeted sample show slightly positive gradients of Dn(4000), slightly negative gradients of EW(HδA), and pronounced negative gradients of
  . The gradients of these three parameters still exist when the radius is beyond
  . Figure 4 confirms that the targeted galaxies have stronger star formation activity in their centers than in their outer regions. This is in contrast to the previous findings of an inside-out assembly mode in massive SF galaxies (e.g., Muñoz-Mateos et al. 2007; Bezanson et al. 2009; Pérez et al. 2013; Pan et al. 2015; Tacchella et al. 2015). The targeted galaxies are very interesting, since they are associated with rapid central stellar mass assembly (or bulge growth). Investigating their properties would probably provide clues about the processes of bulge growth and star formation cessation (see further discussion in Section 4.3).
3.3. Radial Profiles of Metallicity and 

Figure 5 shows the median radial profiles of stellar surface mass density ( , left panel) and gas-phase metallicity (right panel) for our samples. The shaded regions correspond to the 20%–80% range. The stellar mass maps are the outputs from the STARLIGHT fittings (see Section 2.2). As shown in the left panel of Figure 5, the RC sample has the highest stellar surface density, and the BC sample has the lowest stellar surface density as a whole. The median
  profiles of the three samples are nearly parallel in logarithmic space. The targeted sample has a higher median
  profile than the BC sample for about 0.22 dex and a lower one than the RC sample for about 0.39 dex. This result is consistent with the results in Figure 3, indicating that the structural properties of the targeted sample are between the two control samples.
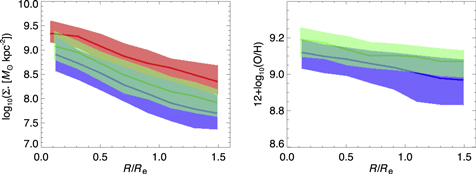
Figure 5. Radial profiles of stellar mass surface density (left panel) and gas-phase metallicity (right panel). In the left panel, the blue, green, and red lines represent the stellar surface density profiles of the BC sample, targeted sample, and RC sample, respectively. In the right panel, we only present the gas-phase metallicity for the BC sample (blue line) and targeted sample (green line). The shaded regions correspond to the 20%–80% range. The radial profiles are shown with the radii scaled to the effective radius.
Download figure:
Standard image High-resolution imageThe right panel of Figure 5 shows the gas-phase metallicity profile for the BC sample (blue line) and targeted sample (green line). As shown, the targeted sample is systematically more metal-rich than the BC sample for ∼0.07 dex within 1.5 . The median metallicity profile of the BC sample is slightly steeper than that of the targeted sample. The BC sample has a median metallicity gradient of −0.11 dex/
 , which is slightly steeper than that of the targeted sample (−0.08 dex/
 ). The gradients measured in this work are comparable with the previous measurements of −0.1 dex/
 by Sánchez et al. (2014).
Recently, the  and local gas-phase metallicity have been found to be closely related, with a higher
  indicating a higher metallicity (Barrera-Ballesteros et al. 2016; Zhu et al. 2017). Thus, one may ask whether the higher metallicity of the targeted sample is only due to the higher stellar surface density. To answer this question, we plot
  versus metallicity for all spaxels in the BC sample (blue contours) and targeted sample (green contours) in Figure 6, excluding the spaxels with an S/N of [O ii] λ3727, Hβ, Hα, or [N ii] λ6584 flux less than 3. In Figure 6, the blue and green data points represent the median relations for the BC sample and the targeted sample, respectively. The targeted galaxies are more concentrated than the BC galaxies and have a larger stellar surface density as a whole. The targeted sample is more metal-rich than the BC sample at the high-
 end (
end (
 kpc−2). The metallicities of these two samples become comparable when
  108
108  kpc−2. We find that the inner regions of the targeted galaxies are more metal-rich than the inner regions of the BC galaxies, even at a fixed stellar surface mass density. With respect to the BC galaxies, the higher central oxygen abundance in the targeted galaxies may be due to enhancement from ongoing intense star formation activity, as proposed by Chen et al. (2016). By using the highly resolved IFS data of HGC 91c, Vogt et al. (2017) found that the metal enhancement has proceeded preferentially along the spiral arms and less efficiently across the arms, suggesting that the metal enhancement and intense star formation activity are associated.
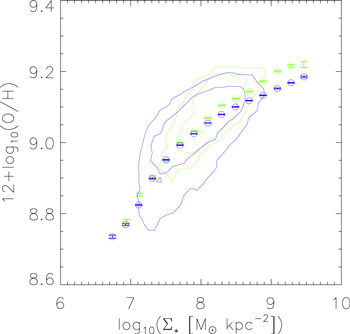
Figure 6. The  –Zgas relation for star formation regions in the targeted galaxies (green contours) and BC galaxies (blue contours). The green and blue data points represent the median relations. The errors are computed using the bootstrap method.
Download figure:
Standard image High-resolution image3.4. Environment of Our Samples
We have found that the structural and radial star formation properties of the targeted sample are significantly distinct from those of the BC sample. In this section, we investigate the environment of our samples and try to find out whether they reside in the same environment.
We use the projected two-point cross-correlation function (2PCCF;  ) to quantify the clustering properties of our samples. Here we briefly describe the method of calculating 2PCCFs; a full description of the methodology is presented in Li et al. (2006). The spectroscopic reference sample is from version dr72 of the NYU Value-Added Galaxy Catalog (NYU-VAGC). It is a magnitude-limited sample of about half a million galaxies with an r-band Petrosian apparent magnitude corrected for galactic extinction
  , an absolute magnitude range of
  , and redshifts in the range
  . Here
  is the r-band Petrosian absolute magnitude, corrected for evolution and K-corrected to its value at z = 0.1. In calculating the 2PCCF, we have generated a random sample that has the same selection effects as the reference sample (Li et al. 2006; Lin et al. 2014). We cross-correlate the targeted sample and two control samples with respect to the reference and random samples, then define
  as the ratio of the two pair counts minus one in the projected separation rp. The effect of fiber collisions is carefully corrected following the method in Li et al. (2006).
The top panel of Figure 7 shows the 2PCCFs measured for the BC sample ( ; blue line), targeted sample (
 ; green line), and RC sample (
 ; red line). For clarity, we also include the amplitude ratio,
  and
and  , in logarithmic space in the bottom panel. The errors in the
  measurements are computed by using the bootstrap resampling technique (Barrow et al. 1984). The data points of
  are not shown on scales smaller than 30 kpc, because they have very large uncertainties due to the limitation of the sample sizes.

Figure 7. Projected 2PCCF for the targeted sample ( ; green line), BC sample (
 ; blue line), and RC sample (
 ; red line). The amplitude ratios,
  /
/ and
and  /
/ , are presented in the bottom panel. The errors are computed by using the bootstrap resampling technique.
Download figure:
Standard image High-resolution imageAs expected, the RC galaxies are more strongly clustered than the BC galaxies at a large range of scales from 30 kpc to 3 Mpc. As a whole, the clustering amplitude of the targeted sample is between that of the BC sample and that of the RC sample. The targeted galaxies are more strongly clustered than the BC galaxies at almost the whole scale we considered, especially at 0.8–2 Mpc (0.3–0.5 dex higher). However, the targeted sample appears to be more weakly clustered than the RC sample, especially at the scale of 50–300 kpc (0.3–0.5 dex lower). Assuming that the environment effect is the main driver for the outside-in mode in the targeted galaxies, it is difficult to understand why the environment at a large scale (∼1 Mpc) could have an effect on the SF properties of the galaxies. At a scale of 30 kpc, the targeted sample appears to be more strongly clustered than the BC sample. However, we do not overinterpret the results in Figure 7 because of the limitation of the sample size.
In addition to 2PCCFs, we also use the three-dimensional reconstructed local mass density ( , where ρ is the local matter density and
  is the mean matter density) to quantify the environment for each galaxy in our sample. The mass density field is taken from the Exploring the Local Universe with the reConstructed Initial Density Field project (ELUCID; Wang et al. 2016) and matches well with the galaxy and group distribution (Yang et al. 2007) of the SDSS Data Release 7 (Abazajian et al. 2009). The local mass density we use is the smoothed density by a Gaussian kernel with a scale of 2 Mpc h−1 at each galaxy position.
Figure 8 shows the density distribution of the BC sample (blue histogram), targeted sample (green filled histogram), and RC sample (red histogram). All three samples have broad density distributions. To quantify the significance of the distribution difference between the targeted sample and the two control samples, we present the K-S test probabilities in the top right corner. The K-S test probabilities suggest that significant differences between the density distribution of the targeted sample and the two control samples are not found. We note that about 17% of the RC galaxies, 11% of the targeted galaxies, and 2% of the BC galaxies reside in the dense regions with  .
.
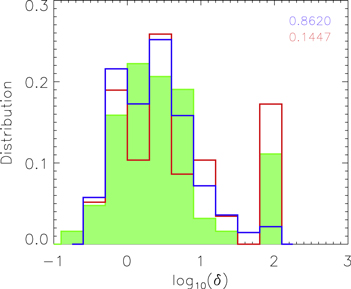
Figure 8. Density distributions of the BC sample (blue histogram), targeted sample (green filled histogram), and RC sample (red histogram). The K-S test probability of the targeted and BC samples is denoted in blue, and the K-S test probability of the targeted and RC samples is denoted in red.
Download figure:
Standard image High-resolution imageThe results of Figures 7 and 8 suggest a question as to whether the large distinction of clustering amplitude between the targeted and BC samples at a scale of 0.8–2 Mpc is mainly contributed by the 11% of targeted galaxies residing in big clusters. To answer this question, we have checked the clustering properties of the targeted and BC samples while excluding the galaxies residing in the most massive halos ( ). The result shows that the clustering amplitude of the targeted galaxies has been reduced to slightly higher than (or comparable with, if considering the errors) that of the BC sample at a scale of 0.8–2 Mpc. However, the targeted galaxies still appear to be more strongly clustered than the BC sample at a scale of 30 kpc.
Furthermore, we have calculated the projected separation of the nearest neighbor for the targeted and BC galaxies with velocity differences less than 500 km s−1. In this process, we ignore the spectroscopic incompleteness effect, since we just care about the comparison of the companion fraction between the targeted and BC galaxies. We find that 19 (∼25%) targeted galaxies and 14 (∼10%) BC galaxies have one or more companions within 100 kpc. This suggests that interaction with close companions is likely to be one of the drivers of the outside-in assembly mode. Since the majority of the targeted galaxies do not have companions within 100 kpc, it appears that this mechanism is not the main driver. We will discuss the possible mechanisms for the formation of the targeted galaxies in Section 4.2.
4. Discussion
4.1. The Properties of the Targeted Sample
The IFS survey enables us to select a sample of massive SF galaxies with a recent outside-in stellar mass assembly mode. They are selected to have  >
>  and account for 14% of the total massive SF galaxies (
 < 5 and
  ). For comparison, we have built two control samples matched in stellar mass. On average, the targeted galaxies appear to have smaller sizes and higher concentration, SFR, and oxygen abundance than normal SF galaxies.
We have generated Dn(4000), EW(HδA), and  maps and profiles for our samples. The inside-out mass assembly scenario has been found in observations of massive SF galaxies (e.g., Sánchez-Blázquez et al. 2007; Pérez et al. 2013; Ibarra-Medel et al. 2016). However, the targeted galaxies appear to have significantly different two-dimensional mass assembly patterns from those of normal SF galaxies. They have lower Dn(4000) and higher
  in their inner regions than their outer regions, suggesting that they host younger stellar populations and more intense star formation activity in the inner regions than the outer regions. The higher metallicities in the inner regions of the targeted galaxies are likely due to the enhancement of recent intense star formation activity.
Lin et al. (2017) identified a sample of 17 "turnover" galaxies from 57 nearly face-on spiral CALIFA galaxies whose central regions exhibit a significant drop in Dn(4000). The central regions of these galaxies have experienced star formation in the past 1–2 Gyr. Nearly all of the turnover galaxies are barred, suggesting a bar-induced star formation scenario in the galaxy centers (e.g., Hawarden et al. 1986; Ho et al. 1997; Wang et al. 2012; Cole et al. 2014). The targeted galaxies in this work are different from their population, because the Dn(4000) profiles of the targeted galaxies do not show turnover features at galactic center. We have checked the bar fraction of the targeted galaxies and found that about 19% of them appear to have a bar-like structure (Willett et al. 2013). This indicates that the existence of a bar is not mainly responsible for the outside-in mass assembly mode in the targeted galaxies.
From 489 SF galaxies of the MaNGA sample, Chen et al. (2016) identified nine counter-rotators, whose gas and stars are kinematically misaligned. They also have a positive slope of their Dn(4000) profiles and more intense, ongoing star formation in their central regions than their outer regions (Chen et al. 2016; Jin et al. 2016). Five of them are selected in our targeted sample, and the other four have a stellar mass that is lower than our selection criteria. Chen et al. (2016) proposed that the formation of SF counter-rotators is due to gas accretion from gas-rich dwarfs or the cosmic web. The counter-rotators tend to reside in more isolated environments (Jin et al. 2016), while our targeted galaxies live in a variety of environments (see Figure 8). This suggests that gas accretion may be one of the mechanisms for the outside-in assembly mode, though it is not known whether it is the main driver.
4.2. The Formation of the Targeted Galaxies
The targeted galaxies can be formed in two ways according to their abnormal resolved star formation properties. One is that normal SF galaxies suffer from some kind of process, such as interaction or gravitational instability of the disk, leading to gas inflow and triggering central star formation, and subsequently the galaxies with the outside-in assembly mode are formed. The other is that quenched galaxies accrete cold gas and re-form stars in their centers, which can also lead to the observed outside-in assembly picture. Figure 5 shows that the central  of the targeted galaxies is between that of the BC galaxies and the RC galaxies. If the targeted galaxies are mainly formed via gas accretion of quenched galaxies, their central
  should be, on average, comparable with (or higher than) that of the RC galaxies. Thus, we deduce that the progenitors of the targeted galaxies are probably normal SF galaxies, which might later undergo cold gas inflow and morphological transformation.
In Table 1, we list the properties of targeted galaxies, as well as their morphologies and the projected distance to the nearest neighbor. We find that 14 out of 73 targeted galaxies have a bar-like structure (four galaxies with an inclination angle greater than 75° are not included in counting the bar fraction), and 19 out of 77 targeted galaxies have one or more companions within 100 kpc. It is well established that both the existence of the bar and interaction with companions can effectively cause gas inflow and enhance star formation in the galaxy center (Li et al. 2008; Wang et al. 2012), although they do not always work (Lin et al. 2017). Among galaxies with companions, some are located in very massive clusters that may suffer from a variety of environmental processes, such as tidal stripping, ram-pressure stripping, and galaxy harassment (e.g., Moore et al. 1996; Cox et al. 2006; Cheung et al. 2012). However, in our case, both the environmental effect and the existence of the bar are not enough to explain most of the individual galaxies, suggesting that other mechanisms are needed. Specifically, there are 44 (∼60%) out of 73 targeted galaxies that do not have a bar-like structure or companions within 100 kpc. Four of them are the counter-rotators in Chen et al. (2016), which are proposed to undergo gas accretion from gas-rich dwarfs or the cosmic web. It is possible that more targeted galaxies are undergoing the same process, since gas accretion does not always cause the kinematical misalignment of gas and stars.
Recently, in addition to mergers, another channel for bulge growth via disk instabilities was proposed in a semianalytical model (Porter et al. 2014), which brought the model into better agreement with the observed galaxy stellar mass function of spheroid-dominated galaxies. Furthermore, Brennan et al. (2015) confirmed that a model adding the disk instabilities for bulge growth agrees better with the observed galaxy distribution on the speciific SFR (sSFR)–Sérsic index plane than a model in which bulges grow only through mergers. By implementing the bulge growth model with the mergers and disk instabilities into the semianalytical galaxy formation code, Tonini et al. (2016) produced two distinct populations of bulges: merger-driven bulges, which are similar to classical bulges, and instability-driven bulges, which are similar to pseudo-bulges. The instability-driven bulges dominate the population of galaxies with intermediate stellar masses ( ), which are in the mass range similar to that of our targeted galaxies. Considering the very low major merger rate in the local universe, disk instabilities and minor mergers may be responsible for the bulge growth of the targeted galaxies.
4.3. Implications of the View of Quenching
The targeted galaxies are found to assemble their central stellar mass rapidly (see Figure 4), indicating a rapid (pseudo) bulge growth. A massive bulge is believed to be the key factor for quenching star formation for local galaxies (Bell et al. 2012; Fang et al. 2013). Bluck et al. (2014) found that the bulge mass is more critical in quenching star formation than the bulge-to-total stellar mass ratio for local galaxies. More recently, Barro et al. (2017) investigated the evolution of the stellar surface mass density within the central 1 kpc ( ) of SF and quiescent galaxies since a redshift of 3. They found that the growth of a dense stellar core is the necessary condition for star formation quenching.
Figure 9 shows  versus stellar mass for the BC sample (blue crosses), targeted sample (green circles), and RC sample (red triangles). The red line is taken from Fang et al. (2013) for quenched galaxies. For comparison, the
  used here is computed following the same procedure as in Fang et al. (2013). The green and blue lines are the best fits of the targeted and BC galaxies. For comparison, a volume-limited sample selected from SDSS is shown by the background contours (the same data set as in Figure 3). We find that the targeted galaxies are broadly located between two control samples on the diagram of
  –
– . Considering the intense star formation activity at the center, they are undergoing rapid (pseudo) bulge growth and will meet the quenching requirements on a more rapid timescale than normal SF galaxies.
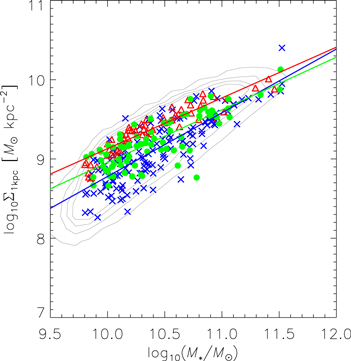
Figure 9.
 vs. stellar mass for the BC sample (blue crosses), targeted sample (green circles), and RC sample (red triangles). The red line is taken from Fang et al. (2013). The green and blue lines are the best fits to the targeted and BC galaxies. For comparison, a volume-limited sample selected from SDSS is shown by the background contours.
Download figure:
Standard image High-resolution imageIt is well known that the bulge mass has a tight relation with the central massive black hole mass (e.g., Daddi et al. 2007; Hu 2008; McConnell & Ma 2013), suggesting the coevolution of bulge growth and black hole accretion. The active galactic nucleus (AGN) feedback is supposed to be one of the mechanisms for quenching star formation in galaxies (e.g., Kauffmann et al. 2004; Schawinski et al. 2007; Dekel & Burkert 2014). We find four (∼5%) targeted galaxies that are classified as Seyfert galaxies according to the BPT diagram (Baldwin et al. 1981; Kauffmann et al. 2003b), while only three (∼2%) BC galaxies are classified as Seyfert galaxies. Because of the limitation of sample size, we do not overinterpret this result.
5. Summary
In this paper, we have for the first time selected a sample of massive SF galaxies with an outside-in stellar mass assembly mode and analyzed their properties and environments. We made use of the released data from the largest ongoing IFS survey, MaNGA, which contains 1390 galaxies. We performed the spectral fittings by using two methods: the public spectral fitting code STARLIGHT (Cid Fernandes et al. 2005) and a minimized χ2 code from Li et al. (2005). We measured the Dn(4000), HδA index, and EW(Hα) for individual spaxels of each galaxy, as well as stellar mass maps from STARLIGHT outputs.
We selected the massive SF galaxies to have  ,
,  < 5, and
  <
<  . Mergers and disturbed galaxies were excluded by visual inspection. A total of 77 galaxies were selected under the criteria, which accounts for 14% of the SF galaxies. For comparison, we built two control samples closely matched in stellar mass with the targeted sample. The BC sample was selected to have
  >
>  and
and  < 5, and the RC sample was selected to have
  > 5. The main results of this work are listed below.
- 1.The targeted sample has a smaller size and higher concentration than the BC sample and a larger size and lower concentration than the RC sample. In agreement with this, we find an increasing trend of smooth and bulge fractions from the BC sample, to the targeted sample, to the RC sample as a whole.
- 2.The targeted sample also has a larger global SFR (0.36 dex higher) and global gas-phase metallicity (0.12 dex higher) than the BC sample. Furthermore, the median profile of the gas-phase metallicity of the targeted sample is systematically higher than that of the BC sample for ∼0.07 dex within 1.5. When plotting the individual spaxels on the –metallicity plane, the targeted sample appears to be more metal-rich than the BC sample at the high- end and become comparable when 108 kpc−2.
- 3.The targeted sample has a slightly positive gradient of Dn(4000), a slightly negative gradient of the HδA index, and a pronounced negative gradient of, while the BC galaxies show pronounced negative gradients of Dn(4000) and positive gradients of the HδA index and . These are consistent with our selected criteria.
- 4.The median profiles of the three samples are almost parallel. The median profile of the targeted sample is about 0.22 dex higher than that of the BC sample and 0.39 dex lower than that of the RC sample.
- 5.We have analyzed the environment of our samples, including projected 2PCCFs and local density distributions (∼2 Mpc). The targeted sample is more clustered than the BC sample as a whole, especially at a scale of 0.8–2 Mpc (0.3–0.5 dex higher), and it appears to be more weakly clustered than the RC sample, especially at a scale of 50–300 kpc (0.3–0.5 dex lower). However, the wide density distribution (see Figure 8) indicates a variety of environments for the targeted galaxies.


The progenitors of the targeted galaxies may be normal SF galaxies suffering from gas inflow or quiescent galaxies with cold gas accretion. The median  profile of the targeted sample is between that of the two control samples, indicating that the cold gas accretion of quiescent galaxies is not the main approach to the formation of the targeted galaxies. The structure properties of the targeted galaxies are also between those of the two control samples, suggesting that massive SF galaxies with an outside-in assembly mode are probably in the transitional phase from normal SF galaxies to quiescent galaxies. They are experiencing rapid (pseudo) bulge growth and will meet the requirement of quenching on a more rapid timescale than normal SF galaxies.
It is well known that the existence of a bar is effective for causing gas inflow and intense central star formation activity (Wang et al. 2012; Lin et al. 2017). Only 14 (∼19%) targeted galaxies host a bar, indicating that the existence of a bar is not the main driver of the outside-in assembly mode. We also found 19 (∼25%) targeted galaxies with one or more companions within 100 kpc, indicating that interaction with companions is also not the main reason. The majority of the targeted galaxies (60%) appear to have smooth morphologies (see Table 1) and are not found to have a bar or companions within 100 kpc. The formation mechanisms of these are not clear. The disk instabilities in secular evolution and minor mergers may be another channel for bulge growth and morphological transformation (Porter et al. 2014; Brennan et al. 2015). In the near future, ongoing large IFS surveys will provide a larger sample of galaxies with an outside-in assembly mode and help people to understand the origins of that mode.
This work is supported by the National Basic Research Program of China (973 Program) (2015CB857004), the National Natural Science Foundation of China (NSFC; Nos. 11320101002, 11522324, 11421303, and 11433005), and the Fundamental Research Funds for the Central Universities. EW acknowledges support from the Youth Innovation Fund by the University of Science and Technology of China (No. WK2030220019).
Funding for the Sloan Digital Sky Survey IV has been provided by the Alfred P. Sloan Foundation, the U.S. Department of Energy Office of Science, and the Participating Institutions. SDSS-IV acknowledges support and resources from the Center for High-Performance Computing at the University of Utah. The SDSS web site is http://www.sdss.org.
SDSS-IV is managed by the Astrophysical Research Consortium for the Participating Institutions of the SDSS Collaboration, including the Brazilian Participation Group, the Carnegie Institution for Science, Carnegie Mellon University, the Chilean Participation Group, the French Participation Group, the Harvard-Smithsonian Center for Astrophysics, the Instituto de Astrofísica de Canarias, Johns Hopkins University, the Kavli Institute for the Physics and Mathematics of the Universe (IPMU)/University of Tokyo, Lawrence Berkeley National Laboratory, the Leibniz Institut für Astrophysik Potsdam (AIP), the Max-Planck-Institut für Astronomie (MPIA Heidelberg), the Max-Planck-Institut für Astrophysik (MPA Garching), the Max-Planck-Institut für Extraterrestrische Physik (MPE), the National Astronomical Observatory of China, New Mexico State University, New York University, the University of Notre Dame, the Observatório Nacional/MCTI, The Ohio State University, Pennsylvania State University, the Shanghai Astronomical Observatory, the United Kingdom Participation Group, the Universidad Nacional Autónoma de México, the University of Arizona, the University of Colorado—Boulder, the University of Oxford, the University of Portsmouth, the University of Utah, the University of Virginia, the University of Washington, the University of Wisconsin, Vanderbilt University, and Yale University.
Appendix: Stellar Age Profiles from STARLIGHT Measurements
Since our main results are based on the three diagnostic parameters, we have checked our results by using the mean stellar age from STARLIGHT outputs. The left panel of Figure 10 shows the median profiles of the light-weighted stellar age for the targeted (green lines), BC (blue lines), and RC (red lines) samples, while the right panel shows the median profiles of the mass-weighted stellar age for these three samples. In each panel, the dashed lines correspond to the 20%–80% range. The mass-weighted ages trace the star formation burst at early stages, while the light-weighted ages trace the recent star formation burst. As shown, the targeted sample exhibits a slightly positive gradient of light-weighted age and a slightly negative gradient of mass-weighted age. This supports our conclusion that the targeted galaxies suffered a reactivation of their central star formation at recent times.
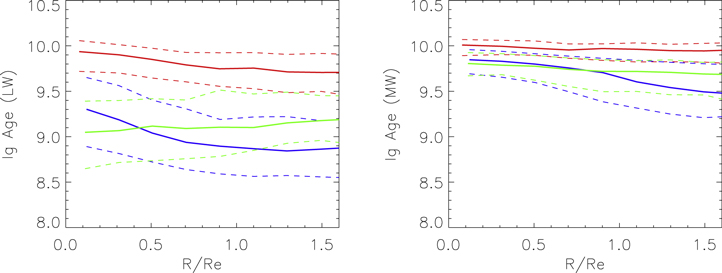
Figure 10. Median profiles of light-weighted (left panel) and mass-weighted (right panel) stellar ages for the targeted (green lines), BC (blue lines), and RC (red lines) samples. In each panel, the dashed lines correspond to the 20%–80% range.
Download figure:
Standard image High-resolution image