


Abstract
While bright, blue, compact galaxies are common at  , they are relatively rare in the local universe, and their evolutionary paths are uncertain. We have obtained resolved H i observations of nine
  luminous compact blue galaxies (LCBGs) using the Giant Metrewave Radio Telescope and Very Large Array in order to measure their kinematic and dynamical properties and better constrain their evolutionary possibilities. We find that the LCBGs in our sample are rotating galaxies that tend to have nearby companions, relatively high central velocity dispersions, and can have disturbed velocity fields. We calculate rotation velocities for each galaxy by measuring half of the velocity gradient along their major axes and correcting for inclination using axis ratios derived from SDSS images of each galaxy. We compare our measurements to those previously made with single dishes and find that single-dish measurements tend to overestimate LCBGs' rotation velocities and H i masses. We also compare the ratio of LCBGs' rotation velocities and velocity dispersions to those of other types of galaxies and find that LCBGs are strongly rotationally supported at large radii, similar to other disk galaxies, though within their half-light radii the
  values of their H i are comparable to stellar
  values of dwarf elliptical galaxies. We find that LCBGs' disks on average are gravitationally stable, though conditions may be conducive to local gravitational instabilities at the largest radii. Such instabilities could lead to the formation of star-forming gas clumps in the disk, resulting eventually in a small central bulge or bar.
Export citation and abstract BibTeX RIS
1. Introduction
1.1. LCBGs: Analogs to z ∼ 1 Star-forming Galaxies
Luminous compact blue galaxies (LCBGs) are a morphologically heterogeneous class of star-forming galaxies that are defined by their blue colors, high luminosities in the optical B band, compact sizes, and high surface brightnesses (Werk et al. 2004). Their strong optical emission lines and blue continua suggest that LCBGs harbor diverse stellar populations, with a current starburst involving approximately a tenth of the galaxy's mass coexisting with older cohorts of stars of approximately solar metallicity (Hammer et al. 2001; Guzmán et al. 2003; Hoyos et al. 2007).
LCBGs are common in galaxy surveys at intermediate redshifts. Koo et al. (1994) found that 30% of compact sources at z ∼ 0.1–0.7 show strong, narrow emission lines characteristic of star formation. Guzmán et al. (1997) found that LCBGs compose 20% of the general field population of galaxies and contribute 45% of the total star formation rate density at  . Tollerud et al. (2010) found that LCBGs comprise ∼10% of the total galaxy population with
  and ∼5% of the galaxies with
  at a median redshift of
  , which they note is lower than the Guzmán et al. (1997) value, likely due to the rapid evolution of LCBGs after
  . Hunt (2017) found that LCBGs contribute 42% of the luminosity density of galaxies with
  at
at  , and that they comprise 30% of the galaxy population with
  and 60% of the galaxy population with
  at that redshift. LCBGs at
  are selected to have optical properties that are consistent with the small, bright, blue galaxies that appear in deep field observations (Koo et al. 1994; Phillips et al. 1997; Werk et al. 2004).
In contrast to their abundance at intermediate redshifts, LCBGs are a factor of 10 rarer in number density in the local universe (Guzmán 2001). Hunt (2017) found that LCBGs comprise less than 2% of galaxies at  . This discrepancy suggests that LCBGs are a progenitor population for one or more of the galaxy types prevalent at
  . Garland et al. (2015) recently confirmed that local LCBGs have similar morphologies, gas fractions, and specific star formation rates as higher-redshift star-forming galaxies. Following the definitions compiled by Werk et al. (2004) to select for local analogs of intermediate-redshift LCBGs, these galaxies have
  ,
,  , and
, and  .
.
The properties of both local and  LCBGs overlap with many similar types of galaxies that have been described in the literature. Galaxies with properties similar to those of LCBGs include Compact Galaxies (Guzmán et al. 1997; Phillips et al. 1997), Luminous Compact Galaxies (Hammer et al. 2001), and Blue Compact Galaxies (Koo et al. 1994; Guzmàn 1999; Barton & van Zee 2001; Pisano et al. 2001). While they are blue and compact, LCBGs are too massive (
 , Guzmán et al. 2003; Garland et al. 2004; Tollerud et al. 2010), luminous (
 , Garland et al. 2004), and have metallicities that are too high (
 , Tollerud et al. 2010) to be classified as Blue Compact Dwarfs. Cardamone et al. (2009) found that LCBGs overlap in blue luminosity, morphology, stellar mass, and metallicity with the Green Pea galaxies detected by Galaxy Zoo at
  . Heckman et al. (2005) found that the lower-mass examples of compact Ultraviolet Luminous Galaxies, which they identify as low-redshift analogs of high-redshift Lyman Break Galaxies (LBGs), overlap in mass with the higher-mass examples of compact galaxies discussed in Phillips et al. (1997). Similarly, Guzmán et al. (2003) and Hoyos et al. (2004) point out that some LCBGs could be low-mass, lower-redshift counterparts to LBGs, and France et al. (2010) have detected fine-structure emission lines of Si ii that have been previously observed in
  LBGs in a
  LCBG, which they interpret as an indication that star formation processes may be related in both types of galaxies. It is useful to study
  LCBGs, then, to better understand the properties of the types of galaxies that exist at higher redshifts.
LCBGs have heterogeneous morphologies. Many LCBGs appear to be the products of mergers, especially at intermediate redshift where the spatial density of galaxies was larger and mergers were more common (Amram & Östlin 2001). In particular, irregular morphologies are more common in LCBGs than in other blue compact galaxies (Östlin et al. 2001). Many LCBGs also have companions (Garland et al. 2004, 2015; Pérez-Gallego et al. 2010). At  , 60% of LCBGs appear to have similar properties to local H ii galaxies, while 40% of LCBGs resemble local starburst disk galaxies, and 90% seem to be small galaxies with some extension, but lacking large, faint disks (Noeske et al. 2006). Garland et al. (2015) find that 40% of local LCBGs are "clumpy," which they define to mean three or more optical clumps. Werk et al. (2004) point out that LCBGs are also not a distinct class of galaxies in parameter space. They exist at the extreme blue, bright, and compact ends of the optical properties that serve to identify them, but they are not outliers along the continuum of observed properties for field galaxies at the redshifts at which they appear (see Figure 1 in Garland et al. 2004).
As LCBGs at  are rare compared to their number density at
  (Guzmán 2001), it is likely that they evolve quickly once their current episodes of star formation end, though it is not known what types of galaxies LCBGs will subsequently become. It has been suggested that LCBGs could be undergoing their final phase of star formation, and will continue to passively evolve and fade to become today's spheroidal or dwarf elliptical galaxies (Guzmán et al. 1997; Bershady et al. 2005) or faint, low-mass spiral galaxies (Phillips et al. 1997). Other authors have suggested that LCBGs could be spiral galaxies undergoing a burst of star formation as they form their bulges (Barton & van Zee 2001; Hammer et al. 2001; Barton et al. 2006). It has also been asserted that LCBGs are galaxies that only appear similar in unresolved optical images at intermediate redshift and are actually a diverse enough population that their evolutionary paths and end products are widely varied (Tollerud et al. 2010). As LCBGs are visible across a large range of redshifts, they are excellent candidates for studying galaxy evolution (Hoyos et al. 2007).
1.2. Goals
In order to determine possible evolutionary paths for LCBGs, it is necessary to have knowledge of their H i properties. Measuring the H i mass gives an estimate of the fuel available for star formation and constrains the duration of the current starburst. The internal kinematics of the H i and evidence of past interactions give clues regarding the starburst triggering and quenching mechanisms (Pisano et al. 2001), and can support or rule out disk or spheroid models of LCBGs' morphology. To investigate the nature of these galaxies, we have studied a selection of local analogs to intermediate-redshift LCBGs. Previously, Garland et al. (2004, 2005, 2007) surveyed the optical, H i, and CO properties of Sloan Digital Sky Survey (SDSS)- and Markarian-selected LCBGs. They took H i and CO spectra of a large sample of LCBGs using single pointings (Garland et al. 2004, 2005). For their study, they selected local LCBG analogs having the same optical properties as intermediate-redshift LCBGs, as outlined by Werk et al. (2004). Garland et al. (2007) also initiated follow-up mapping observations of four Markarian galaxies and one SDSS galaxy with the Very Large Array (VLA). In this paper, we follow up the previous Garland et al. studies with Giant Metrewave Radio Telescope (GMRT) and VLA H i observations of galaxies selected from the Garland et al. (2004) sample, plus one additional local LCBG.
An overarching goal of this paper is to compare the H i properties we derive from resolved observations of nearby LCBGs to the properties derived from unresolved single pointings. Since LCBGs are most common at redshifts where resolved H i studies are not possible, it is important for us to understand what information is lost in unresolved observations of these galaxies. To accurately predict their evolution, we must first know what available observations can definitively tell us.
Previous H i studies of local LCBGs have not had the spatial resolution to distinguish the target sources from their nearby companions. Therefore, another goal of our study is to identify H i-rich companions and signatures of interacting galaxies that were not resolved in the single-dish H i observations from Garland et al. (2004). Since H i gas traces a galaxy's gravitational potential at a much larger radius than light from stars, our resolved H i observations could indicate locations conducive to interaction-driven star formation, where it may not be obvious from optical observations. We therefore take advantage of the GMRT and VLA's angular resolution to measure the extent of H i emission and identify signatures of rotation in order to calculate dynamical masses ( ) for these LCBGs from measurements of rotation velocities (as opposed to estimating
  from linewidths that could potentially be biased by the inclusion of nearby companions, tidal features, or non-rotation components). Coupled with the H i mass (
 ), these measurements give us an estimate of how much gas is available for the continuation of the starburst. This constrains the evolutionary scenarios for LCBGs, as the bulge formation scenario would imply that LCBGs have higher
  than have been sampled from the central bright cores of LCBGs at intermediate redshifts (e.g., Pisano et al. 2001), and the spheroidal/dwarf elliptical progenitor scenario requires LCBGs to undergo passive evolution after their current starburst (Guzmàn 1999), which would limit their possible rotation velocities.
An additional goal of this paper is to determine whether LCBGs are rotationally supported disk galaxies or dispersion-dominated bulges to better understand their likely future morphologies once their star formation has been quenched. Since our resolved study can also distinguish velocity dispersions from rotation velocities, we can compare their rotation velocities to their velocity dispersions and look for evidence of disk-like or bulge-like behavior both at their outermost regions and their centers. We can also use the ratio of ordered to random motions and the gas fractions that we have measured to look for evidence of disk instabilities that could trigger star formation in these galaxies. These measurements will better constrain the future evolution of local LCBGs, and have strong implications for the possible evolutionary products of their  counterparts.
In this paper, we describe our sample of LCBGs in Section 2. We describe our results in Section 3, and discuss their physical implications in Section 4. We give our conclusions in Section 5. We briefly address the properties of each LCBG in the Appendix. We assume  throughout this paper.
2. Sample Selection, Observations, and Data Reduction
2.1. Sample Selection
We chose nine galaxies from the SDSS- and Markarian-selected single-dish sample of LCBGs that Garland et al. (2004) observed with the Green Bank Telescope (GBT). We also included an additional SDSS galaxy (SDSS 0125+0110) in our sample, selected from the single-dish sample of LCBGs that C. A. Garland et al. (2017, in preparation) observed with Arecibo. The Garland et al. samples were chosen for their blue colors, high luminosities, and compact appearances similar to properties outlined by Werk et al. (2004; see Garland et al. 2004 for a more detailed discussion of the selection criteria). We selected sources that had not been previously observed in H i emission at high resolution with interferometers. The galaxies we observed span the full range of colors of the GBT sample, but do not include the very brightest or most compact galaxies in the GBT sample that Garland et al. (2004) observed. We made sure to include galaxies with and without known optical companions. We show the optical properties of the galaxies in our sample in Table 1, calculated using SDSS Data Release 9 magnitudes and radii (DR9; Ahn et al. 2012) using the equations in Section 2.1.2 of Garland et al. (2004). The galaxies in our sample were strong detections in single-dish H i observations (Garland et al. 2004), which makes them good candidates for interferometer observations. The galaxies in our sample have heterogeneous morphologies, including isolated spiral galaxies, galaxies with tidal tails, multiple galaxies in a common H i envelope, galaxies with distant companions, and galaxies with disturbed gas components. One source (SDSS 1319+5253) contains three galaxies in a common H i envelope, one of which (SBS 1317+523B) is an LCBG. The galaxy that was not included in the original Garland et al. (2004) sample (SDSS 0125+0110) is not consistent with the LCBG optical parameters defined by Werk et al. (2004) when using the photometry of DR9, though it is consistent with these optical parameters when using the photometry of SDSS Data Release 4 (DR4), which Garland et al. (2004) used to select the original local LCBG sample. As its optical properties remain close to the LCBG optical cuts described by Werk et al. (2004), are within the defined LCBG optical parameters when using the photometry of earlier SDSS data releases, and remain within optical properties of LCBGs as described by other authors (e.g., Guzmán et al. 1997), we include it in our analysis. We discuss each galaxy individually in the Appendix.
Table 1. Optical Properties
| Sourcea | Common | Db |
 c
c
|
 d
d
|
 e
e
|
 f
f
|
 g
g
|
Hubbleh |
|---|---|---|---|---|---|---|---|---|
| Name | (Mpc) | (kpc) | ( ) ) |
Type | ||||
| SDSS J011932.82+145220.7 | NGC 469 | 54.6 | 1.4 ± 0.1 | 0.37 ± 0.02 | 14.86 ± 0.02 | −18.8 ± 0.2 | 20.48 ± 0.03 | S? |
| SDSS J012539.72+011041.1i | ARK 044 | 80.4 | 2.4 ± 0.2 | 0.62 ± 0.01 | 15.46 ± 0.01 | −19.0 ± 0.2 | 21.29 ± 0.01 | Sbc |
| SDSS J072849.75+353255.1 | ARK 134 | 58.6 | 1.4 ± 0.1 | 0.41 ± 0.01 | 14.71 ± 0.01 | −19.1 ± 0.2 | 20.19 ± 0.01 | SBbc |
| SDSS J093410.54+001430.3 | UGC 05097 | 75.8 | 2.0 ± 0.2 | 0.46 ± 0.01 | 14.21 ± 0.01 | −20.2 ± 0.2 | 19.78 ± 0.01 | Sa |
| SDSS J093635.36+010659.8 | CGCG 007-009 | 76.2 | 2.5 ± 0.3 | 0.51 ± 0.01 | 14.71 ± 0.01 | −19.7 ± 0.2 | 20.83 ± 0.02 | Sb |
| SDSS J131949.94+520341.2 | SBS 1317+523B | 69.8 | 1.2 ± 0.1 | 0.30 ± 0.01 | 15.50 ± 0.01 | −18.7 ± 0.2 | 20.10 ± 0.01 | E |
| SDSS J140203.52+095545.5 | NGC 5414 | 65.0 | 1.7 ± 0.2 | 0.45 ± 0.01 | 13.94 ± 0.01 | −20.2 ± 0.2 | 19.60 ± 0.03 | E? |
| SDSS J150748.34+551108.8 | UGC 09737 | 49.3 | 1.9 ± 0.2 | 0.44 ± 0.01 | 14.47 ± 0.01 | −19.0 ± 0.2 | 20.87 ± 0.02 | SBcd |
| Mrk 325j | NGC 7673 | 44.0 | 1.2 ± 0.1 | 0.41 ± 0.01 | 13.59 ± 0.01 | −19.6 ± 0.2 | 19.40 ± 0.02 | Sc |
Notes.
aSDSS source names are of the form SDSS JHHMMSS.SS+DDMMSS.S and are hereafter shortened to SDSS HHMM+DDMM. bDistances were taken from NED's luminosity distances using . NED assumes a 10% uncertainty on its luminosity distances, which we use when propagating uncertainties.
cHalf-light radii in the B band calculated using SDSS g and r Petrosian radii using SDSS-III photometry.
dColors calculated from SDSS g and r magnitudes using SDSS-III photometry. Magnitudes are adjusted for extinction using SDSS-III Galactic reddening correction values.
eB-band apparent magnitudes calculated from SDSS g and r magnitudes using SDSS-III photometry and corrected for extinction.
fB-band absolute magnitudes calculated from
. NED assumes a 10% uncertainty on its luminosity distances, which we use when propagating uncertainties.
cHalf-light radii in the B band calculated using SDSS g and r Petrosian radii using SDSS-III photometry.
dColors calculated from SDSS g and r magnitudes using SDSS-III photometry. Magnitudes are adjusted for extinction using SDSS-III Galactic reddening correction values.
eB-band apparent magnitudes calculated from SDSS g and r magnitudes using SDSS-III photometry and corrected for extinction.
fB-band absolute magnitudes calculated from  and luminosity distances.
gSurface brightnesses in the B band calculated from
and luminosity distances.
gSurface brightnesses in the B band calculated from  ,
,  , and luminosity distances.
hFrom Hyperleda.
iThe color and surface brightness of SDSS 0125+0110 are outside of the optical parameters that Werk et al. (2004) use to define LCBGs when we use DR9 photometry to calculate them. As these properties are within the LCBG optical parameters using DR4 photometry, we do not exclude this galaxy from our analysis.
jMrk 325 is at the J2000 (R.A., decl.) position (23:27:41.0, +23:35:21).
, and luminosity distances.
hFrom Hyperleda.
iThe color and surface brightness of SDSS 0125+0110 are outside of the optical parameters that Werk et al. (2004) use to define LCBGs when we use DR9 photometry to calculate them. As these properties are within the LCBG optical parameters using DR4 photometry, we do not exclude this galaxy from our analysis.
jMrk 325 is at the J2000 (R.A., decl.) position (23:27:41.0, +23:35:21).
Download table as: ASCIITypeset image
2.2. GMRT Observations and Reduction
We observed eight galaxies with the GMRT near Pune, India. The GMRT is composed of 30 antennas in a fixed Y-configuration with 14 antennas within 1 km and a maximum baseline of 25 km. We observed five galaxies (SDSS 0728+3532, SDSS 0934+0014, SDSS 0936+0106, SDSS 1319+5253, and SDSS 1402+0955) in 2006 January, along with three additional galaxies (SDSS 0119+1452, SDSS 0125+0110, and SDSS 1507+5511) in 2007 January. We observed each galaxy during a separate session with measurements of flux calibrators 3C48, 3C147, and/or 3C286 at the beginning and end of the observing run. We interspersed observations of a bright, unresolved, nearby phase calibrator every ∼40 minutes that we selected from the VLA calibrator manual for a typical observing session of ∼9 hr. We flagged and calibrated the data using the Astronomical Image Processing System (AIPS)8
data reduction package using the standard procedures. For the GMRT this requires doing an initial calibration for a single, RFI-free channel before flagging and calibrating the full observing band. We made data cubes from the inner 50 channels (out of an original 128 channels with a channel width of  ) using the AIPS task IMAGR. For each galaxy, we made two different cubes: a "low-resolution" cube (typically
  ) made from baselines shorter than
  , and a "high-resolution" cube (typically
  ) made with a larger UV range (made from baselines out to 50–120 kλ). When making the high-resolution cubes, we chose robustness parameters, UV tapers, and UV ranges for each galaxy in order to maximize the resolution while maintaining a high level of signal to noise. We cleaned the data cubes using the number of iterations necessary for the total flux of the clean components in a central channel to reach a plateau so as not to incorporate too many negative clean components. See Table 2 for the imaging parameters used for each galaxy.
Table 2. Imaging Parameters
| Galaxy | High-res beam | Robustness | UV Taper | UV Range | # CLEAN | Low-res Beam | Robustness | UV Taper | UV Range | # CLEAN |
|---|---|---|---|---|---|---|---|---|---|---|
| (arcsec2) | ( ) ) |
( ) ) |
Iterations | (arcsec2) | ( ) ) |
( ) ) |
Iterations | |||
| SDSS 0119+1452 | 13 × 13 | 2 | 70 × 70 | 100 | 50 | 52 × 47 | 5 | 3 × 3 | 5 | 50 |
| SDSS 0125+0110 | 22 × 13 | 5 | 30 × 30 | 50 | 6000 | 54 × 45 | 5 | 3 × 3 | 5 | 35 |
| SDSS 0728+3532 | 13 × 8 | 5 | 70 × 70 | 100 | 180 | 55 × 53 | 5 | 3 × 3 | 5 | 60 |
| SDSS 0934+0014 | 20 × 20 | 5 | 30 × 30 | 40 | 200 | 75 × 49 | 5 | 3 × 3 | 5 | 25 |
| SDSS 0936+0106 | 12 × 11 | 3 | 70 × 70 | 100 | 100 | 55 × 46 | 5 | 3 × 3 | 5 | 950 |
| SDSS 1319+5203 | 15 × 12 | 5 | 30 × 30 | 50 | 400 | 63 × 50 | 5 | 3 × 3 | 5 | 50 |
| SDSS 1402+0955 | 23 × 14 | 2 | 30 × 30 | 50 | 6000 | 53 × 53 | 5 | 7 × 7 | 10 | 20 |
| SDSS 1507+5511 | 11 × 9 | 5 | 30 × 30 | 50 | 130 | 52 × 51 | 5 | 3 × 3 | 5 | 40 |
| Mrk 325a | 6 × 6 | 0 | ⋯ | ⋯ | 50 | ⋯ | ⋯ | ⋯ | ⋯ | ⋯ |
Note.
aThe data cube for Mrk 325 is from a combination of B, C, and D VLA configuration observations.Download table as: ASCIITypeset image
We used the high-resolution data cubes to make Moment 0 (total intensity), Moment 1 (intensity-weighted velocity), and Moment 2 (velocity dispersion) maps, as well as low-resolution Moment 0 maps that include detected companions for each LCBG using the AIPS task MOMNT. These moment maps are shown in Figures 1–8. We typically clipped the high-resolution moment maps at the 2–3σ level, where we measured σ from the rms in an emission-free channel. We chose this noise cut to maximize the galaxy emission shown in the moment maps, while minimizing the noise shown. We made an effort to include companions and preserve extended structures with lower column densities when possible in order to more fully show the morphology and environment of these galaxies.
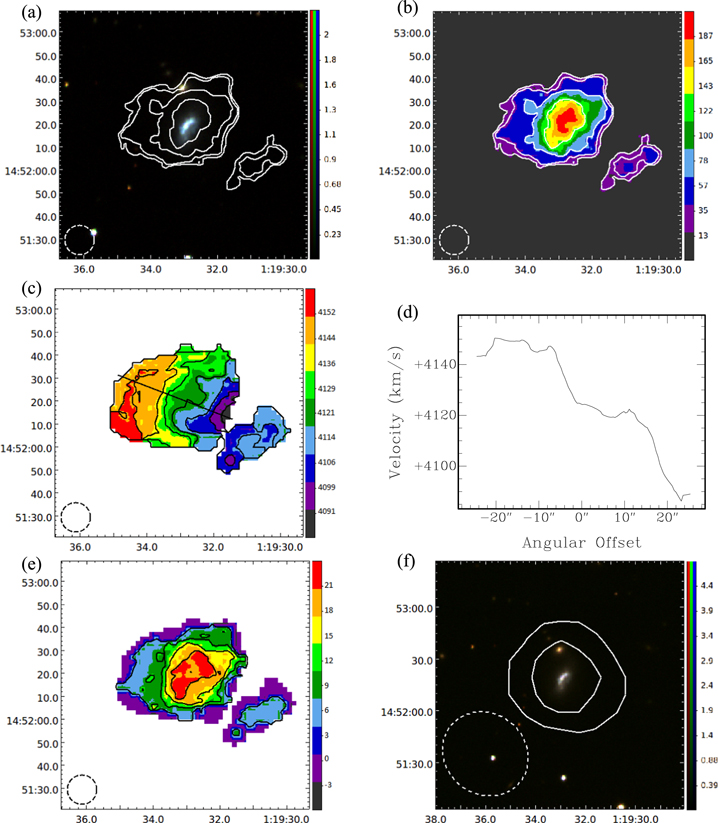
Figure 1. SDSS 0119+1452 (NGC 469): (a) Moment 0 contours made with a  beam overlaid on an SDSS DR9 gri image. Contours represent H i intensities equivalent to column densities of
  for n = 0, 1, 2, 3. Image units are analog to digital units (ADU). (b) Moment 0 map with the same contours as in (a). Map units are
  . (c) Moment 1 map with a thick line showing the major axis. Contours are
  . Map units are
  . (d) Velocities along the major axis slice shown in (c). (e) Moment 2 map with
  contours. Map units are
  . (f) Low-resolution Moment 0 contours made with a
  beam overlaid on an SDSS DR9 gri image. Contours represent H i intensities equivalent to column densities of
  for n = 0, 1. Image units are the same as in (a). The horizontal and vertical axes of each map are R.A. and decl. (J2000). Beam sizes are shown in the lower left corner of each map.
Download figure:
Standard image High-resolution image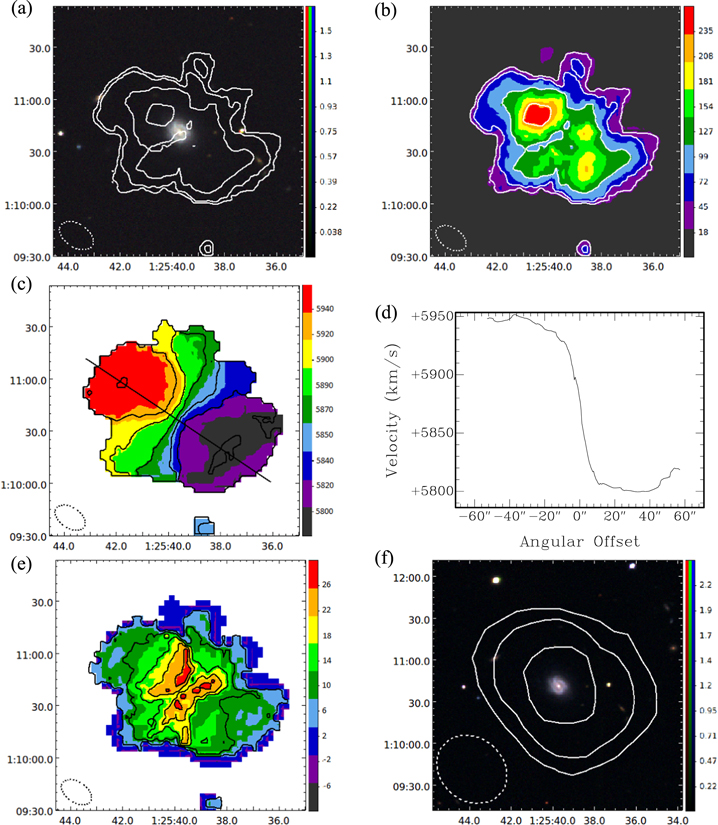
Figure 2. SDSS 0125+0110 (ARK 044): (a) Moment 0 contours made with a  beam overlaid on an SDSS DR9 gri image. Contours represent H i intensities equivalent to column densities of
  for n = 0, 1, 2, 3. Image units are analog to digital units (ADU). (b) Moment 0 map with the same contours as in (a). Map units are
  . (c) Moment 1 map with a thick line showing the major axis. Contours are
  . Map units are
  . (d) Velocities along the major axis slice shown in (c). (e) Moment 2 map with
  contours. Map units are
  . (f) Low-resolution Moment 0 contours made with a
  beam overlaid on an SDSS DR9 gri image. Contours represent H i intensities equivalent to column densities of
  for n = 0, 1, 2. Image units are the same as in (a). The horizontal and vertical axes of each map are R.A. and decl. (J2000). Beam sizes are shown in the lower left corner of each map.
Download figure:
Standard image High-resolution image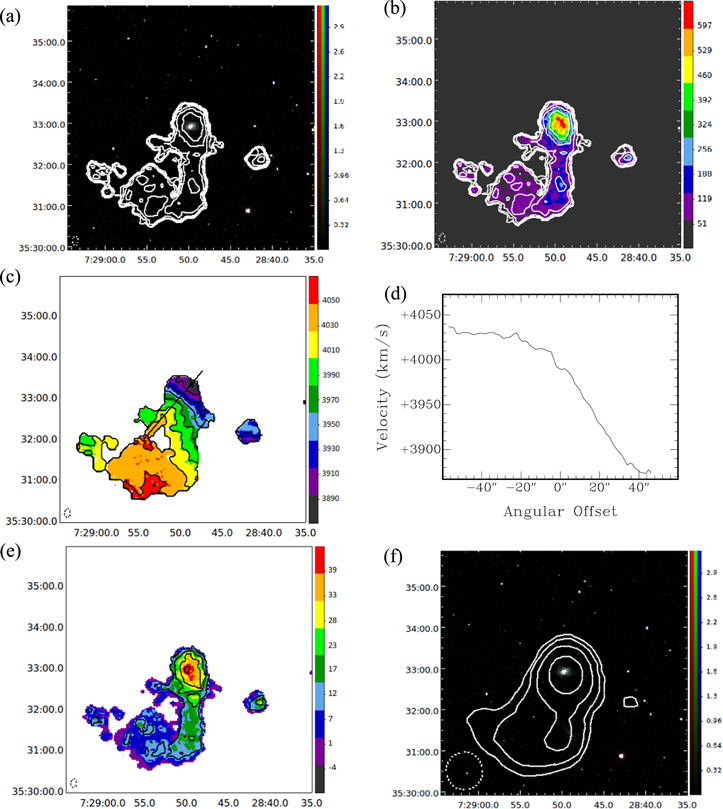
Figure 3. SDSS 0728+3532 (ARK 134): (a) Moment 0 contours made with a  beam overlaid on an SDSS DR9 gri image. Contours represent H i intensities equivalent to column densities of
  for n = 0, 1, 2, 3, 4, 5. Image units are analog to digital units (ADU). (b) Moment 0 map with the same contours as in (a). Map units are
  . (c) Moment 1 map with a thick line showing the major axis. Contours are
  . Map units are
  . (d) Velocities along the major axis slice shown in (c). (e) Moment 2 map with
  contours. Map units are
  . (f) Low-resolution Moment 0 contours made with a
  beam overlaid on an SDSS DR9 gri image. Contours represent H i intensities equivalent to column densities of
  for n = 0, 1, 2, 3. Image units are the same as in (a). The horizontal and vertical axes of each map are R.A. and decl. (J2000). Beam sizes are shown in the lower left corner of each map.
Download figure:
Standard image High-resolution image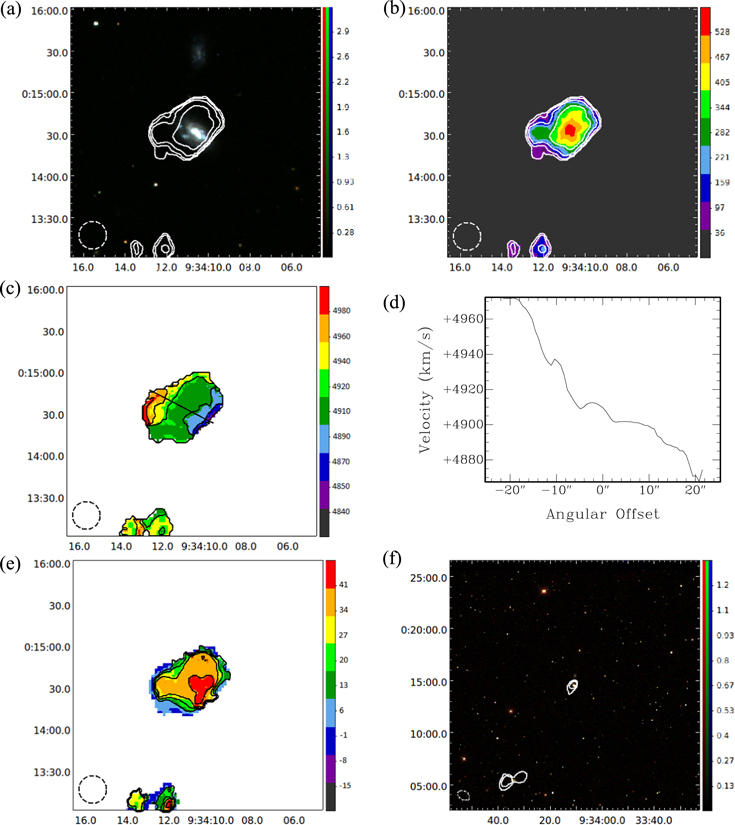
Figure 4. SDSS 0934+0014 (UGC 05097): (a) Moment 0 contours made with a  beam overlaid on an SDSS DR9 gri image. Contours represent H i intensities equivalent to column densities of
  for n = 0, 1, 2, 3. Image units are analog to digital units (ADU). (b) Moment 0 map with the same contours as in (a). Map units are
  . (c) Moment 1 map with a thick line showing the major axis. Contours are
  . Map units are
  . (d) Velocities along the major axis slice shown in (c). (e) Moment 2 map with
  contours. Map units are
  . (f) Low-resolution Moment 0 contours made with a
  beam overlaid on an SDSS DR9 gri image. Contours represent H i intensities equivalent to column densities of
  for n = 0, 1, 2. Image units are the same as in (a). The horizontal and vertical axes of each map are R.A. and decl. (J2000). Beam sizes are shown in the lower left corner of each map.
Download figure:
Standard image High-resolution image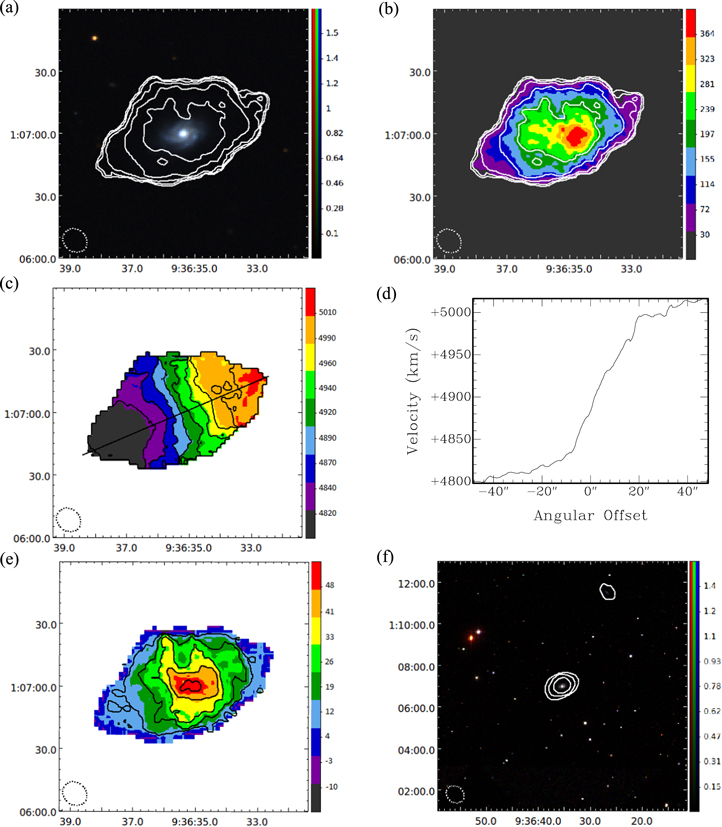
Figure 5. SDSS 0936+0106 (CGCG 007-009): (a) Moment 0 contours made with a  beam overlaid on an SDSS DR9 gri image. Contours represent H i intensities equivalent to column densities of
  for n = 0, 1, 2, 3, 4, 5. Image units are analog to digital units (ADU). (b) Moment 0 map with the same contours as in (a). Map units are
  . (c) Moment 1 map with a thick line showing the major axis. Contours are
  . Map units are
  . (d) Velocities along the major axis slice shown in (c). (e) Moment 2 map with
  contours. Map units are
  . (f) Low-resolution Moment 0 contours made with a
  beam overlaid on an SDSS DR9 gri image. Contours represent H i intensities equivalent to column densities of
  for n = 0, 1, 2. Image units are the same as in (a). The horizontal and vertical axes of each map are R.A. and decl. (J2000). Beam sizes are shown in the lower left corner of each map.
Download figure:
Standard image High-resolution image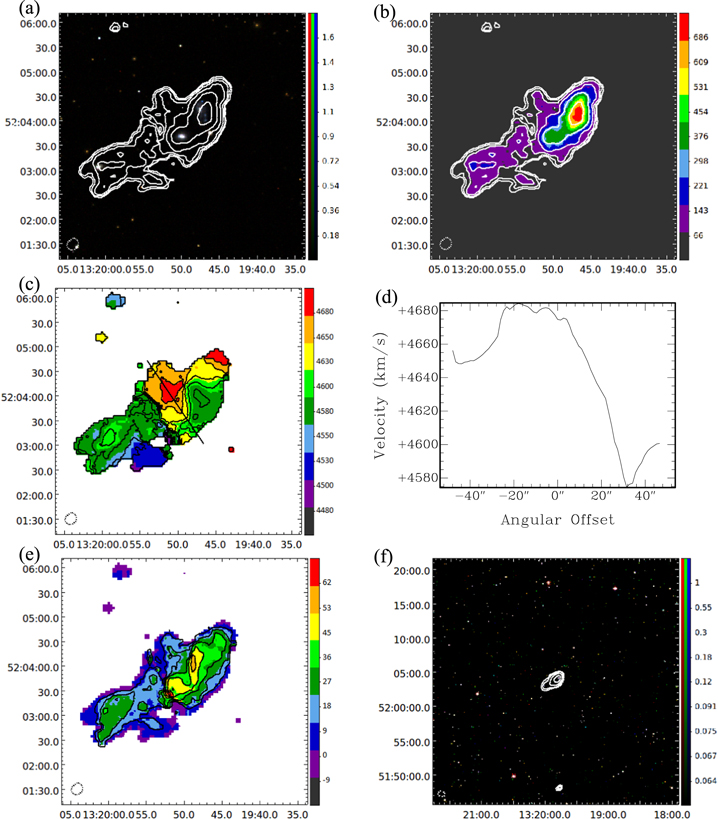
Figure 6. SDSS 1319+5203 (SBS 1317+523B): (a) Moment 0 contours made with a  beam overlaid on an SDSS DR9 gri image. Contours represent H i intensities equivalent to column densities of
  for n = 0, 1, 2, 3, 4, 5. Image units are analog to digital units (ADU). (b) Moment 0 map with the same contours as in (a). Map units are
  . (c) Moment 1 map with a thick line showing the major axis. Contours are
  . Map units are
  . (d) Velocities along the major axis slice shown in (c). (e) Moment 2 map with
  contours. Map units are
  . (f) Low-resolution Moment 0 contours made with a
  beam overlaid on an SDSS DR9 gri image. Contours represent H i intensities equivalent to column densities of
  for n = 0, 1, 2, 3. Image units are the same as in (a). The horizontal and vertical axes of each map are R.A. and decl. (J2000). Beam sizes are shown in the lower left corner of each map.
Download figure:
Standard image High-resolution image
Figure 7. SDSS 1402+0955 (NGC 5414): (a) Moment 0 contours made with a  beam overlaid on an SDSS DR9 gri image. Contours represent H i intensities equivalent to column densities of
  for n = 0, 1, 2, 3, 4. Image units are analog to digital units (ADU). (b) Moment 0 map with the same contours as in (a). Map units are
  . (c) Moment 1 map with a thick line showing the major axis. Contours are
  . Map units are
  . (d) Velocities along the major axis slice shown in (c). (e) Moment 2 map with
  contours. Map units are
  . (f) Low-resolution Moment 0 contours made with a
  beam overlaid on an SDSS DR9 gri image. Contours represent H i intensities equivalent to column densities of
  for n = 0, 1, 2, 3. Image units are the same as in (a). The horizontal and vertical axes of each map are R.A. and decl. (J2000). Beam sizes are shown in the lower left corner of each map.
Download figure:
Standard image High-resolution image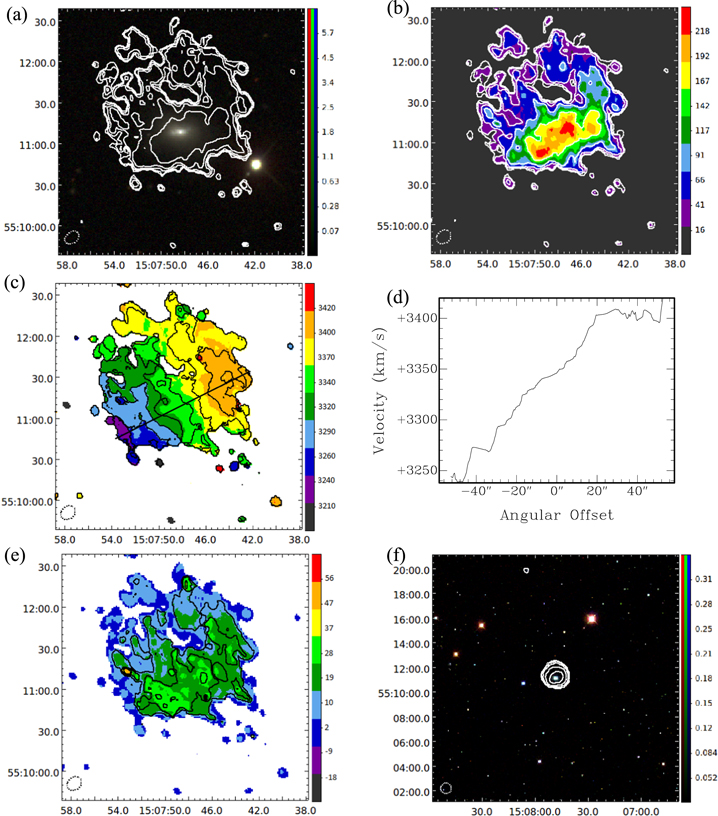
Figure 8. SDSS 1507+5511 (UGC 09737): (a) Moment 0 contours made with a  beam overlaid on an SDSS DR9 gri image. Contours represent H i intensities equivalent to column densities of
  for n = 0, 1, 2, 3, 4. Image units are analog to digital units (ADU). (b) Moment 0 map with the same contours as in (a). Map units are
  . (c) Moment 1 map with a thick line showing the major axis. Contours are
  . Map units are
  . (d) Velocities along the major axis slice shown in (c). (e) Moment 2 map with
  contours. Map units are
  . (f) Low-resolution Moment 0 contours made with a
  beam overlaid on an SDSS DR9 gri image. Contours represent H i intensities equivalent to column densities of
  for n = −2, −1, 0, 1, 2. Image units are the same as in (a). The spatial scale of this figure was chosen to include a detected companion 9' to the north. The horizontal and vertical axes of each map are R.A. and decl. (J2000). Beam sizes are shown in the lower left corner of each map.
Download figure:
Standard image High-resolution image2.3. VLA Observation and Reduction of Mrk 325
We observed the final galaxy, Mrk 325, with the VLA in the B and C configurations in 2003 December and 2002 November as part of projects AP463 and AP438, respectively. We also used data from the VLA archive taken as part of project AM361 in 1992 May and project AN62 in 1993 November. In all cases, we performed flux calibration via observations of 3C48 or 3C286, and phase calibration through regular observations of J2254+247 (B2251+244). We carried out the data reduction for each configuration separately in the usual manner using AIPS. Because the pointing center for the D configuration observations was different than the B and C configuration data, we made the data cubes by mosaicking the observations in Miriad9 (Sault et al. 1995). We made high-resolution and low-resolution moment maps for Mrk 325 in the same way as described in Section 2.2, shown in Figure 9.
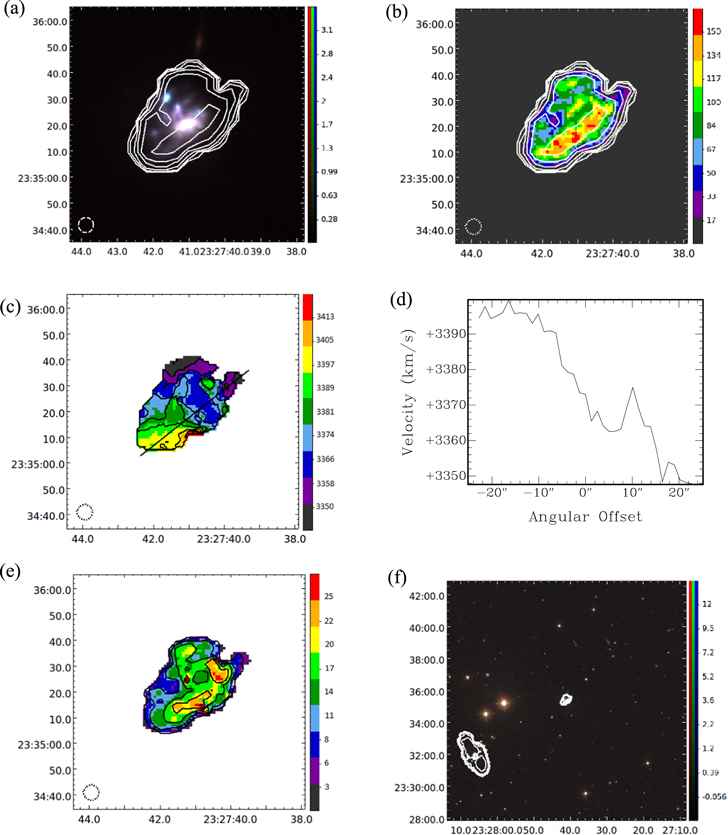
Figure 9. Mrk 325: (a) Moment 0 contours made with a  beam overlaid on an SDSS DR9 gri image. Contours represent H i intensities equivalent to column densities of
  for n = 0, 1, 2, 3, 4, 5. Image units are analog to digital units (ADU). (b) Moment 0 map with the same contours as in (a). Map units are
  . (c) Moment 1 map with a thick line showing the major axis. Contours are
  . Map units are
  . (d) Velocities along the major axis slice shown in (c). (e) Moment 2 map with
  contours. Map units are
  . (f) Low-resolution Moment 0 contours made with a
  beam overlaid on an SDSS DR9 gri image. Contours represent H i intensities equivalent to column densities of
  for n = 0, 1, 2, 3, 4, 5. Image units are the same as in (a). For a
  moment 0 map of Mrk 325, see Figure 17 of Nordgren et al. (1997). The horizontal and vertical axes of each map are R.A. and decl. (J2000). Beam sizes are shown in the lower left corner of each map.
Download figure:
Standard image High-resolution image3. Results
3.1. H i Content
The high-resolution Moment 0 maps in Figures 1–9 (panel a in each figure) show heterogeneous H i morphologies. Despite the variety of morphologies, all of the LCBGs in this sample have H i emission whose maximum is within one beamwidth of with the center of their optical emission, and extends beyond their stellar radii (see Figure 10 for plots of the galaxies' optical and H i emission along their major axes). Seven (78%) of the galaxies have companions that are detected in our H i maps (see Table 3). In addition, seven of the LCBGs (SDSS 0119+1452, SDSS 0728+3532, SDSS 0934+0014, SDSS 1319+5203, SDSS 1402+0955, SDSS 1507+5511, and Mrk 325) have H i intensity contours that appear asymmetric.
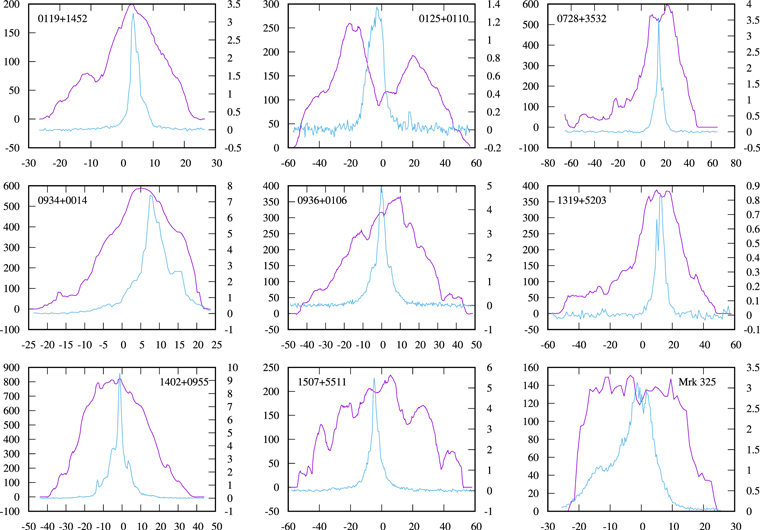
Figure 10. H i (purple) and optical (blue) intensities measured along each galaxy's major axis (shown in panel c of Figures 1–9). The H i intensities are measured from the Moment 0 maps in units of  (left vertical axes), and the optical intensities are measured from the SDSS g images in units of ADU (right vertical axes). The horizontal axes show angular distance along the major axis in arcseconds. The peak optical emission is within one beam major axis of the peak H i emission for all of the galaxies.
Download figure:
Standard image High-resolution imageTable 3. Companion Sources Visible in Maps
| LCBG | Companion Name | R.A. | Decl. | Separation | Separationa |
 b
b
|
Detected? |
|---|---|---|---|---|---|---|---|
| (J2000) | (J2000) | (arcminutes) | ( ) ) |
( ) ) |
|||
| SDSS 0119+1452 | NGC 471 | 01:19:59.6 | +14:47:10 | 8.2 | 90 | 4137 | N |
| SDSS 0728+3532 | GALEXASCJ072841.30+353206.1c | 07:28:41.3 | +35:32:06 | 2.0 | 24 | 3930 | Y |
| SDSS 072849.02+353124.6 | 07:28:49.0 | +35:31:24 | 1.5 | 18 | 4010 | Y | |
| SDSS 0934+0014 | SDSS J093410.47+001528.5 | 09:34:10.5 | +00:15:29 | 1.0 | 11 | 4665 | N |
| UGC 05099 | 09:34:34.2 | +00:05:23 | 11 | 123 | 4954 | Y | |
| SDSS 0936+0106 | SDSS 093626.68+011128.8 | 09:36:26.7 | +01:11:28 | 5.0 | 44 | 4900 | Y |
| SDSS 1319+5203 | SBS 1317+520d | 13:19:46.2 | +51:48:06 | 15.6 | 270 | ⋯ | Y |
| SBS 1317+523A | 13:19:47.5 | +52:04:13 | 0.6 | 11 | 4588 | Y | |
| Mrk 251 | 13:20:01.0 | +52:03:03 | 1.8 | 32 | 4581 | Y | |
| SDSS 1507+5511 | SDSS 150804.21+551954.0 | 15:08:04.2 | +55:19:54 | 9.0 | 69 | 3385 | Y |
| Mrk 325 | Mrk 326 | 23:28:06.1 | +23:31:52 | 6.7 | 70 | 3519 | Y |
Notes.
aProjected separation from the target galaxy in multiples of the target galaxy's .
b
.
b
 is approximated from moment maps if detected, or taken from NED if not detected.
cSDSS classifies this object as a star; NED classifies it as a UV source.
dNED classifies this object as a QSO at
is approximated from moment maps if detected, or taken from NED if not detected.
cSDSS classifies this object as a star; NED classifies it as a UV source.
dNED classifies this object as a QSO at  .
.
Download table as: ASCIITypeset image
We measured H i profiles for each LCBG using the AIPS task ISPEC. We used the low-resolution data cubes in order to avoid missing short spacings. We chose spatial boundaries for ISPEC using the 2–3σ extent of each LCBG's H i emission in low-resolution Moment 0 maps. In the case of multiple galaxies in a common H i envelope, we measured the H i profile of the entire envelope, because identifying boundaries for each galaxy while excluding H i emission associated with other galaxies or tidal features in the envelope introduced large uncertainties. We note that this means that measurements of quantities such as  using the H i profiles of LCBGs in larger envelopes (SDSS 0728+3532 and SDSS 1319+5203) also encompass the entire envelope, including multiple galaxies.
We calculated an integrated flux for each galaxy by summing the flux in each channel within the first crossing at 0 mJy on each side of the peak and multiplying the sum by one channel width. We found uncertainties on the integrated fluxes following the method of Chandra et al. (2004). To do this, we measured the rms of the emission within an aperture that did not spatially coincide with a galaxy's position. We made this measurement in a velocity channel of each galaxy's low-resolution cube that did not contain any H i emission from the target galaxy or any of its companions. We then added this value in quadrature with 10% of the galaxy's peak flux (a conservative estimate of the GMRT's flux calibration uncertainty) so that the uncertainty in each galaxy's integrated flux is  . After finding their integrated H i fluxes and uncertainties, we then calculated
  for each galaxy (or group of galaxies, in the case of systems with multiple galaxies sharing a common H i envelope) using the equation
where  is the integrated H i flux within the spectrum's crossing of 0 mJy and
  is the galaxy's distance derived from dividing the recession velocity by the Hubble constant. This equation assumes that a galaxy's H i is optically thin, and that it is at low redshift, which are reasonable assumptions for this sample. The H i profile properties for each galaxy are listed in Table 4.
Table 4. LCBG H i Profile Properties
| Galaxy |
 a
a
|
W20b |

|

|
 c
c
|
Companion in |
|---|---|---|---|---|---|---|
| (km s−1) | (km s−1) | (Jy km s−1) |

|
GBT beam?d | ||
| SDSS 0119+1452 | 4123 ± 7 | 52.1 ± 13.6 | 1.0 ± 0.4 | 0.85 ± 0.29 | 0.4 | Y |
| SDSS 0125+0110 | 5875 ± 7 | 126.8 ± 13.8 | 3.3 ± 0.3 | 5.4 ± 0.5 | ⋯ | ⋯ |
| SDSS 0728+3532e | 3962 ± 7 | 166.1 ± 13.6 | 9.8 ± 1.2 | 7.4 ± 0.9 | 1.2 | N |
| SDSS 0934+0014 | 4903 ± 7 | 125.8 ± 13.7 | 2.2 ± 0.4 | 2.5 ± 0.5 | 0.5 | Y |
| SDSS 0936+0106 | 4909 ± 7 | 181.2 ± 13.7 | 2.0 ± 0.4 | 2.3 ± 0.5 | 0.6 | Y |
| SDSS 1319+5203e | 4607 ± 7 | 139.4 ± 13.7 | 11.2 ± 0.7 | 11.4 ± 0.7 | 1.4 | Y |
| SDSS 1402+0955 | 4251 ± 7 | 262.3 ± 13.7 | 4.9 ± 1.1 | 4.3 ± 0.9 | 0.7 | Y |
| SDSS 1507+5511 | 3358 ± 7 | 124.2 ± 13.6 | 3.8 ± 0.4 | 2.0 ± 0.2 | 1.0 | N |
| Mrk 325f | 3364 ± 5 | 54.1 ± 10.3 | 3.2 ± 0.4 | 1.7 ± 0.2 | 0.3 | Y |
Notes.
a is measured halfway between the channels used to measure W20. The reported uncertainty is half of a channel width.
bW20 is corrected for random motions following Equation (12) of Tully & Fouque (1985). No correction for inclination angle has been made. The reported uncertainty is one channel width.
c
is measured halfway between the channels used to measure W20. The reported uncertainty is half of a channel width.
bW20 is corrected for random motions following Equation (12) of Tully & Fouque (1985). No correction for inclination angle has been made. The reported uncertainty is one channel width.
c
 values are taken from Garland et al. (2004).
dTaken from Table 1 of Garland et al. (2004).
eProperties listed are for the entire H i envelope, which contains multiple galaxies.
fMeasurements are taken from the high-resolution cube. For data measured from a low-resolution cube, see Table 4 of Nordgren et al. (1997). Those authors found
values are taken from Garland et al. (2004).
dTaken from Table 1 of Garland et al. (2004).
eProperties listed are for the entire H i envelope, which contains multiple galaxies.
fMeasurements are taken from the high-resolution cube. For data measured from a low-resolution cube, see Table 4 of Nordgren et al. (1997). Those authors found  , which is 60% of the Garland et al. (2004) single-dish value.
Download table as: ASCIITypeset image
We compare the  we measure for the LCBGs in our sample to those measured from the integrated line profiles observed by Garland et al. (2004) for the same LCBGs using single-dish observations in Table 4. Many of the LCBGs that Garland et al. (2004) detected had optical companions within the GBT beam. If these companions contain H i, they will add emission to the observed H i spectrum, and thus increase the measured
  above what would be measured if the target LCBG was able to be observed by itself. We flag the galaxies that Garland et al. (2004) identified as having companions within the GBT beam in Table 4.
In contrast to previous single-dish observations, our observations can spatially resolve the LCBGs from their companions. Thus the  that we measure by integrating over the intensities measured in each velocity channel within the spatial boundaries of each galaxy's H i map are more likely to reflect the true
  of the target galaxies than those measured from integrating over the H i spectrum observed in an unresolved single pointing. In addition, having unresolved companions or tidal features in the beam can act to broaden a galaxy's observed linewidth, and thus increase its inferred rotation velocity. Since LCBGs' possible evolutionary scenarios depend on whether they are rotation-dominated, dispersion-dominated, or show signatures of interactions, it is important to determine whether LCBGs' linewidths can be interpreted as the result of rotation. We discuss this further in Section 4.2.
3.2. Velocity Measurements
As is shown in the high-resolution Moment 1 maps (panel c in Figures 1–9), all of the LCBGs in our sample show a velocity gradient in their Moment 1 maps, which is evidence of rotation. We measured systemic and rotation velocities ( ) for the LCBGs in our sample using the high-resolution Moment 1 maps for each LCBG by measuring a slice of velocities along the galaxies' major axes (see panel d of Figures 1–9).
We determined the major axis of each galaxy using a visual inspection of their Moment 1 maps to identify features of rotation. We then used the program KPVSLICE from the Karma10
package of reduction tools to produce position–velocity diagrams from the data cube along this major axis. This method produced measured, rather than fit, rotation curves from which we measured  at the half-light radius (
 ), the extent of ongoing star formation (
 , the radius at which the galaxy has
  ), and the extent of neutral hydrogen (
 , calculated as half of the galaxy's diameter across its major axis between locations with a column density of
  , or
, or  ). We note that while this method produced easily measurable and reproducible values of
  that do not depend on the velocities projected onto the Moment 1 map because they are measured directly from the data cube, these velocities are only valid along the H i major axis. We report the uncertainty on
  as one channel width corrected for optical inclination. We also calculated recession velocities as the velocity halfway between the velocities at each
  edge along the major axis, and
  using
using  at
at  and
and  . We report these values in Table 5.
Table 5. Velocities and Dynamical Masses from Cuts along Major Axes
| Galaxy |
 a
a
|
 b
b
|
Dc | R25d |
 e
e
|
 f
f
|
 g
g
|
iopth |

|
|---|---|---|---|---|---|---|---|---|---|
| (km s−1) | (km s−1) | (Mpc) | (kpc) | (km s−1) | (kpc) | (km s−1) | (deg) | ( ) ) |
|
| SDSS 0119+1452j | 4118.6 ± 13.6 | 4118.6 ± 13.6 | 58.8 ± 0.2 | 7.3 ± 1.1 | 27.1 ± 13.6 | 6.0 ± 0.1 | 27.1 ± 13.6 | 61.5 ± 0.2 | 0.13 ± 0.14 |
| SDSS 0125+0110 | 5877.1 ± 13.7 | 5877.1 ± 13.7 | 84.0 ± 0.2 | 7.9 ± 1.4 | 68.6 ± 13.7 | 20.9 ± 0.2 | 68.6 ± 13.7 | 35.9 ± 0.5 | 6.7 ± 9.8 |
| SDSS 0728+3532 | 3944.1 ± 13.5 | 3964.4 ± 13.5 | 56.6 ± 0.2 | 5.3 ± 1.1 | 54.2 ± 13.5 | 14.2 ± 0.2 | 74.5 ± 13.5 | 42.7 ± 0.3 | 4.0 ± 3.2 |
| SDSS 0934+0014 | 4905.8 ± 13.6 | 4926.3 ± 13.6 | 70.4 ± 0.2 | 6.5 ± 1.2 | 40.9 ± 13.6i | 6.1 ± 0.7 | 47.7 ± 13.6 | 56.4 ± 0.2 | 0.47 ± 0.29 |
| SDSS 0936+0106 | 4883.5 ± 13.1 | 4909.7 ± 13.1 | 70.1 ± 0.2 | 7.4 ± 1.2 | 91.7 ± 13.1 | 15.0 ± 0.2 | 104.8 ± 13.1 | 48.5 ± 0.3 | 6.9 ± 4.1 |
| SDSS 1319+5203 | 4657.4 ± 13.6 | 4623.4 ± 13.6 | 66.0 ± 0.2 | 5.4 ± 1.8 | 47.6 ± 13.6 | 15.8 ± 0.4 | 20.4 ± 13.6 | 43.2 ± 0.5 | 0.33 ± 0.56 |
| SDSS 1402+0955 | 4213.0 ± 13.6 | 4233.4 ± 13.6 | 60.5 ± 0.2 | 8.6 ± 1.1 | 115.3 ± 13.6 | 10.5 ± 0.2 | 115.3 ± 13.6 | 51.2 ± 0.2 | 5.3 ± 2.1 |
| SDSS 1507+5511 | 3347.9 ± 13.5 | 3320.9 ± 13.5 | 47.4 ± 0.2 | 7.8 ± 0.8 | 67.4 ± 13.5 | 12.1 ± 0.3 | 80.9 ± 13.5 | 54.8 ± 0.2 | 2.8 ± 1.2 |
| Mrk 325j | 3373.9 ± 10.3 | 3368.8 ± 10.3 | 48.1 ± 0.1 | 7.2 ± 0.8 | 25.8 ± 10.3 | 5.4 ± 0.2 | 25.8 ± 10.3 | 28.5 ± 0.4 | 0.37 ± 0.66 |
Notes.
aVelocities are measured at the position of the optical galaxy along the major axis. bSystemic velocities are measured at the halfway point of the major axis along the H i diameter. cDistances are .
d
.
d
 taken from Hyperleda.
eUncorrected rotation velocity at
taken from Hyperleda.
eUncorrected rotation velocity at  .
f
.
f
 is the distance between the optical center of the galaxy and the contour with a column density of 1
  .
gUncorrected rotation velocity at
.
gUncorrected rotation velocity at  .
hInclinations calculated using the major and minor axis lengths measured in the SDSS i band using an exponential disk profile.
iThe H i of SDSS 0934+0014 is less extended than the optical galaxy on one side. We took the velocity at the side where the H i is more extended than the optical galaxy.
jSDSS 0119+1452 and Mrk 325 are less extended in H i than in the optical, so
.
hInclinations calculated using the major and minor axis lengths measured in the SDSS i band using an exponential disk profile.
iThe H i of SDSS 0934+0014 is less extended than the optical galaxy on one side. We took the velocity at the side where the H i is more extended than the optical galaxy.
jSDSS 0119+1452 and Mrk 325 are less extended in H i than in the optical, so  is taken to be the velocity at
  .
.
Download table as: ASCIITypeset image
We attempted to fit rotation curves using the AIPS task GAL and the tilted-ring fitting code  11
(Di Teodoro & Fraternali 2015) to each of these LCBGs to determine their H i centers,
11
(Di Teodoro & Fraternali 2015) to each of these LCBGs to determine their H i centers,  , recession velocities, and inclinations. While we were able to fit rotation curves to the galaxies if we assumed a rotation curve shape and held some parameters fixed, it was not possible to fit well-constrained rotation curves for the galaxies that allowed the centers, extents, position angles, and inclinations of the galaxies to be free parameters and did not assume a rotation curve shape, even when using the Moment 0 maps as weights.
The  values derived from measuring along the major axis of each galaxy are less dependent on models that have systematic uncertainties than rotation curve fits, and are more easily reproduced. Thus, we use the velocities along the major axis shown in Table 5 when discussing
  in the remainder of the paper.
We then calculated  for each LCBG using the equation

where R is the radius at which  is measured (and within which
  applies).
  is corrected for inclination by

where i is the optical inclination calculated using  , where
  is the ratio of each galaxy's minor and major axis lengths in the SDSS i band using an exponential galaxy profile as reported in each galaxy's SDSS DR9 photometry table.
We note that the  , and thus
  , that we calculate depend on the galaxies' inclinations. Since we do not have the spatial or velocity resolution to reliably fit rotation curves and inclination models to the LCBGs in our sample, we have not been able to accurately measure the inclinations of the galaxies' gas. We are thus restricted to the same assumption that Garland et al. (2004) made: the gas in these galaxies is inclined at the same angle with respect to our line of sight as their optical components. Since the galaxies appear to have disk-like rotation, we do not have evidence that this is an unreasonable assumption. de Blok et al. (2008) compared the optical inclinations of nearby galaxies for which they measured high-resolution H i maps to inclinations measured by fitting ellipses to the galaxies' H i contours and inclinations derived from rotation curve fitting. For these galaxies, the average difference between the optical inclinations and the inclinations from the H i disk contours is
  . The average difference between the optical inclinations and the inclinations derived from rotation curve fitting was
  . They determined that for finding the average inclination of a disk, using H i contours is just as reliable as using the optical inclination. We use optical inclinations to correct
  in this paper, and acknowledge that this introduces a systematic uncertainty into the
  values we report.
3.3. Velocity Dispersions
We calculated the average intensity-weighted velocity dispersions, σ, of the LCBGs in our sample by taking the average pixel values of the Moment 2 maps at four locations: (1) within a circle bordered by the half-light radius,  ; (2) within a circle bordered by R25; (3) for the whole disk within
  ; and (4) outside of the region within R25. We chose the R25 radius limit because it has been previously found that R25 generally signifies the outer limit of active star formation in dwarf and spiral galaxies (Tamburro et al. 2009). Thus, σ within R25 is a measure of the gas properties that affect and are affected by galaxies' star formation (primarily by processes such as supernovae that trace recent star formation), while σ outside of R25 probes the kinematics of the galaxies beyond the region where they actively form stars (Tamburro et al. 2009). These values of σ are tabulated in Table 6.
Table 6. Velocity Dispersions
| Galaxy |
 a
a
|
 b
b
|

|
 c
c
|
 d
d
|

|
|---|---|---|---|---|---|---|
( ) ) |
( ) ) |
( ) ) |
( ) ) |
|||
 e
e
|
 f
f
|
 g
g
|

|

|
 h
h
|
|
( ) ) |
( ) ) |
( ) ) |
(Gyr) | |||
| SDSS 0119+1452i | 14.1 ± 6.5 | 7.7 ± 15.5 | 0.55 ± 1.13 | 12.1 ± 6.7 | 30.8 ± 15.9 | 2.5 ± 1.9 |
| 12.6 ± 6.3 | 29.5 ± 3.4 | 30.8 ± 15.9 | 2.4 ± 1.8 | 1.0 ± 0.6 | 1.2 ± 1.3 | |
| SDSS 0125+0110j | <9.6 | 70.2 ± 54.7 | ⋯ | 20.1 ± 4.3 | 117.0 ± 85.7 | 5.8 ± 4.4 |
| 11.2 ± 6.6 | 8.7 ± 5.2 | 117.0 ± 85.7 | 10.4 ± 9.8 | 13.4 ± 12.7 | 19 ± 27 | |
| SDSS 0728+3532 | 30.0 ± 6.1 | 30.0 ± 22.7 | 1.0 ± 0.8 | 33.0 ± 5.2 | 80.0 ± 35.1 | 2.4 ± 1.1 |
| 20.6 ± 11.1 | 10.0 ± 7.3 | 109.9 ± 44.4 | 5.3 ± 3.6 | 11.0 ± 9.1 | 3.7 ± 4.2 | |
| SDSS 0934+0014 | 37.5 ± 5.4 | 8.2 ± 16.4 | 0.22 ± 0.44 | 34.6 ± 8.7 | 49.1 ± 17.3 | 1.4 ± 0.6 |
| 35.3 ± 8.2 | 12.3 ± 13.6 | 57.3 ± 17.6 | 1.6 ± 0.6 | 4.7 ± 5.3 | 0.28 ± 0.16 | |
| SDSS 0936+0106 | 28.3 ± 7.3 | 70.0 ± 25.7 | 2.5 ± 1.1 | 30.5 ± 10.0 | 122.5 ± 37.3 | 4.0 ± 1.8 |
| 21.0 ± 12.7 | 9.4 ± 7.4 | 140.0 ± 41.5 | 6.7 ± 4.5 | 14.9 ± 12.5 | 4.8 ± 5.9 | |
| SDSS 1319+5203 | 29.2 ± 13.7 | 9.9 ± 20.6 | 0.34 ± 0.72 | 39.5 ± 7.0 | 69.5 ± 42.8 | 1.8 ± 1.1 |
| 24.7 ± 14.3 | 16.8 ± 12.6 | 29.8 ± 25.7 | 1.2 ± 1.3 | 1.8 ± 2.0 | 0.77 ± 1.11 | |
| SDSS 1402+0955 | 33.1 ± 7.2 | 43.5 ± 18.8 | 1.3 ± 0.6 | 31.5 ± 14.5 | 148.0 ± 29.4 | 4.7 ± 2.4 |
| 27.1 ± 16.1 | 7.3 ± 9.7 | 148.0 ± 29.4 | 5.5 ± 3.4 | 20.3 ± 27.2 | 2.1 ± 2.5 | |
| SDSS 1507+5511 | 18.3 ± 3.0 | 8.3 ± 16.6 | 0.45 ± 0.91 | 18.5 ± 7.5 | 82.5 ± 20.5 | 4.5 ± 2.1 |
| 15.2 ± 8.3 | 8.7 ± 8.1 | 99.0 ± 22.0 | 6.5 ± 3.8 | 11.4 ± 10.9 | 5.2 ± 5.8 | |
| Mrk 325i | 9.7 ± 6.2 | 32.5 ± 34.0 | 3.4 ± 4.1 | 13.2 ± 6.0 | 54.1 ± 48.7 | 4.1 ± 4.1 |
| 13.4 ± 5.9 | 13.1 ± 6.3 | 54.1 ± 48.7 | 4.0 ± 4.0 | 4.1 ± 4.2 | 1.6 ± 2.0 |
Notes.
a is the average value of the Moment 2 map within
  .
b
.
b
 is the rotation velocity measured at
  corrected for inclination.
c
corrected for inclination.
c
 is the average value of the Moment 2 map within R25.
d
is the average value of the Moment 2 map within R25.
d
 is the rotation velocity measured at R25 corrected for inclination.
e
is the rotation velocity measured at R25 corrected for inclination.
e
 is the average value of the Moment 2 map within
  .
f
.
f
 is the average value of the Moment 2 map outside of R25.
g
is the average value of the Moment 2 map outside of R25.
g
 is the rotation velocity measured at
  , corrected for inclination
h
, corrected for inclination
h
 is the inspiral time for clumps to reach the center of a rotating disk.
iR25 is larger than
is the inspiral time for clumps to reach the center of a rotating disk.
iR25 is larger than  for SDSS 0119+1452 and Mrk 325.
jThe correction for beam smearing for SDSS 0125+0110 is larger than the measured
for SDSS 0119+1452 and Mrk 325.
jThe correction for beam smearing for SDSS 0125+0110 is larger than the measured  . The reported value is a
  upper limit.
Download table as: ASCIITypeset image
Since the LCBGs'  are not well-resolved by the beams in the high-resolution maps (
 on average, with a range of 0.45–1.9), beam smearing is likely to affect the velocity dispersions within
  . To correct for the effects of beam smearing in the centers of the LCBGs that we observed, we applied a correction to
  following Di Teodoro & Fraternali (2015) and Stott et al. (2016). To find the intrinsic velocity dispersion of the H i, we used the equation
  . In this equation,
  is the average velocity dispersion within
  measured from the Moment 2 map and corrected for beam smearing. This beam smearing correction is done by subtracting the velocity gradient within
  (
( , where
  is the number of pixels along
  and
and  is half of the velocity gradient between opposite points at
  along the major axis, uncorrected for inclination).
  is the estimated contribution to the observed velocity dispersion from instrumental effects due to the finite velocity resolution of the telescopes (
 ). This correction decreased
  by an average of 27% with respect to the uncorrected average velocity dispersion within
  , with a standard deviation of 10%. For SDSS 0125+0110, we only report a
  upper limit for the velocity dispersion within
  because subtracting the correction from the measured average velocity dispersion within
  resulted in a negative number. We do not expect beam smearing to have a significant contribution to the velocity dispersion at larger radii (R25 is on average 4.4 times larger, and
  is on average 6.8 times larger than the beam radius along the major axis for the LCBGs in our sample), so we only apply the correction to
  .
.
We find that the areas of highest σ tend to coincide with the optical centers of the LCBGs in our sample, similar to what Tamburro et al. (2009) measured for spiral galaxies. This is true not only for the relatively isolated LCBGs, but also for LCBGs with companions (even those with companions in a common H i envelope, with obvious evidence of gas interactions and disturbed morphology).
We also calculated the ratio of each LCBG's  (corrected for inclination) at a given radius to its average σ inside of that radius,
  , to determine the relative contributions of ordered rotation and disordered motion of each galaxy's H i emission. A galaxy's
  values are indicative of whether it has bulge-like or disk-like behavior, with values of
  signifying that random motions of the individual gas clouds dominate over rotation. Such values of
  are typically present in a galaxy's bulge, if it has one, while values of
  can be found in "pseudobulges," which are built up by internal processes and maintain some rotation (for a review, see Kormendy & Kennicutt 2004). We also wanted to investigate possible gravitational instabilities in the disks as a potential trigger for star formation, which can be traced by comparing
  to the amount of gas available in the disk. In Table 6, we show values of
  within several radii. We find that
  increases at larger radii, with the highest values occurring when
  is measured outside of R25, and the lowest values occurring within
  . We discuss the implications of LCBGs'
  values in Section 4.3.
4. Discussion
4.1. Companions, Mergers, and Interactions
It has been hypothesized that LCBGs' bright, blue, strongly star-forming appearances are due to star formation triggered by major and minor mergers (Amram & Östlin 2001; Östlin et al. 2001). These authors point out that LCBGs tend to have asymmetrical stellar distributions and non-uniform rotation curves, which are suggestive of mergers and interactions. In contrast, Werk et al. (2004) find that the majority of their sample of local LCBGs have symmetric morphologies. It is known that star formation can be triggered by mergers and interactions, so it would not be surprising if LCBGs were merger-driven. However, Garland et al. (2015) found using optical data that only 20% of the galaxies in their sample of local (D < 76 Mpc) LCBGs are in merging systems. In our sample, two of the nine galaxies have H i gas that overlaps with the gas of another galaxy, which is consistent with the merger rate of the Garland et al. (2015) sample. The relatively low percentage of LCBGs in merging systems suggests that the LCBGs in our sample do not seem to require ongoing mergers to trigger their star formation.
Even though the LCBGs in our sample and the sample observed by Garland et al. (2015) are not preferentially undergoing current major mergers, LCBGs have been observed to be commonly found in denser environments where close encounters with other galaxies that disturb their gas are more likely. Garland et al. (2015) found that in their sample, 40% of LCBGs are found in clusters. Crawford et al. (2011) found that from  , LCBGs are more likely to reside in denser environments at lower redshifts than at higher redshifts, and Crawford et al. (2014) found that LCBGs tend to reside in the outer regions of clusters. Those authors hypothesize that in intermediate-redshift clusters, LCBGs are gas-rich blue galaxies whose star formation is triggered during their first infall into the cluster (Crawford et al. 2011, 2014). The LCBGs in our sample tend to have other galaxies nearby. In our sample, seven out of nine LCBGs have companions within one GBT beamwidth at 1.4 GHz, which is 167 kpc across at the average distance of the LCBGs in our sample, and three of the nine LCBGs have companions within one Arecibo beamwidth at 1.4 GHz, which is 56 kpc across at the average distance of the LCBGs in our sample. Six out of those seven LCBGs with companions have companions that we detect in our H i maps, and five of those seven have detected companions within ∼10 times the LCBGs' H i radii (
 ) and within 100
  of the LCBGs' systemic velocities. Seven of the nine LCBGs have disturbed gas properties that may be the result of an interaction with a companion, such as irregular morphologies, H i major axes that are offset in position angle from optical major axes, and disturbed velocity fields. Because this is not the case for every LCBG in our sample, we do not have strong evidence from this study that star formation in LCBGs must be triggered solely by interactions, though interactions may contribute to the star formation properties of some LCBGs. We discuss an additional potential cause of star formation in LCBGs in Section 4.4.1.
4.2. Comparison with Single-dish Results
One of the primary goals of this study was to investigate how results from single-dish observations of nearby LCBGs compare to those derived from resolved maps. Since LCBGs are unresolved at the distances at which they are common, it is important to determine whether unresolved observations of these galaxies are sufficient to describe their global properties and predict their evolutionary paths. Eight of the LCBGs in our sample were observed with the GBT by Garland et al. (2004) at a resolution of  , which is large with respect to their
  . We compare the
  of these galaxies derived from our resolved observations and the unresolved observations of Garland et al. (2004) in the last column of Table 4 (SDSS 0125+0110 was not observed by Garland et al. 2004, and so we exclude it from these comparisons). We find that for six of the eight LCBGs common to both samples, the single-dish observations generate an equal or greater
  than what we calculate from resolved observations. We recover more H i emission for two of the LCBGs in our sample (SDSS 0728+3532 and SDSS 1319+5203) than was measured by Garland et al. (2004), which is likely due to those galaxies residing in H i envelopes that include other galaxies (the H i masses we report for those two LCBGs are for the entire envelope), though their H i envelopes are unresolved with the GBT beam. On average, the
  that we measure is 76% of what Garland et al. (2004) measured in their single-dish observations, although there is a large dispersion (40%) between the values obtained in both measurements.
We note that we used slightly different distances to calculate  than Garland et al. (2004) did. The recession velocities we measured, and thus the distances we calculated, were on average
  lower than those measured by Garland et al. (2004). This translates to a difference of
  , and no galaxy had a difference of more than
  . If we calculate
  using distances derived from the same
  that Garland et al. (2004) used, we measure
  of the H i that Garland et al. (2004) did. We will use the distances employed by Garland et al. (2004) for the remainder of the comparisons in this section.
In comparison, in resolved observations of five LCBGs with the VLA, Garland et al. (2007) measured values of  that were on average 61% of the measured single-dish values from Garland et al. (2004), with a similarly large dispersion. If we remove the two galaxies that reside in larger H i envelopes from consideration, we recover on average 59% of the
  that Garland et al. (2004) measured for the remaining six galaxies, with a dispersion of 26%, which is consistent with the Garland et al. (2007) result.
We also compare the inclination-corrected  and
and  values we derive from our data cubes to those calculated from W20 corrected for inclination in the Garland et al. (2004) sample in Table 7. With the exception of SDSS 1507+5511, the single-dish
  values calculated by Garland et al. (2004) using half of W20 corrected for inclination are larger than the inclination-corrected
  values that we measure using a cut along the major axis (
 ). Since the observations of Garland et al. (2004) were made with beam sizes large enough to include contributions from companion galaxies in the case of SDSS 0119+1452, SDSS 0934+0014, SDSS 0936+0106, SDSS 1319+5203, and SDSS 1402+0955, and tidal features in the case of SDSS 0728+3532 and SDSS 1319+5203, their measurements of W20 are not spatially resolved enough to distinguish the velocity contributions of the LCBGs from the contributions of their nearby companions.
Table 7. Comparison of H i Properties to Those Derived from Single-dish Data
| Galaxy |
 a
a
|
 b
b
|
 c
c
|

|
 d
d
|
 e
e
|

|
 f
f
|
 g
g
|
|---|---|---|---|---|---|---|---|---|---|
( ) ) |
( ) ) |
(kpc) | (kpc) | ( ) ) |
( ) ) |
( ) ) |
|||
| SDSS 0119+1452 | 115 | 31 ± 16 | 11.2 | 6.0 ± 0.1 | 3.3 | 0.13 ± 0.14 | 4.1 ± 0.5 | 0.06 | 0.63 ± 0.69 |
| SDSS 0125+0110 | ⋯ | 117 ± 86 | ⋯ | 20.9 ± 0.2 | ⋯ | 6.7 ± 9.8 | 4.5 ± 0.4 | ⋯ | 0.08 ± 0.12 |
| SDSS 0728+3532h | 160 | 110 ± 44 | 10.8 | 14.2 ± 0.2 | 6.7 | 4.0 ± 3.2 | 4.4 ± 0.3 | 0.09 | 0.19 ± 0.15 |
| SDSS 0934+0014 | 189 | 57 ± 18 | 13.6 | 6.1 ± 0.7 | 10.8 | 0.47 ± 0.29 | 15.5 ± 0.9 | 0.05 | 0.53 ± 0.35 |
| SDSS 0936+0106 | 146 | 140 ± 41 | 14.2 | 15.0 ± 0.2 | 6.3 | 6.9 ± 4.0 | 7.9 ± 0.7 | 0.06 | 0.034 ± 0.021 |
| SDSS 1319+5203h | 120 | 30 ± 26 | 10.6 | 15.8 ± 0.4 | 4.0 | 0.33 ± 0.56 | 2.8 ± 0.3 | 0.2 | 3.5 ± 6.0 |
| SDSS 1402+0955 | 186 | 148 ± 29 | 17.4 | 10.5 ± 0.2 | 15.0 | 5.3 ± 2.1 | 11.6 ± 0.6 | 0.04 | 0.080 ± 0.036 |
| SDSS 1507+5511 | 72 | 99 ± 22 | 15.8 | 12.1 ± 0.3 | 2.0 | 2.8 ± 1.2 | 4.2 ± 0.3 | 0.1 | 0.072 ± 0.033 |
| Mrk 325 | 121 | 54 ± 49 | 19.2 | 5.4 ± 0.2 | 6.3 | 0.37 ± 0.66 | 10.8 ± 0.3 | 0.1 | 0.47 ± 0.84 |
Notes.
a is calculated using half of W20, which is corrected for inclination and random motions and taken from Table 3 of Garland et al. (2004).
b
is calculated using half of W20, which is corrected for inclination and random motions and taken from Table 3 of Garland et al. (2004).
b
 is measured using a cut along the major axis and is taken from Table 5 and corrected for inclination.
c
is measured using a cut along the major axis and is taken from Table 5 and corrected for inclination.
c
 is estimated to be 2 × R25 and is taken from Garland et al. (2004).
d
is estimated to be 2 × R25 and is taken from Garland et al. (2004).
d
 is calculated using the
  and
and  values in Tables 3 and 4 of Garland et al. (2004).
e
values in Tables 3 and 4 of Garland et al. (2004).
e
 is calculated using
  and
and  and is taken from Table 5.
f
and is taken from Table 5.
f
 .
g
.
g
 .
hSDSS 0728+3532 and SDSS 1319+5203 lie within H i envelopes that include other galaxies. Their H i masses include the entire envelope, while their rotation velocities and dynamical masses calculated from a cut along their major axes include only the LCBGs.
.
hSDSS 0728+3532 and SDSS 1319+5203 lie within H i envelopes that include other galaxies. Their H i masses include the entire envelope, while their rotation velocities and dynamical masses calculated from a cut along their major axes include only the LCBGs.
Download table as: ASCIITypeset image
When calculating  , Garland et al. (2004) estimated that
  , following Broeils & van Woerden (1994), since they did not have measured values of
  . We compare the estimated and measured values of
  in Table 7. The
  values that we measure are on average 81% of those used in Garland et al. (2004), though the scatter is relatively large (
 ). SDSS 0728+3532, SDSS 0936+0106, and SDSS 1319+5203 have measured
  values that are larger than those that Garland et al. (2004) estimated. We use our measured
  to calculate
  here.
here.
With the exception of SDSS 0936+0106 and SDSS 1507+5511, the  within the estimated
  calculated by Garland et al. (2004) are larger than those that we calculate here, owing to the larger
  and
and  values estimated using single-dish observations. On average, the single-dish
  values are 10.5 times larger than
  measured along the galaxies' major axes, with a large scatter (
 ).
).
The H i mass fractions,  , that we calculate using our resolved observations are on average nine times larger than those calculated from single-dish measurements, though with an equivalent standard deviation (
 . Only SDSS 0936+0106 and SDSS 1507+5511 have smaller
  when using resolved data than the
  values derived from single-dish observations. For two of the LCBGs, SDSS 0728+3532 and SDSS 1319+5203, the
  values that we calculate encompass the entire, multi-galaxy H i envelopes in which these galaxies reside, while
  only encompasses the LCBGs. As a result, the
  that we calculated are likely much higher than the true values (e.g., the
  values of SDSS 1319+5203 is 3.5, which is unphysically high).
The major advantages that our current study has over those undertaken with single dishes are that (1) our improved spatial resolution enables us to distinguish individual galaxies from their nearby companions, (2) mapping the galaxies allows for their rotation axes to be identified and their  to be measured rather than estimated from linewidths, and (3) mapping the galaxies also makes measuring their
  possible, enabling calculations of their
  to be made with fewer assumptions. We generally calculate lower
  and higher
  than what was calculated from single-dish measurements by Garland et al. (2004). This result strengthens their assertion that LCBGs are gas-rich galaxies with smaller
  than elliptical galaxies.
From comparing the H i properties of the LCBGs in our sample to those measured with a single dish, we find that the  ,
,  , and
, and  that we measure are not related by a simple scale factor to those estimated using single-dish linewidths and R25. See Figure 11 for a visual representation of the scatter in the H i properties that we measure when compared to those reported by Garland et al. (2004). We note that our sample size is small, so we cannot rule out a characteristic relationship between R25 and
  or between single-dish linewidths and
  in LCBGs, though we do not find such a relationship here.
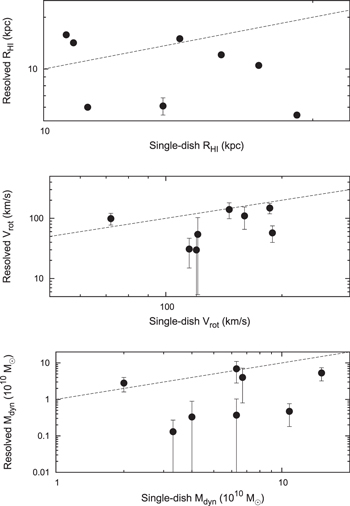
Figure 11.
 (top),
  (middle), and
  (bottom) using data from Garland et al. (2004) and our measurements for the LCBGs common to both samples. Garland et al. (2004) estimated
  to be
to be  , and used half of the width of each galaxy's single-dish H i spectrum corrected for inclination and random motions as
  . The dashed black lines show a 1:1 relationship between the two data sets. In some cases, error bars are smaller than point sizes.
Download figure:
Standard image High-resolution image4.2.1. Comparison with Stellar Masses
As a constraint on the  that we have calculated, we have also calculated stellar masses, M*, for each LCBG using the equation
  given in Bell & de Jong (2001), where
  and
and  are constants dependent on the wavelength of measured luminosity and are tabulated in Table 1 of Bell & de Jong (2001). We used the
  colors that we listed in Table 1, and K-band magnitudes from the Two Micron All Sky Survey (2MASS) catalog (Skrutskie et al. 2006). We note that three LCBGs, SDSS 0119+1452, SDSS 0934+0014, and Mrk 325, had
  values lower than their stellar masses. Bell & de Jong (2001) state that the scatter on their color–
 relation is
  , which is smaller than the difference between the
  and
and  values for these galaxies, so it is not likely that uncertainties on the color–
 relation are responsible for this unphysical result. There are two possible reasons for these galaxies having larger
  than
than  . First, if a galaxy's H i is more face-on than its optical emission, then we have likely underestimated its
  due to under-correcting its rotation velocity for inclination. Since these three galaxies were the most difficult to identify axes of rotation for, it is likely that the uncertainty in their rotation velocities is higher than for the other LCBGs. Second, the equation used to calculate
  is a relationship between
  and galaxy colors determined by a model for several combinations of colors and optical and near-infrared absolute magnitudes. As was shown in Garland et al. (2004), LCBGs are more likely to have lower
  than average for local galaxies, and Bell & de Jong (2001) find that bluer colors correlate with lower
  . If LCBGs significantly deviate from the color–
 relationship that Bell & de Jong (2001) have derived (e.g., if the
  that we use in our calculations is redder than the average
  for a galaxy's disk), we may be overestimating their stellar masses.
4.3. Tully–Fisher Relation
The Tully–Fisher (T–F) relation (Tully & Fisher 1977) posits that for rotating galaxies, intrinsic luminosity is proportional to the galaxy's  raised to the fourth power. Garland et al. (2004) showed that not all of the LCBGs in their sample follow the T–F relation when they estimated
  using single-dish linewidths. It would be expected that a galaxy with active star formation could have a temporarily elevated B-band intrinsic brightness relative to the expected brightness from the T–F relation, given its
  . Garland et al. (2004) did see some evidence of that effect in their sample. In addition, they also found that some LCBGs are less intrinsically bright in the B band than their
  would suggest, which would not be expected for star-forming galaxies. Since a galaxy undergoing active star formation becomes fainter in the B band once its star-forming episode ends, an LCBG that is fainter than would be expected for a galaxy on the T–F relation would never become bright enough to evolve onto the T–F relation. However, if a galaxy's
  is overestimated by its single-dish linewidth, the galaxy could appear to be too faint to follow the T–F relation given its (overestimated)
  . This scenario could happen if, for example, an unresolved nearby companion or tidal feature exists whose recession velocity overlaps with the rotation velocity range of the target galaxy. Garland et al. (2004) found that six of the ten LCBGs in their sample that are too faint to follow the T–F relation have companions. Since our resolved observations enable us to measure the
  values of the LCBGs in our sample, we revisit whether LCBGs follow the T–F relation using our velocity measurements.
We have plotted the LCBGs in our sample in Figure 12 along a version of the T–F relation described in Tully & Pierce (2000). In this plot, we use  as measured along the galaxies' major axes and corrected for optical inclination, as well as their
  listed in Table 1. We also plotted the corresponding linewidths and
  calculated for those LCBGs in Garland et al. (2004). Five of the nine LCBGs in our sample appear to follow the T–F relation (within error bars), while four LCBGs are brighter than anticipated, given their
  . Three of these four LCBGs have
  , as discussed in Section 4.2.1. None of the LCBGs in our sample have lower than expected luminosities, given their
  values, while six of the LCBGs have low luminosities with respect to rotation velocities inferred from their linewidths as measured in Garland et al. (2004). Since the average
  derived from half of the galaxies' single-dish linewidths is nearly three times the
  values that we measure, we can infer that the cause of some LCBGs lying to the right of the T–F relation in single-dish measurements is likely due to uncertainties in estimating
  from single-dish linewidths.
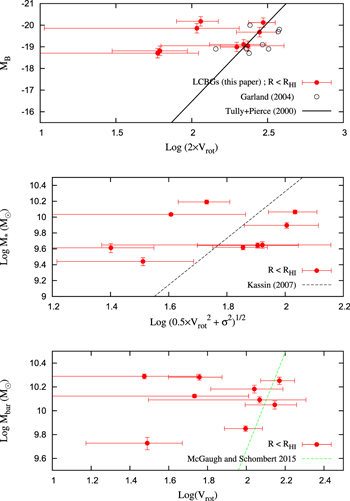
Figure 12. Top: A version of the Tully–Fisher relation, described in Tully & Pierce (2000).  for the LCBGs in our sample (filled circles) are calculated as described in Garland et al. (2004) using SDSS g and r magnitudes and distances taken from Table 1. Their
  values are taken from cuts across the galaxies' major axes at
  and corrected for inclination. The same LCBGs (with the exception of SDSS 0125+0110) are plotted with
  and linewidths corrected for random motions and inclinations taken from Tables 1 and 3 of Garland et al. (2004; open circles). The Tully–Fisher relation as described in Tully & Pierce (2000) is plotted with the black line. Four of the LCBGs in our sample are much brighter in the B band than their
  values would suggest, while six of the LCBGs in the Garland et al. (2004) sample are faint in the B band with respect to their linewidths. We find that the LCBGs in our sample either follow the Tully–Fisher relation or have the ability to evolve onto it once their star formation is quenched and their
  subsequently fade. We interpret the galaxies lying to the right of the Tully–Fisher relation from the Garland et al. (2004) sample as having overestimated rotation velocities due to the inclusion of non-rotation H i features or companion galaxies in the beam. Middle: Stellar mass Tully–Fisher relation as described in Kassin et al. (2007).
  are calculated using K-band magnitudes and B − V colors.
  values are calculated the same way as in the top figure. σ values are the average σ within
  . The same LCBGs that lie to the left of the T–F relation on the top plot also lie to the left of the stellar mass T–F relation. Bottom: Baryonic Tully–Fisher relation as described in McGaugh & Schombert (2015).
  is the sum of the stellar mass and gas mass for each galaxy. When calculating the gas mass, we assumed a 10% contribution from
  .
.  values are calculated the same way as in the top and middle figures.
Download figure:
Standard image High-resolution imageIn addition to a temporarily elevated luminosity due to ongoing star formation, one potential cause of some LCBGs being positioned to the left of the T–F relation could be disturbed H i velocity fields due to mergers or interactions. Eight of the nine LCBGs in our sample have nearby companions or show signs of disturbed gas morphology, though their optical morphologies remain disk-like. If a galaxy's  is not accurately measured by taking a cut along its major axis and correcting for inclination (but is instead underestimated), the galaxy could appear to be too luminous for its measured
  . We also note that, as we discussed in Section 3.2, our measured
  values include a correction for optical inclination that could introduce a systematic error into the reported
  values. Since the four LCBGs that lie to the left of the T–F relation also have
  , it is likely that we are underestimating their dynamical masses, and thus also underestimating their
  .
.
Another possible cause of deviation from the T–F relation, which does not exclude a merger scenario, could be due to the formation of a bulge or pseudobulge (Tonini et al. 2014). If LCBGs are undergoing their final major burst of star formation while they build a bulge and transition to more quiescent S0 or dE-type galaxies, we may be able to see evidence of this transformation in their H i properties. Earlier-type spiral galaxies have higher mass-to-light ratios than later-type spirals, so their T–F relations tend to be flatter than the average T–F relation for spiral galaxies (Tonini et al. 2014). None of the LCBGs in our sample appear to have higher mass to light ratios than the T–F relation would suggest (see Figure 12), so we do not see evidence that the LCBGs in our sample have prominent bulges like Sa-type galaxies.
As the LCBGs in our sample either follow the T–F relation or have the potential to evolve onto it once their blue luminosities fade due to decreased star formation activity, we can infer that the LCBGs in our sample are likely to be rotation-supported. An additional consideration to include in our analysis is the effect of velocity dispersion on the galaxies' rotation velocities. Since we measured the LCBGs' rotation velocities at the edges of the extent of the galaxies' H i, where their velocity dispersions are relatively low (see the Moment 2 maps in Figures 1–9), the effects of velocity dispersions on the galaxies' rotation velocities that we have measured are not likely to be significant. It is possible that the rotation velocities measured by Garland et al. (2004) from single-dish linewidths could be affected by the inclusion of velocity dispersion. Garland et al. (2004) addressed this effect by incorporating a correction for velocity dispersion in their reported linewidths, with the assumption that the random motions of the gas contributed  to the measured single-dish linewidth. If this correction was insufficient, the additional contribution from velocity dispersion would increase the measured linewidth relative to what would be measured due to pure rotation. This increase could contribute to the data points in Figure 12 from Garland et al. (2004) that lie to the right of the T–F relation, where it is impossible to evolve onto the T–F relation solely due to quenching of star formation.
To investigate whether the four LCBGs that lie to the left of the T–F relation have kinematics that are not dominated by rotation, we plotted the LCBGs in our sample along the stellar mass T–F relation described by Kassin et al. (2007). This relationship correlates  with the kinematic property
  , which is defined as
  (Weiner et al. 2006; Kassin et al. 2007). Since we calculated
  using near-infrared magnitudes, which are not as sensitive to recent star formation as B-band magnitudes, the LCBGs that lie to the left of the T–F relation may lie closer to the stellar mass T–F relation if recent star formation is significantly elevating the B-band magnitudes in these galaxies. In Figure 12, we find that the same four LCBGs that lie to the left of the T–F relation also lie to the left of the stellar mass T–F relation when we measure
  and σ at
  , and three of those four LCBGs (SDSS 1319+5203 is the exception) lie to the left of the stellar mass T–F relation at R25. In addition, the five LCBGs that follow the T–F relation lie to the right of the stellar mass T–F relation.
Finally, we also plotted the baryonic T–F relation as described in McGaugh & Schombert (2015) in the bottom panel of Figure 12 to investigate whether combining the LCBGs' gas masses and stellar masses produced a different result when plotted against their  . The result was the same as for the other two versions of the T–F relation: the same four galaxies lie to the left of the baryonic T–F relation.
Since including both ordered rotation and disordered motions in  , and both gas and stellar masses in the baryonic T–F relation, did not move the four LCBGs to the left of the T–F relation onto the stellar mass or baryonic mass T–F relations, it is not likely to be the case that these four LCBGs are dominated by disordered motions at large radii or have unusually large stellar masses. It is instead likely that we are underestimating their dynamical masses. It is also possible that these galaxies have recently undergone a merger or interaction that has disturbed their kinematics, making their rotation more difficult to measure and causing lower measured
  and
and  than would be measured for more settled disks. We discuss this possibility further in Section 4.5.
4.4. Disk and Bulge Kinematics
One way we can further infer whether LCBGs contain significant bulges is to compare their ratios of ordered to disordered motion to their ellipticity,  . Using virial theorem arguments,
  can be related to by

where  (Sparke & Gallagher 2007). We plot this relation, which indicates the maximum ratio of ordered motions to random motions allowable for a given flatness of elliptical galaxies, in Figure 13. When measured within R25, all of the LCBGs in our sample lie above this relation, along with spiral galaxies and late-type dwarf galaxies from the THINGS sample (Walter et al. 2008) and disk-like star-forming galaxies at higher redshifts (Cresci et al. 2009), which shows that they rotate faster (or have smaller values of σ) than is permitted for elliptical galaxies. By contrast, all of the dwarf elliptical galaxies with a significant rotation component studied by Geha et al. (2003), and most of the dwarf ellipticals studied by van Zee et al. (2004), lie below this relation. When we measured
  at
at  and the average σ within
  , the
, the  values of the galaxies in our sample lie near the relation, which implies that the gas in the central portion of LCBGs has approximately the maximum
  possible for elliptical galaxies. While the stellar kinematics of LCBGs may not be identical to the gas kinematics at this radius, we expect both the stars and the gas to trace a similar potential so close to the galaxies' centers since their optical emission is centrally concentrated, and the maximum intensities of their H i emission are within a beamwidth of their peak optical emission (e.g., Noordermeer et al. 2007; Serra et al. 2016). Bershady et al. (2005) show that a sample of very blue (
 ), very compact (SBe(B) ∼19
  ) intermediate-redshift LCBGs lie below the relation (see their Figure 2), which suggested to them that LCBGs may evolve into dwarf elliptical galaxies once their star formation has been quenched. That study differs from ours in that it surveyed an extreme subset of intermediate-redshift LCBGs and measured ionized gas rather than H i. Pérez-Gallego et al. (2011) measured
  for ionized gas using optical emission lines for a sample of local LCBGs that has two galaxies in common with our sample (SDSS 1507+5511 and Mrk 325). When compared with the ellipticities of those galaxies, the LCBGs in their sample behave in a way that is similar to the LCBGs in our sample measured at
  . The
. The  values that we have measured make the presence of large-scale classical bulges that contain gas unlikely at present in LCBGs, though the gas in the innermost regions of LCBGs may display bulge-like behavior. This suggests that if the local LCBGs in our sample are representative of the population of LCBGs that is common at
  , those higher-redshift LCBGs must also be dominated by ordered rotation. If this was the case, then LCBGs at higher redshifts are likely disk galaxies with extensive star formation in their disks, rather than irregular or spheroidal galaxies.
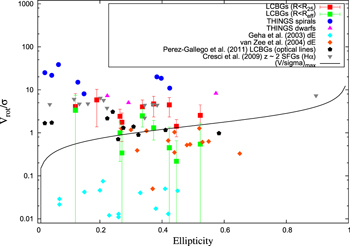
Figure 13.
 plotted against ellipticity (
 ) for a variety of galaxy samples. The solid black curve is the maximum value of
  allowed for elliptical galaxies. Galaxies above this curve are too rotation-supported to be classified as elliptical galaxies. The square points represent the LCBGs in our sample measured within R25 (red squares) and
  (green filled squares for galaxies with
  smaller than the beam size, and green open squares for galaxies with
  larger than the beam size). The velocity dispersions within
  have been corrected for beam smearing. Archival data, including spiral galaxies from the THINGS sample (filled circles), dwarf galaxies from the THINGS sample (filled triangles), dwarf elliptical galaxies with a measured rotation component from Geha et al. (2003; filled diamonds) and van Zee et al. (2004; open diamonds), compact star-forming galaxies with disk components at
  from Cresci et al. (2009), and LCBGs in the Pérez-Gallego et al. (2011) sample (filled stars), are also plotted. values for the nine LCBGs in our sample are calculated using the same SDSS i band axis ratios that we used to calculate the galaxies' inclinations. The error bars on calculated this way are smaller than the point sizes. values for the previously published samples are taken from Hyperleda, except for the Geha et al. (2003) sample, where is taken from Table 3 of that paper, the van Zee et al. (2004) sample, where is taken from Table 1 of that paper, and the Cresci et al. (2009) sample, where is calculated from the inclinations listed in Table 2 of that paper. LCBG
  values are measured using a cut along the galaxies' major axes. THINGS (Tamburro et al. 2009) σ values are the average H i σ values measured within
  . THINGS
  values are taken using half of W20 corrected for inclination from Walter et al. (2008). Geha et al. (2003) dwarf elliptical
  and σ values are measured from optical absorption lines within 0.5–1
  . van Zee et al. (2004) dwarf elliptical
  and σ values are measured from optical absorption lines within the last point where a rotation curve could be fit. Cresci et al. (2009)
  and σ values are measured from
  emission lines within a "scale radius" fit from a Gaussian profile along the major axis of the galaxies' intensity maps. Pérez-Gallego et al. (2011)
  values are measured from rotation curves fit to Hα velocity maps, and σ values are measured from [O iii]λ5007 maps.
Download figure:
Standard image High-resolution image4.4.1. Disk Instabilities and Central Bulges
Some studies have hypothesized that LCBGs are bright, star-forming bulges (or bulge progenitors) of disk galaxies (Barton & van Zee 2001; Hammer et al. 2001). This scenario is consistent with the centrally peaked σ values and relatively low central  values that we find for many of the LCBGs in our sample. The motion of the gas at large radii in the galaxies in our sample is dominated by rotation (
 ), even within R25, and even for the LCBGs with disturbed velocity fields, so we rule out the existence of gas-rich "classical" bulges in our sample. Even so, it is possible that the LCBGs in our sample have or are developing central bars or "pseudobulges" (Kormendy & Kennicutt 2004), which are less supported by random motions than they are by rotation.
One mechanism for developing a central bulge in star-forming galaxies is the "clump-origin bulge" (e.g., Noguchi 1998, 1999, 2000, 2001; Dekel et al. 2009; Elmegreen et al. 2009; Inoue & Saitoh 2012). In this scenario, gas infalling onto a galaxy's disk develops overdensities within the disk that contract and become star-forming clumps. As the clumps orbit along with the rest of the disk, they move toward the center of the galaxy due to dynamical friction and can merge with other clumps. When these clumps merge with each other, star formation rates in the clumps increase briefly, which gives the clumps a bright, blue appearance and drives up the galaxies' global star formation rates. Finally, the few large clumps that remain merge in the center of the galaxy, causing either a small clump-origin nuclear bulge or bar that maintains some of the the angular momentum that the clumps had in the disk. At this point, the star formation rate of the clumps rapidly declines (for a visual illustration of this process, see Figure 1 of Inoue & Saitoh 2012). The lifetimes of the clumps are governed by their size (more massive clumps are less likely to disperse due to outward pressure from their star formation), as well as their distance from the center of the galaxy (clumps that have less distance to travel as they move toward the center are more likely to reach the center of the galaxy intact). Clumpy galaxies have been observed at a range of redshifts, including galaxies that resemble LCBGs. For example, Overzier et al. (2009) found that star-forming clumps, including large, bright central clumps, are common in a sample of Lyman Break Analog galaxies at  that have similar effective radii and dynamical masses to the LCBGs in our sample. Garland et al. (2015) found that 40% of local LCBGs are clumpy, likely due to the buildup of accreted gas from interactions with companions or material in galaxy clusters.
To determine whether conditions in the LCBGs' disks are conducive to the formation of clumps, we can use the gas properties we measure to calculate the galaxies' Toomre parameters (Toomre 1964) for the stability of their disks' gas,

where  for a flat rotation curve, and
  is the gas mass surface density. For a disk to be stable,
  . More accurate measures of Q incorporate the disks' stellar components as well (Dekel et al. 2009), though we limit our present analysis to the LCBGs' H i since we are probing the galaxies' kinematics beyond the extent of their stellar disks, and are particularly interested in whether the kinematics of their gas are conducive to star formation. In general, incorporating a stellar component will increase a galaxy's value of Q.
Keeping in mind that a galaxy's total mass is represented by  , we can solve for
  in the
  equation and solve for
  in Equation (5) with
  , and divide the two relationships following Dekel et al. (2009) to highlight the criterion for disk stability in terms of gas properties we can measure:

or

In this relationship,  is the galaxy's total mass surface density, which is calculated using its
  within a given radius (
 ). We note that for this discussion, we make the approximation that
  where
where  is either the published value for each galaxy if it exists (these are stated in the Appendix), or 10% of
  if no published
  exists for the galaxy.
  is measured within
  . Garland et al. (2005) found that LCBGs' molecular gas mass is typically
  of their
  (assuming a Galactic X factor), so contributions to
  from molecular gas are likely to be small for the galaxies in our sample that do not have published values of
  .
.
We plot the measured values at several radii for each of the LCBGs in our sample in Figure 14. This plot excludes SDSS 0728+3532 and SDSS 1319+5253B, which are contained within a larger H i envelope. For these two sources,  contains multiple galaxies, whereas
  only reflects the mass of the target galaxy. All of the LCBGs in our sample except Mrk 325 have stable gas disks with respect to perturbations over a range of radii (for
  , data points would lie above the curve in Figure 14, and for
  , data points lie below the curve), which means that their
  would need to be higher for their disks to be unstable, given their present values of
  . Since the error bars on
  and
and  are large, we cannot rule out the potential to form local instabilities at at least one radius for any of the LCBGs. We note that we assume that
  is constant at all radii, which is unlikely to be the case given that the LCBGs' H i emission is more intense in their centers than at their edges. This effect would result in a greater likelihood of disk instabilities at smaller radii than what we plot in Figure 14 (lower-radii data points will move to the left in Figure 14 if
  increases with decreasing radius).
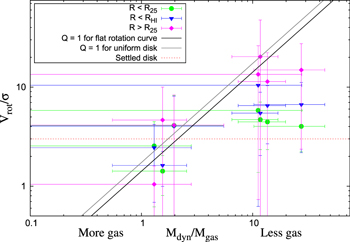
Figure 14.
 within R25 (green circles),
  (blue triangles), and outside of R25 (purple diamonds) for the LCBGs in our sample that do not share a common H i envelope with another galaxy. The solid black line is the Toomre criterion for disk instability for a gas disk with a flat rotation curve, and the solid gray line is the Toomre instability criterion for a uniform disk (Toomre 1964). Above the line, galaxies' disks can develop local instabilities. Below the line, turbulence prevents gas clumps from forming. The LCBGs in our sample have H i disks that are consistent with being stable on average, though many of them have large enough error bars on
  and
and  that we cannot rule out gravitational instabilities. The horizontal dotted red line is the Kassin et al. (2012) criterion for disk settling. Above the line (
 ), galaxies' disks are considered to be settled.
Download figure:
Standard image High-resolution imageIn a study modeling gas infall onto galaxies, Dekel et al. (2009) found that if the cold gas streams that are feeding infall onto the disk are clumpy, the clumps more easily merge toward the center of the galaxy and form a spheroid shape, keeping the disk's average  . In this scenario, the disk is usually stable. They found that conversely, if the streams are smooth, the disk can support clumps for a longer period of time. Noguchi (2000) found that requiring the local gas density to rise above a certain threshold before star-forming clumps could form yielded simulations consistent with observations of early- and late-type disks, and that for smaller galaxies, clumps may not be able to form at all, and instead the infalling gas is fed into the center of the galaxy to form a bar. To estimate the likelihood of these scenarios, we can compare the
  values that we measure for the LCBGs in our sample to the clump masses that have been observed and modeled in other studies. Elmegreen et al. (2009) found that for spiral galaxies, each clump contains an average of
  of its galaxy's stellar mass, while for clump cluster galaxies (galaxies dominated by several bright clumps), each clump contains about 2% of the galaxy's stellar mass. If we make the assumption that these ratios are also approximately valid for
  , we can multiply these percentages by the average
  of the LCBGs in our sample to find the expected clump masses. On average, a clump would contain about
  of H i in a spiral LCBG, or about
  of H i in a clump cluster LCBG, given these ratios. Noguchi (2000) found that in simulations, clumps were more likely to survive migration toward the galaxies' centers in galaxies with clumps larger than
  , while in galaxies with smaller clumps, the clumps were more likely to be disrupted and instead form a short bar from their gas.
To determine whether any star-forming clumps due to gravitational instabilities in LCBGs are detectable over long timescales, we calculated the inspiral time for clumps,  , where
  (see, e.g., Dekel et al. 2009; Genzel et al. 2014) using
  measured at
  and the average σ measured within
  for each LCBG. For the LCBGs in our sample,
  is longer than 1 Gyr (approximately the lifetime of a
  , or late-B to early A-type star; Harmanec 1988; Maeder & Meynet 1989; Romano et al. 2005) for all but two LCBGs. This implies that if clumps can form in LCBGs, they can persist for several Gyr before they finally sink to LCBGs' centers if they are not disrupted. When compared with less compact and less dynamically hot disk galaxies, however, the expected
  for LCBGs is relatively short. Since disk galaxies tend to have higher values of
  at lower redshifts than at higher redshifts (Kassin et al. 2012), the appearances of clumpy galaxies at
  may evolve more rapidly than most disk galaxies with star-forming clumps in the local universe due to their lower
  . Thus, since local LCBGs have relatively high values of
  and compact
  , their
  are likely more comparable to those of LCBGs at higher redshifts.
Though we do not have the sensitivity in our current study to measure the masses of gas clumps, nor the resolution to measure local overdensities in the LCBGs in our sample, future studies at higher resolutions may be able to identify density variations in LCBGs' disks and determine the likely course of future evolution of the galaxies' clumps. As both low-redshift LCBGs and their high-redshift analogs are often clumpy, further understanding of this phenomenon will be useful in predicting these galaxies' evolutionary paths. Future resolved observations of LCBGs will help better measure local velocity dispersions and disk inclinations, which will better constrain inspiral times for clumps in their disks. In addition, resolving individual clumps and measuring their properties will determine whether feedback within the clumps due to radiation pressure will disperse the clumps on shorter timescales than  .
.
4.5. Comparison with Higher-redshift Galaxies
Förster Schreiber et al. (2009) measured  velocity maps for a sample of
  star-forming galaxies from the Spectroscopic Imaging survey in the Near-Infrared with SINFONI (SINS) survey. Most of the galaxies in their sample had clumpy
  morphologies. They found that the galaxies in their sample fell into three groups based on their kinematics, with approximately a third of their sample falling into each category: rotation-dominated disks, compact dispersion-dominated galaxies, and merging systems. The H i velocity fields of the LCBGs in our sample resemble the
  velocity fields of the rotation-supported galaxies in their sample, as shown in Figure 17 of Förster Schreiber et al. (2009). The LCBGs in our sample do not appear to be similar to star-forming galaxies supported by disordered motions; the dispersion-dominated galaxies in the Förster Schreiber et al. (2009) sample do not show a clear axis of rotation, while even the least rotationally supported LCBGs in our sample show a clear velocity gradient.
Genzel et al. (2014) found that for a sample of 19 rotationally supported, star-forming disk galaxies from the SINS survey with smooth velocity gradients and centrally peaked velocity dispersions at  , Q is also centrally peaked. We can see from Equation (5) and Figure 14 that this is true for the LCBGs in our sample as well. The solid line in Figure 14 represents Q = 1, with values of Q increasing to the bottom right. We see that for the LCBGs in our sample, the measurements at smaller radii tend to have larger values of Q than at larger radii. As mentioned in Section 4.4.1, we assume in Figure 14 that
  is constant at all radii, which is unlikely to be true since the H i emission in the LCBGs in our sample decreases in intensity at larger radii. If
  increases with decreasing radius in the LCBGs in our sample, then Q will not be as centrally peaked, as is implied by Figure 14. Genzel et al. (2014) argue that increased values of Q in the centers of galaxies could lead to the formation of a central bulge and the quenching of star formation where
  . While our measurements of rotation velocities, velocity dispersions, and gas masses suggest that a similar central bulge is possible in the LCBGs in our sample, higher-resolution measurements of H i are needed for these galaxies to more conclusively identify central bulges that could lead to the quenching of star formation in LCBGs.
Kassin et al. (2012) measured the gas kinematics in blue star-forming galaxies from  to
to  and found that the average
  tends to increase with decreasing redshift. They interpret this trend as the result of the galaxies' disks settling over time due to fewer mergers and decreased gas fractions due to gas depletion from past star formation. They defined a settled disk as having
  . In Figure 14, we see that the three galaxies with
  at
at  also have the highest gas fractions. While this relationship could be due to underestimating these galaxies'
  due to inclination uncertainties, it is also notable that these three galaxies have the least-ordered velocity contours of the galaxies in our sample that are not in larger H i envelopes. These galaxies' disks may be in the process of settling, while the remaining four galaxies' disks, in addition to being stable on large scales relative to gravitational instabilities, may have already settled.
Recently, Crawford et al. (2016) observed LCBGs in intermediate-redshift clusters. They had previously found that cluster LCBGs at that redshift are likely experiencing their first pass through a cluster, and will likely have their gas stripped and star formation quenched once they pass through the cluster (Crawford et al. 2011, 2014). In their most recent study, Crawford et al. (2016) find that the LCBGs in their sample have sizes, masses, and metallicities that are consistent with dwarf elliptical galaxies. Because of this, they conclude that intermediate-redshift cluster LCBGs are likely to rapidly evolve into dE galaxies with quenched star formation once they pass through the cluster potential and have their gas stripped. Our results show that the local LCBGs that we have observed are unlikely to passively evolve into dE galaxies, since they have significant disk components. However, we note that the LCBGs in our sample, unlike those studied by Crawford et al. (2016), are not members of massive clusters. It is possible that the evolutionary paths of cluster and non-cluster LCBGs are strongly influenced by their environments (Garland et al. 2015 found that this is likely to be true for  LCBGs), and thus their future morphologies may diverge.
5. Conclusions
In this study, we have measured the H i properties of nine LCBGs from resolved maps of H i emission. We conclude that
- 1.The LCBGs in our sample are rotating disk galaxies with H I intensities and velocity dispersions that decrease with increasing radii.
- 2.The H i linewidths measured for these galaxies by single dishes tend to overestimate their rotation velocities, likely due to the inclusion of companions or tidal features in the beam.
- 3.The LCBGs in our sample have H i
 values that are consistent with the gas kinematics of disk galaxies when measured at and , though some LCBGs have H i within that are consistent with bulge-like behavior.
 - 4.The disks of the LCBGs in our sample are stable on average with respect to local perturbations, though they have the potential to form local instabilities at large radii, and three LCBGs' disks have values at consistent with disks that have not yet settled.


We have found that the LCBGs exhibit a variety of gas morphologies, from regular, symmetric rotation to asymmetric, disturbed rotation to multiple galaxies in a common H i envelope. All of the LCBGs in our sample appear to be dominated by rotation at large radii ( ), and have significant rotation components at smaller radii. Because we were unable to robustly fit rotation curves to the LCBGs, we do not have enough information to comment extensively on the shapes of LCBGs' rotation curves (or their mass distributions), though we have been able to produce position–velocity plots from cuts along their major axes that display the shapes of their velocity profiles. The LCBGs in our sample tend to have asymmetric velocity profiles, which supports a scenario where LCBGs' star formation is the result of gas disturbance. We cannot conclusively distinguish whether this disturbance is externally or internally triggered, but the presence of companions near most of the LCBGs in our sample are not inconsistent with external mechanisms. Even so, even the most disturbed LCBGs have identifiable H i rotation axes.
When compared to previous single-dish results (Garland et al. 2004), we measure lower values of  for all of the LCBGs in our sample except for SDSS 1507+5511. Six of the nine LCBGs have smaller measured
  values than what was estimated for them using
  . (Two of the exceptions, SDSS 0728+3532 and SDSS 1319+5203, have H i envelopes that include other galaxies, while the other exception, SDSS 0936+0106, has a measured
  that is only 6% larger than its estimated
  .) These discrepancies tend to result in smaller values of
  , and larger values of
  , for LCBGs than those calculated from single-dish measurements.
Though most of them have disturbed kinematics, the LCBGs in our sample do not appear to be exclusively the result of ongoing major mergers. While seven (78%) of them have companions at comparable systemic velocities, only two (22%) of them have other galaxies within their H i envelopes. This implies that the star formation in LCBGs is not required to be solely triggered by a major merger event. Instead, some LCBGs' star formation may be the result of intrinsic bulge-building, which could be enhanced by interactions or minor mergers but does not require interactions to proceed. (We note, for example, that for the two LCBGs, SDSS 0728+3532 and SDSS 1319+5203, that are in three-galaxy interacting systems, only one of the galaxies in each system is an LCBG.)
We found that the LCBGs in our sample either already follow the T–F relation or have the potential to evolve onto it once their current elevated star formation, and thus B-band luminosities, fade. While the  values of the LCBGs' H i look like stellar
  of dwarf elliptical galaxies at the smallest radii (
 ), they resemble other types of spiral galaxies more closely at
  . From this, we infer that the LCBGs in our sample are likely not dispersion-dominated bulges, and that they will not likely be able to passively evolve into dwarf ellipticals once their star formation is quenched. However, some of the LCBGs in our sample may be building small central bulges, as three of the galaxies have
  values at large radii (
 ) that are above the threshold of disk instability necessary for infalling gas to create star-forming clumps that may later merge to form a nucleus or bar. (We note that since we used inclinations calculated from optical SDSS i band axis ratios to calculate
  , there are large uncertainties in the values of
  that we report.)
The variety of optical and H i morphologies, environments, and kinematics of the LCBGs in our sample lends support to the picture of LCBGs being a heterogeneous class of galaxies undergoing a common, short-lived evolutionary phase in their star formation histories. Since the LCBGs in our sample do not have common H i properties, we cannot predict a single future scenario for their evolution based on their gas morphologies. This is not surprising, as the relative abundance of LCBGs at  would suggest that, if LCBGs follow a single common evolutionary path, their end products would be similarly common in the local universe.
Since LCBGs appear to have such a variety of gas morphologies, future studies of their gas properties focusing on high-resolution mapping to further probe their internal dynamics, including the presence of star-forming gas clumps, bars, or bulges related to local gravitational instabilities, will better illustrate whether they have any common intrinsic star formation triggers. Such mapping would provide data useful for modeling LCBGs' gas evolution to predict their timescales for future quenching of their star formation. We are currently studying star formation tracers in a larger local sample of LCBGs to calculate their current star formation properties. This information, coupled with LCBGs'  values, will help us understand whether LCBGs' gas depletion timescales, given their current star formation rates, are shorter than their expected timescales for star formation quenching. This will provide better understanding for the evolutionary paths of this formerly common, currently rare, class of galaxies.
We thank the staff of the GMRT who have made these observations possible. GMRT is run by the National Centre for Radio Astrophysics of the Tata Institute of Fundamental Research.
K.R. acknowledges partial support from a Wisconsin Space Grant Consortium Research Infrastructure Program grant. D.J.P. and K.R. acknowledge partial support from NSF CAREER grant AST-1149491.
The National Radio Astronomy Observatory is a facility of the National Science Foundation operated under cooperative agreement by Associated Universities, Inc.
This research has made use of the NASA/IPAC Extragalactic Database (NED), which is operated by the Jet Propulsion Laboratory, California Institute of Technology, under contract with the National Aeronautics and Space Administration. We acknowledge the use of NASA's SkyView facility (http://skyview.gsfc.nasa.gov) located at NASA Goddard Space Flight Center.
This publication makes use of data products from the Two Micron All Sky Survey, which is a joint project of the University of Massachusetts and the Infrared Processing and Analysis Center/California Institute of Technology, funded by the National Aeronautics and Space Administration and the National Science Foundation.
Funding for SDSS-III has been provided by the Alfred P. Sloan Foundation, the Participating Institutions, the National Science Foundation, and the U.S. Department of Energy Office of Science. The SDSS-III website is http://www.sdss3.org/.
SDSS-III is managed by the Astrophysical Research Consortium for the Participating Institutions of the SDSS-III Collaboration, including the University of Arizona, the Brazilian Participation Group, Brookhaven National Laboratory, Carnegie Mellon University, University of Florida, the French Participation Group, the German Participation Group, Harvard University, the Instituto de Astrofisica de Canarias, the Michigan State/Notre Dame/JINA Participation Group, Johns Hopkins University, Lawrence Berkeley National Laboratory, Max Planck Institute for Astrophysics, Max Planck Institute for Extraterrestrial Physics, New Mexico State University, New York University, Ohio State University, Pennsylvania State University, University of Portsmouth, Princeton University, the Spanish Participation Group, University of Tokyo, University of Utah, Vanderbilt University, University of Virginia, University of Washington, and Yale University.
Appendix: Individual Galaxies
A.1. SDSS 0119+1452
SDSS 0119+1452 (NGC 469; Figure 1) has asymmetric H i emission that has its highest column density coinciding with its optical center. Its velocity contours are disturbed, and its H i major axis is nearly perpendicular to its optical major axis. This morphology is similar to polar bulge galaxies (Corsini et al. 2012), and thus may be a result of an acquisition of gas after the nuclear portion of the galaxy was formed. It has a blob of H i emission to its southwest that does not have an optical counterpart and is either not connected to the main galaxy, or connected at a low column density. In low-resolution H i maps, the H i blob is not separate from the main galaxy. Its area of highest H i velocity dispersion coincides with its optical emission.
In SDSS optical images, SDSS 0119+1452 does not have discernable spiral arms. Galaxy Zoo 1 (Lintott et al. 2011) classifies it as "uncertain," with a 31% probability of being a spiral galaxy (18% probability of being an edge-on spiral), a 28% probability of being an elliptical galaxy, and a 24% probability of being a merger. It has the elongated, clumpy appearance of a "bent chain" galaxy similar to those identified by Elmegreen & Elmegreen (2006), although Garland et al. (2015) classified it as not being clumpy since it has fewer than three distinct clumps. Outside of the bright central clumpy emission, it has low surface brightness optical emission.
Pérez-Gallego et al. (2011) mapped SDSS 0119+1452 in H α emission and identified it as a preturbed rotator following the classification system of Yang et al. (2008). This implies that its velocity contours show ordered rotation, including a major axis aligned with the optical major axis, but the peak of the velocity dispersion occurs away from the galaxy's center. In our H i maps, its H i contours do show rotation, and the peak of its H i velocity dispersion coincides with its optical center, which would suggest that its H i should be classified as a rotating disk. However, since its H i major axis is misaligned with its optical major axis, SDSS 0119+1452 may be considered to have complex kinematics according to the Yang et al. (2008) classification system.
SDSS 0119+1452 was detected in H i with Arecibo in the ALFALFA survey (Haynes et al. 2011), with an H i mass of  . Garland et al. (2005) observed SDSS 0119+1452 in the J = 2–1 transition of CO and did not detect any CO above the
  level. They reported an upper limit for molecular gas mass of
  . Jiang et al. (2015) did detect SDSS 0119+1452 in the CO J = 2–1 transition; they derived a molecular gas mass of
  .
.
SDSS 0119+1452 does not have any companions that we detect in H i. (The H i clump to the galaxy's southwest does not coincide with any optical source, and has similar velocity to the receding edge of the galaxy's main H i emission, so it appears to be associated with SDSS 0119+1452.) The nearby galaxies seen in optical images are members of the higher-redshift cluster Abell 175. (SDSS 0119+1452 is not a member of that cluster.)
A.2. SDSS 0125+0110
SDSS 0125+0110 (ARK 044; Figure 2) has velocity contours representative of a rotating disk, and has an easily identifiable H i major axis that is coincident with its optical major axis. Its H i emission is much more extended than its optical emission, and its region of highest column density is offset from its optical emission.
Optical images of SDSS 0125+0110 show visible spiral arms. Galaxy Zoo classifies this galaxy as a spiral (96% probability) with anticlockwise arms (89% probability). Its center is redder than the centers of other galaxies in our sample, and it does not have large star-forming clumps, though it does appear to have smaller star-forming clumps near the outer regions of its disk.
While SDSS 0125+0110 does not appear to be interacting with any other galaxies, it is not necessarily isolated. Zabludoff & Mulchaey (1998) include SDSS 0125+0110 in the NGC 533 group using velocity analysis derived from optical spectroscopy, though it is far enough away from NGC 533 (the group's central brightest cluster galaxy) that we do not detect other galaxies in H i in our observed data. A significant fraction of intermediate-redshift LCBGs have been found to be on the outskirts of groups and clusters (Crawford et al. 2016), where their star formation is enhanced as they interact with the cluster potential and then quenched as their gas is stripped once they have passed through the cluster. It is possible that this is the reason for SDSS 0125+0110 experiencing an LCBG phase even though it does not have evidence of a recent interaction or clumpy star formation. We note that following SDSS-III photometry, SDSS 0125+0110 is redder and has a lower B-band surface brightness than the LCBG criteria defined by Werk et al. (2004).
A.3. SDSS 0728+3532
SDSS 0728+3532 (ARK 134; Figure 3) has H i emission that is concentrated near its optical center, velocity contours that are representative of a rotating disk, and velocity dispersion contours that trace the H i and optical emission. It also has an H i tidal tail that encompasses a companion galaxy to its south and extends to the south and east. In addition, it has a companion to its southwest that we detect in H i and is rotating in the opposite direction as SDSS 0728+3532.
In SDSS images, the three galaxies do not appear to be obviously interacting. The H i tidal tail does not have a corresponding feature visible in SDSS optical images, with the exception of the companion galaxy that is embedded in it. SDSS 0728+3532 is symmetric in SDSS images without visible extended low surface brightness features. The companion galaxy also does not have any visible stellar streams or other obvious optical signs of interactions. SDSS 0728+3532 has visible spiral arms and many regions of clumpy star formation. Galaxy Zoo 1 classifies it as a spiral galaxy (76% probability) with anticlockwise arms (70% probability). Galaxy Zoo 2 (Willett et al. 2013) classifies it as most likely to be a barred spiral galaxy with an unknown number of arms of medium tightness. Both companion galaxies are blue and appear to be edge-on disk galaxies. (Galaxy Zoo 1 classifies both of them as most likely to be edge-on spirals.)
SDSS 0728+3532 was observed in the J = 2–1 transition of CO by Garland et al. (2005) but was not detected. It has a  upper limit of molecular gas mass of
  . (The beam size of the CO observation is not large enough to include its companions.)
A.4. SDSS 0934+0014
SDSS 0934+0014 (UGC 05097; Figure 4) has asymmetric H i emission that is not much more extended than the optical emission. The peaks of its Moment 0 and Moment 2 maps coincide with the optical galaxy, although the H i emission is more extended on the galaxy's east side than its west side. Its velocity contours show rotation, and its major axis aligns with its optical major axis. The velocity contours near the optical center are not as closely spaced as is typical for galaxies that are not close to face-on, though its optical emission does not appear to be face-on. It has two companions: SDSS J093410.47+001528.5 to the north, and UGC 05099 to the southeast. UGC 05099 is strongly detected in H i emission in the low-resolution Moment 0 map, while SDSS J093410.47+001528.5 is not detected in H i in the low-resolution map shown in Figure 4. In low-resolution maps made with less flagging of radio interference, there is H i emission that coincides with the optical position of SDSS J093410.47+001528.5, though the column density of this emission is not high enough to distinguish it from noise.
In optical SDSS images, SDSS 0934+0014 is a blue, clumpy disk galaxy with spiral arms. Its companions are also both disk galaxies, with its northern companion being a blue disk galaxy fainter than SDSS 0934+0014, and its southeastern companion being a spiral galaxy with a redder appearance. Galaxy Zoo 1 classifies SDSS 0934+0014 as uncertain, with 74% of voters indicating that they do not know whether it is a spiral or elliptical galaxy.
SDSS 0934+0014 was detected in the J = 1–0, J = 2–1, and J = 3–2 transitions of CO by Garland et al. (2005). They find its molecular gas mass to be  .
.
A.5. SDSS 0936+0106
SDSS 0936+0106 (CGCG 007-009; Figure 5) has velocity contours indicative of ordered rotation. The peak of its H i emission is offset from the peak of its optical emission, though the two peaks are within a beam size of each other. Its H i major axis aligns with its optical major axis, and its Moment 1 map does not show evidence of interactions. Its Moment 2 map is centrally peaked, which is consistent with a rotating disk galaxy.
In SDSS images of SDSS 0936+0106, its center is redder than the rest of the galaxy, which is primarily made up of blue spiral arms. The spiral arms are much brighter close to the center of the galaxy, but low surface brightness spiral features are visible outside of the center. The spiral arms do not have large clumps. Galaxy Zoo 1 classifies SDSS 0936+0106 as a spiral galaxy (97% probability) with anticlockwise arms (91% probability). Galaxy Zoo 2 classifies SDSS 0936+0106 as having evidence of a disk or spiral features (97% probability) with 3–4 tightly wound spiral arms, a bulge that is just noticeable, and no bar. Its companion appears to be a blue edge-on disk galaxy, and is detected in H i in our low-resolution map.
SDSS 0936+0106 was detected in the J = 1–0 transition of CO and not detected in the J = 2–1 transition by Garland et al. (2005). They measured a molecular gas mass of  . Prada et al. (2003) identified the companion galaxy that we detect in H i as being a satellite galaxy of SDSS 0936+0106.
A.6. SDSS 1319+5203
SDSS 1319+5203 (SBS 1317+523B; Figure 6) is the second-brightest in a group of three star-forming galaxies that share a common H i envelope. It also contains the second-most H i of the three galaxies in the envelope. Both this and the brightest galaxy in the group, SBS 1317+523A, show evidence of independent rotation in the Moment 1 map, while the faintest of the three galaxies, Mrk 251, does not show clear rotation. In their common H i envelope, the areas with the highest velocity dispersions appear to be where SDSS 1319+5203 interacts with each of its companions.
SDSS 1319+5203 is a compact, blue, fuzzy, relatively featureless galaxy that appears to have a central star-forming clump. Its SDSS images do not show signs of past interactions like stellar streams or asymmetric features. Its brighter companion, SBS 1317+523A, appears more disk-like with clumpy star formation, and its fainter companion, Mrk 251, is also blue, compact, and fuzzy. Galaxy Zoo 1 classifies SDSS 1319+5203 as having a 44% probability of being elliptical, and a 29% probability of being a spiral galaxy. Galaxy Zoo 2 gives it a higher probability of being smooth (55%) than having a disk or features (45%).
Past studies of groups of star-forming galaxies have also identified SDSS 1319+5203 as being in a trio of field galaxies (e.g., Petrosian et al. 2002). Pustilnik et al. (2001) classified SDSS 1319+5203 and SBS 1317+523A as a binary pair of galaxies with similar masses that are likely triggering star formation in each other, even if they are not a merging pair. Petrosian et al. (2002) identified the brightest galaxy in the group, SBS 1317+523A, as having experienced a merger in the past. Garland et al. (2005) did not detect the J = 2–1 transition of CO in SDSS 1319+5203, and reported an upper limit of molecular gas of  .
.
A.7. SDSS 1402+0955
SDSS 1402+0955 (NGC 5414; Figure 7) has asymmetric, centrally concentrated H i emission. Its Moment 1 map shows that it is a rotating galaxy, though in contrast to other undisturbed rotating galaxies like SDSS 0125+0110 and SDSS 0936+0106, its velocity contours are closer together at the edges of the galaxy at each end of its minor axis than they are in the center. This results in the galaxy's velocity dispersion being highest at its western edge, although the broad distribution of its velocity dispersion follows a pattern of being lower at larger radii and higher closer to the center of the galaxy.
SDSS 1402+0955 is blue and clumpy in SDSS images. Its optical emission is elongated and asymmetric, with SDSS images showing fainter optical emission that extends to the northwest and southeast. The major axis along its bright optical emission aligns with its H i major axis. It is irregularly shaped, with little obvious spiral structure. Galaxy Zoo 1 classifies this galaxy as uncertain, with a 12% probability of having an elliptical morphology, a 47% probability of having a spiral morphology, and an 18% probability of being a merger. A total of 23% of Galaxy Zoo 1 classifiers chose "do not know" as its most likely morphology. Galaxy Zoo 2 classifies this galaxy as most likely having "features or a disk" (56%), with the most common "odd" feature being its irregular shape. (A total of 92% of Galaxy Zoo 2 classifiers indicated an odd feature, and 78% of classifiers who indicated an odd feature specified an irregular shape.)
While we do not detect other galaxies in H i emission in the same data cube as SDSS 1402+0955, Koranyi & Geller (2002) identified this galaxy as possibly being part of the cluster MKW 12. Their velocity analysis suggested that SDSS 1402+0955 is likely part of a foreground substructure of this cluster. This substructure is not conclusively kinematically linked to the main cluster, and Koranyi & Geller (2002) hypothesized that it may be in the process of joining the main cluster. This is consistent with the conclusions of Crawford et al. (2011, 2014) that some LCBGs are making their first pass through a cluster. SDSS 1402+0955 was detected in the J = 1–0 and the J = 2–1 transitions of CO, with a molecular gas mass of  (Garland et al. 2005).
A.8. SDSS 1507+5511
SDSS 1507+5511 (UGC 09737; Figure 8) has H i emission that is elongated near the galaxy's optical emission, and then extends asymmetrically to the northeast at a lower column density. While this galaxy looks like it may have H i emission with a morphology similar to the optical "cometary" or "tadpole" emission, sometimes seen in blue compact star-forming galaxies (e.g., Loose & Thuan 1986; van den Bergh et al. 1996), its optical emission does not show this asymmetric morphology, and its Moment 1 map shows evidence of rotation throughout its H i emission (its velocity contours run perpendicular to the elongated concentration of H i in its Moment 0 map). The galaxy's velocity dispersion contours roughly follow its H i content, with a few small "hot spots" in its lower column density emission to the northeast. A companion is visible in the low-resolution Moment 0 map.
SDSS images of SDSS 1507+5511 show a relatively featureless galaxy with a central bright knot, and a stellar disk that appears to have its light arranged in shell-like structures. Galaxy Zoo 1 classifies this galaxy as "uncertain," with a 37% probability of being elliptical, and a 48% probability of being a spiral galaxy. Galaxy Zoo 2 classifies this object as likely being a disk galaxy (67%) rather than being smooth (31%). It is likely to be barred (a 90% probability from the classifiers who identified it as a disk galaxy), and does not have obvious spiral arms (83% of classifiers who identified it as a disk galaxy voted that they could not tell how many spiral arms the galaxy had).
The mismatch between the optical and H i morphology in SDSS 1507+5511 looks similar to the H i morphology of another galaxy, NGC 4522, that was mapped by Kenney et al. (2004). That galaxy is not an LCBG, but its H i Moment 0 map shows the elongated emission along the galaxy's major axis with the extra emission above the plane of the galaxy that SDSS 1507+5511 also shows, and its Moment 1 map shows velocity contours that resemble a rotating disk, similar to those of SDSS 1507+5511. Kenney et al. (2004) identified the H i maps of NGC 4522 as showing evidence of the H i undergoing ram pressure stripping due to interactions between the galaxy's interstellar medium and the intracluster medium of the group to which NGC 4522 belongs. Giuricin et al. (2000) identified SDSS 1507+5511 as being part of a group containing five galaxies. We detect one of the galaxies in this group in the low-resolution Moment 0 map. The H i in SDSS 1507+5511 does not appear to be as strongly stripped as that of NGC 4522 (the H i emission does not extend throughout NGC 4522's entire disk, while it extends far beyond the optical disk of SDSS 1507+5511 on all sides), nor is SDSS 1507+5511 deficient in H i as other galaxies that appear to have undergone stripping are. Vollmer et al. (2001) simulated H i stripping for galaxies interacting with clusters, and found that a stripped galaxy's H i becomes less extended along its disk and more elongated in the direction of the stripping as the time after the initial interaction with the cluster increases. SDSS 1507+5511's H i morphology resembles that of a galaxy viewed edge-on in their simulation that is in the early stages of an interaction with its cluster. If SDSS 1507+5511's H i morphology is due to an interaction between its ISM and the ICM of its group, this interaction could also be the cause of its current star formation rate, consistent with Crawford et al. (2011, 2014).
Previous studies of LCBGs have detected atomic and molecular gas in this galaxy. Pérez-Gallego et al. (2011) mapped the Hα emission in SDSS 1507+5511 and identified it as a rotating disk from its velocity field and velocity dispersion. They found a dynamical mass of  . Garland et al. (2005) detected SDSS 1507+5511 in the J = 2–1 transition of CO. They found a molecular gas mass of
  .
.
A.9. Mrk 325
Mrk 325 (NGC 7673; Figure 9) has H i emission that does not extend much farther than its optical emission. The highest column density H i emission traces the galaxy's optical barlike feature. The velocity contours in its Moment 1 map are warped, though this galaxy shows a velocity gradient like all of the other LCBGs in our sample. When selecting a major axis for this galaxy, there were two possible position angles for which a major axis could be drawn perpendicular to the velocity contours; we chose the position angle that passed along the highest H i column density and the optical bar. The other possible major axis is in the direction of the bright clump to the northeast of the galaxy. The galaxy's velocity dispersion distribution is similar to that of its H i emission, with higher velocity dispersions coinciding with its optical bar, though in addition, it has clumps of higher velocity dispersion that roughly coincide with bright optical clumps. It has a larger companion, Mrk 326 (NGC 7677), that we also detect in H i. The H i emission in Mrk 326 is symmetric, disk-shaped, and centrally concentrated. Its velocity contours show evidence of Mrk 326 being dominated by ordered rotation, though Nordgren et al. (1997) found its H i emission shows evidence of warping.
In SDSS images, Mrk 325 is very blue, clumpy, asymmetric, and has visible irregular spiral structure. It does not have any Galaxy Zoo 1 or 2 classifications. It has a few large, bright, blue clumps, with a few smaller clumps along its spiral arms. It also appears to have a bar (or line of central clumps that are not as blue). Its spiral arms are asymmetric, with no obvious spiral structure southwest of the bar. Mrk 325 also has lower surface brightness optical emission surrounding the galaxy. The elongated, redder galaxy to the immediate north of Mrk 325 in optical images is at a higher redshift. (SDSS calculates a photometric redshift of  .) In contrast to the morphology of Mrk 325, its nearest companion, Mrk 326, is a redder spiral galaxy with a bright center, two well-defined spiral arms, and no visible clumps.
Mrk 325 is a well-studied galaxy that Pérez-Gallego et al. (2010) and Castillo-Morales et al. (2011) called a "prototypical LCBG" due to its clumpy, irregular appearance and high star formation rate. Past studies have found that its star formation is concentrated in 5–6 large clumps that are comprised of smaller star clusters. Pérez-González et al. (2003) measured 87 star-forming clusters that show Hα emission, and found that only 9% of the galaxy's ionized gas is diffuse rather than concentrated in the clumps. Homeier et al. (2002) found that one of the large clumps, Clump F, is likely one large object rather than a collection of clusters, and that the clumps only extend to half of the galaxy's optical radius. Beyond the clumps, the galaxy's disk is smooth, faint, and circular. Connected to this outer disk is an optical shell (Dettmar et al. 1984) that resembles those found around galaxies that are candidates for being in the late stages of a past major merger (Homeier et al. 2002). Homeier & Gallagher (1999) argue that an ongoing interaction with the most obvious candidate, Mrk 326, is unlikely due to the lack of a tidal tail associated with Mrk 325, as well as the symmetric and undisturbed morphology of Mrk 326. The most likely progenitor of both the low surface brightness shell and the star formation activity is likely to be a past minor merger with a dwarf galaxy (Homeier & Gallagher 1999; Homeier et al. 2002; Castillo-Morales et al. 2011). The brightest clump in Mrk 325, Clump B, has a decoupled kinematic component (Pérez-Gallego et al. 2010; we also observe a kinematic component in the direction of Clump B). Clump B also has the highest  content of all of the galaxy's clumps (including the central clump Castillo-Morales et al. 2011). The authors of those studies suggest that Clump B may be associated with the dwarf galaxy merger candidate.
Past studies of Mrk 325 have found small velocity gradients (Duflot-Augarde & Alloin 1982; Nordgren et al. 1997), though the galaxy also appears to be face-on. Pérez-Gallego et al. (2011) classified Mrk 325 as a rotating disk from maps of  emission. Pisano et al. (2001) found an H i rotation velocity of
  when corrected for inclination, with an H i radius of 8.3 kpc and a
  of
of  . Nordgren et al. (1997) mapped Mrk 325 with the VLA in its most compact configuration and found that its H i is offset to the west of the centroid of its low-luminosity optical emission and has a rotation axis whose position angle changes with increasing radius. They measured
  (Nordgren et al. 1997). Garland et al. (2005) detected the J = 1–0 and J = 2–1 transitions of CO in Mrk 325, and measured a molecular gas mass of
  . Garland et al. (2007) mapped Mrk 325 in H i with the VLA with a beam size of
  in C configuration, as well as in CO J = 1–0. They measured
  , and found that the molecular gas is concentrated near the optical bar. Our H i map of Mrk 325 combines the Garland et al. (2007) map with new B configuration data and archival D configuration data that were published by Nordgren et al. (1997).
Footnotes
- 8
- 9
- 10
- 11