


Abstract
We use N-body/hydrodynamical simulations to interpret the newly discovered Bullet-Cluster-like merging cluster ZwCl 0008.8+5215 (ZwCl008 hereafter), where a dramatic collision is apparent from multiwavelength observations. We have been able to find a self-consistent solution for the radio, X-ray, and lensing phenomena by projecting an off-axis, binary cluster encounter viewed just after first core passage. A pair of radio relics traces the leading (bow) and trailing (back) shock fronts that our simulation predicts, providing constraints on the collision parameters. We can also account for the observed distinctive comet-like X-ray morphology and the positions of the X-ray peaks relative to the two lensing mass centroids and the location of the well-defined bow shock. Relative to the Bullet Cluster, the total mass is about 70% lower, ∼1.2 × 10¹⁵ M⊙, with a correspondingly lower infall velocity, ∼1800 km s−1, and an impact parameter of P ∼ 400 kpc. As a result, the gas component of the infalling cluster is not trailing significantly behind the associated dark matter as in the case of the Bullet Cluster.
Export citation and abstract BibTeX RIS
1. Introduction
The Bullet Cluster has provided particularly direct evidence for the existence of dark matter by displaying a large offset between the gas component, marked by X-ray emission, and dark matter traced by gravitationally lensed images (Markevitch et al. 2002; Clowe et al. 2004). This merging cluster also demonstrates that dark matter is collisionless, because, although the X-ray shocks unambiguously reveal that two clusters have clearly just collided, the two dark matter centroids are still centered on their respective galaxy members. When two clusters suffer gravitational encounters, their respective member galaxies, being relatively small, are unlikely to collide with each other. Therefore, the cluster member galaxies are effectively collisionless; hence, if the dark matter has an associated collisional cross-section, it may be revealed by a relative displacement between the two dark matter lensing centroids and their respective member galaxy distributions. The amplitude of this displacement is proportional to the self-interaction cross-section of dark matter particles. Using this property, the Bullet Cluster was also the first to be used to put upper limits on the self-interaction cross-section of dark matter particles, providing quantitative evidence that dark matter is collisionless.
Markevitch et al. (2004) used analytic approximations to constrain the self-interaction cross-section of dark matter particles. Recently, Randall et al. (2008) carried out N-body simulations including scattering between dark matter particles and put stringent constraints on their cross-section. However, more recently, Robertson et al. (2017) performed the first self-consistent N-body/hydrodynamical simulations including the interactions of dark matter particles. Robertson et al. found that their self-consistent treatment suggests weaker constraints on the cross-section of dark matter particles and pointed out the importance of following the observational techniques as closely as possible when analyzing simulations, because the collision introduces asymmetries in the gas and dark matter distribution.
Since the discovery of the Bullet Cluster, more merging clusters with an offset between the centroids of the intracluster gas and the dark matter have been found (MACS J1149.5+2223: Golovich et al. 2016; CL 0152–1357: Molnar et al.2012 and Massardi et al. 2010; DLSCL J0916.2+2951: Dawson et al. 2012; ACT-CL J0102–4915: Menanteau et al. 2012; MACS J0717.5+3745: Mroczkowski et al. 2012; A1758N: Ragozzine et al. 2012; A2744: Merten et al. 2011; A2163: Okabe et al. 2011; ZwCL 0008.8+5215: van Weeren et al. 2011b; A1240: Barrena et al. 2009; MACS J0025.4–1222: Bradač et al. 2008; A520: Mahdavi et al. 2007).
The collisions of massive clusters of galaxies provide a unique possibility to study the nature of dark matter as these collisions are the most energetic of all phenomena (after the big bang), with the power to separate the collisional gas from the confining dark matter gravitational potential, including the galaxies, providing an effectively collisionless tracer population. Any significant inconsistencies in accounting for the relative dynamics of the components would therefore be of fundamental importance. To examine this possibility to the fullest requires, of course, appropriate simulations that incorporate dark matter and gas. The first test to make in this respect is to compare the best data with collisionless dark matter, which is well described by N-body simulations together with an appropriate hydrodynamical numerical scheme for the associated hot gas. The gas is much more difficult to model, but several high-quality codes with different levels of approximation and numerical schemes—ranging from adaptive mesh refinement (AMR) to smooth particle hydrodynamics (SPH)—have been constructed and tested for this purpose and applied to the Bullet Cluster (Mastropietro & Burkert 2008; Lage & Farrar 2014), CIZA J2242.8+5301 (Donnert et al. 2017; Molnar & Broadhurst 2017), El Gordo (ACT-CL J0102–4915, Molnar & Broadhurst 2015; Zhang et al. 2015), A1758N (Machado et al. 2015); A1750 (Molnar et al. 2013a), and CL 0152–1357 (Molnar et al. 2012); for a review, see Molnar (2016).
Several examples of extreme collisions, wherein the speed of the infalling cluster exceeds the sound speed of the gas, and thus merging shocks are generated, have now been analyzed in detail. These shock fronts, in some systems, are traced by radio "relics," which are large-scale diffuse synchrotron emission (Enßlin 1999; for a recent review, see Feretti et al. 2012). There are also very bright X-ray features corresponding to compressed gas that, although subsonic, are relatively dense, so that the X-ray emission is enhanced, showing a large-scale cometary morphology, such as in El Gordo (Menanteau et al.2012), for example. This morphology has been readily explained as an off-axis binary collision in self-consistent N-body/hydrodynamical numerical simulations assuming zero self-interacting cross-section for the dark matter (Molnar & Broadhurst 2015; Zhang et al. 2015). Radio relics in El Gordo delineate a bow shock and a back shock. We define the bow shock as the shock front in the gas of the main cluster generated by the infalling cluster, which resembles the bow shock of a bullet flying through the air. The back shock is the shock front propagating in the gas of the infalling cluster in the opposite direction to the cluster. The back shock in El Gordo was detected by X-ray and Sunyaev-Zel'dovich (SZ) observations (Basu et al. 2016; Botteon et al. 2016). Another such example is CIZA J2242.8+5301, the "Sausage" cluster, in which, in addition to tidally compressed gas between the two merging clusters highlighted by X-ray emission, there are impressive radio relics marking the location of the bow shock front with evidence of a back shock in the radio observations (van Weeren et al. 2010; Stroe et al. 2013; Hoang et al. 2017).
This numerical work has, in the above cases, found consistency with the collisionless dark matter hypothesis by finding compelling agreement among the independent observables, including the lensing, radio relic, X-ray, and SZ data that are increasingly being obtained from examining binary collision clusters. However, in some cases, the offsets between dark matter and gas cannot be readily modeled as these are complex systems with multiple mergers, such as the "Pandora" cluster (A2744), for example (Merten et al. 2011; Lam et al. 2014; Zitrin et al. 2014; Medezinski et al. 2016). Even for binary collisions it is very clear that approximate or misleading eyeball statements regarding basic collision parameters are often easily cleared up uniquely, thanks to comparison with a suite of numerical calculations. In particular, statements regarding the relative impact velocity and the time after first core passage when the system is being viewed are often highly uncertain without the guidance of a full self-consistent simulation (e.g., Ng et al. 2015; Golovich et al. 2017).
The issue of relative velocity is particularly interesting as it provides a definitive test of the ΛCDM scenario. The observed infall velocities in merging clusters can be compared to the distribution of the relative velocities of dark matter halos derived from N-body simulations based on ΛCDM. The first such consistency test was inspired by the Bullet Cluster. The infall velocities in the Bullet Cluster, ∼3000 km s−1, derived using detailed N-body/hydrodynamical simulations based on multifrequency observations, seemed to be too high for ΛCDM models (Mastropietro & Burkert 2008; Lee & Komatsu 2010; Thompson & Nagamine 2012; Bouillot et al. 2015). By contrast, Watson et al. (2014) and Lage & Farrar (2015), using different cosmological simulations, concluded that the Bullet Cluster is not excluded by the ΛCDM. Kraljic & Sarkar (2015), using the "Dark Sky Simulations," found that finding one Bullet-like cluster is compatible with the ΛCDM models. However, more high-infall-velocity merging clusters have been identified recently (Abell 2744: Owers et al. 2011; CL J0152–1347: Molnar et al. 2012; MACS J0717.5+3745: Ma et al. 2009 and Sayers et al. 2013; El Gordo: Molnar & Broadhurst 2015).
The probability of finding all of these massive systems simultaneously based on cosmological simulations of ΛCDM models has not yet been assessed. It is an open question today whether their infall velocities are compatible with the predictions of our standard ΛCDM models. Clearly, a statistical sample of such clusters is of great interest to clarify this question further. A confirmation of a sample of merging clusters with high infall velocities could be a serious challenge to standard ΛCDM models (e.g., Kraljic & Sarkar 2015; Molnar 2015).
Here we apply our well-tested FLASH-based three-dimensional (3D) N-body/hydrodynamical code to a recently discovered Bullet-Cluster-like binary collision encounter (Golovich et al. 2017), but for which self-consistent simulations have yet not been applied. This system has the advantage of showing a clear-cut pair of radio relics, a distinct bullet-like X-ray morphology, weak gravitational-lensing-based mass centroids for the two interacting components, and line-of-sight (LOS) redshift information for cluster member galaxies (Golovich et al. 2017). We follow the time evolution of the merging shocks until they leave the intracluster gas, and test the assumption of collisionless dark matter inherent to the standard ΛCDM cosmology. We make use of the AMR code FLASH, allowing us to follow the shocks in the low-density intracluster gas, which is not well-represented in the fixed-grid Eulerian scheme and codes based on SPH (for a comparison between AMR and SPH simulations, see, e.g., Agertz et al. 2007; Mitchell et al. 2009).
The structure of this paper is as follows. In Section 2, we summarize results from previous analyses of ZwCl008 based on multifrequency observations and numerical simulations. We describe our simulation setup for modeling ZwCl008 as a binary merger in Section 3. Section 4 presents our results, a dynamical model for ZwCl008, a discussion on the dynamics of merging shocks in clusters similar to ZwCl008, and a comparison with the Bullet Cluster. Section 5 contains our conclusions. We adopt a spatially flat ΛCDM cosmology with h = 0.7, and Ωm = 0.3, thus ΩΛ = 0.7. Unless stated otherwise, the quoted errors represent 68% confidence levels (CLs).
2. ZwCl008: A Newly Discovered Bullet-like Cluster
The merging cluster ZwCl008, at a redshift of 0.1032, was observed by van Weeren et al. (2011b) using the Giant Metrewave Radio Telescope at 241 and 640 MHz, and the Westerbrook Synthesis Radio Telescope (WSRT) at 1.3–1.7 GHz. They found two radio relics to the east and west of the X-ray peak emission, with the eastern relic much more elongated (first panel of Figure 1). The spectral indices of both relics are steepening toward the cluster center, suggesting that they are moving outward, away from the center of the merging system. The spectral indices at the front of the eastern and western relics were reported to be −1.2 ± 0.2 and −1.0 ± 0.15. Adopting these as the spectral indices of the injection distribution, they derive Mach numbers  and
and  for the eastern and western relics; the polarizations were constrained to 5%–25% and 5%–10%, respectively.
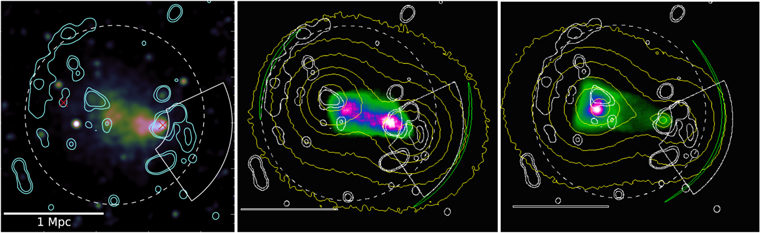
Figure 1. Left panel: Chandra X-ray color image of ZwCl008 with the WSRT radio radio contours (cyan) based on WSRT observations overlaid (from van Weeren et al. 2011b; Golovich et al. 2017). The white dashed circle and the horizontal bar represent R500 and a length of 1 Mpc, respectively. The white annular sector marks the proposed shock region (see Golovich et al. 2017). The two BCGs are marked by the red crosses. Middle panel: on the same scale, a simulated X-ray image based on our best model (run P400V18B) at t = 428 Myr after the first core passage with the contours of the dark matter distribution overlaid (yellow). The green contours represent the outgoing shocks. The viewing angle was chosen to match the observations (see the text for details). The bow shock on the right is ahead of the infalling cluster moving to the right; the back shock on the left is moving to the left, in the opposite direction to the motion of the infalling cluster. Right panel: on the same scale, our run P50V16G with initial conditions suggested by Golovich et al. (2017). The bright X-ray peak is associated with the gas of the main cluster, not with the infalling cluster as observed. Most of the gas of the infalling cluster has been stripped off as a result of its low mass and the relatively high velocity at pericenter.
Download figure:
Standard image High-resolution imageMore recently, Kierdorf et al. (2017) carried out high-frequency radio observations of ZwCl008 at 4.85 and 8.35 GHz with the Effelsberg telescope. They found the polarization fraction of the eastern relic to be between 20% and 30% and derived a Mach number of  , in agreement with previous radio measurements of van Weeren et al. (2011b).
Most recently, Golovich et al. (2017) performed a dynamical analysis of ZwCl008 based on detailed radio (JVLA), optical (HST, Subaru/SuprimeCam, Keck/DEIMOS), and X-ray (Chandra/ACIS-I) observations and weak lensing observations (Subaru/HST). From the bullet-like X-ray morphology, they concluded that the merging system is past the first core passage. Golovich et al. derived the masses of the subclusters based on weak gravitational lensing and found masses of  and
and  for the main and infalling cluster, respectively, giving a mass ratio of ≃5. Golovich et al. fixed the concentration parameters at the values suggested by the mass–concentration parameter scaling derived by Duffy et al. (2008) based on N-body cosmological simulations (c200,1 = 4 and c200,2 = 4.6). They found the total mass of the system,
  , by numerically integrating the two NFW models out to R200. Here, M200, R200, and c200 are the mass, radius, and concentration parameter—related physical quantities associated with average cluster densities 200 times the critical density.
Golovich et al. (2017) used this information as input in their dynamical model, which is based on fixed NFW (Navarro et al. 1997) gravitational potentials for the two components and zero impact parameter, ignoring the effects of gas, gravitational tidal force, and mass loss, and integrating the equations of motion numerically. Golovich et al. estimated the merger velocity at pericenter and obtained  km s−1. The inclination angle relative to the plane of the sky, θ, was constrained to
  , which is consistent with the direct constraint derived from radio polarization measurements:
  . Golovich et al. concluded that the gas of the two merging subclusters is still moving outward and derived the phase of the system as either
  Gyr or
  Gyr after the first core passage for the outgoing phase and infalling phase (after the first turnover), respectively. They could not distinguish between the outgoing and returning phases because their dynamical model is time symmetric; it includes only dark matter and not gas.
3. Modeling ZwCl008 Using Hydrodynamical Simulations
Our main goals were to obtain a reasonable physical model for the newly discovered Bullet-Cluster-like merging cluster ZwCl008 using N-body/hydrodynamical simulations, and thus to estimate the infall velocity and constrain the phase of the collision.
3.1. Details of the Simulations
We modeled ZwCl008 in 3D using the Eulerian N-body/hydrodynamic code FLASH (developed at the Center for Astrophysical Thermonuclear Flashes at the University of Chicago; Fryxell et al. 2000; Ricker 2008). FLASH is a publicly available AMR code, which can be run in parallel computer architectures. We assumed a binary merger for ZwCl008 and included dark matter and gas self-consistently, taking their gravity into account dynamically. We used our well-established method to carry out merging cluster simulations (Molnar et al. 2012, 2013a, 2013b; Molnar & Broadhurst 2015, 2017). For our simulations, we adopted a large box size (13.3 Mpc on a side) to capture the outgoing merger shocks and avoid losing mass during the time we ran our simulations. Our highest resolution, 12.7 kpc, was reached at the cluster centers, merger shocks, and in the turbulent regions behind the shocks. We chose a 3D Cartesian coordinate system, x, y, z, with the x, y plane containing the centers of the clusters and the initial (relative) velocity vector of the infalling cluster in the positive x direction. We included shock heating, the most important non-adiabatic process in merging clusters, and ignored other heating and cooling processes (e.g., supernova and AGN feedback, radiative cooling, etc.).
The initial models of the clusters were assumed to have spherical geometry with cutoffs of the dark matter and gas densities at the virial radius, Rvir. We assumed an NFW model (Navarro et al. 1997) for the dark matter distribution,

where x(r) = r/rs (rs = Rvir/cvir) and ρs are the scaling parameters for the radius and the amplitude of the density, respectively, and cvir is the concentration parameter. We adopted a non-isothermal β model for the gas density,

where y = r/rcore is the scaling parameters for the radius r (in units of the core radius, rcore), and ρ0 is the density at the center of the cluster. The exponent β determines the falloff of the density at large radii. We adopted β = 1, suggested by cosmological numerical simulations for the large-scale distribution of the intracluster gas in equilibrium (excluding the filaments; see Molnar et al. 2010).
We derived the gas temperature as a function of the radius, T(r), assuming hydrostatic equilibrium, adopting γ = 5/3 for the ideal gas equation of state. We used a gas fraction fgas = 0.14 and represented baryons in galaxies together with collisionless dark matter particles, since, for our purposes, galaxies can also be considered collisionless.
It is less straightforward to model a stable dark matter density distribution than a gas distribution. The hydrostatic equilibrium assumption provides a stable distribution for the gas, but the dark matter, modeled as particles, has no pressure, interacting only gravitationally with itself and the gas, which means that they move on orbits in the potential of the cluster. We use the local Maxwellian approximation for the amplitude of the velocities of the dark matter particles: we randomly sample a Maxwellian distribution with a velocity dispersion as a function of radius, r, σv (r) derived from the Jeans equation assuming that the distribution of σv (r) is isotropic (Łokas & Mamon 2001). We assumed an isotropic distribution for the direction of the velocity vectors (for more details of the setup for our simulations see Molnar et al. 2012).
3.2. FLASH Runs
We have run a series of FLASH simulations varying the initial masses, concentration parameters, impact parameter, and infall velocity of our models. Our aim was to find a physical model for ZwCl008 with a reasonable agreement with observations.
The long bright radio relic to the east most likely marks the location of the back shock (as in the Sausage cluster, as demonstrated by Molnar & Broadhurst 2017), due to the limb brightening of the spherical surface of the relic viewed in projection. The position of the bow shock associated with the infalling cluster is much less certain. The radio relics do not show a bright edge here, as in the case of the back shock, and this forward shock is not detected by the X-ray observations (Golovich et al. 2017). We estimate from our models that it should lie ahead of the small radio relic that we nevertheless associate with this shock. The reason for this displacement can be simply geometric in origin. We may approximate the surface of the bow shock with a hyperboloid of revolution soon after the first core passage (see the middle panel in Figure 1). If there are relics covering the shock surface well and the symmetry axis of the hyperboloid of revolution is not rotated far from the plane of the sky (say less than 40°), the relics will delineate the shock surface, showing a bright rim in projection because the radio emission, which is optically thin, adds up in projection. Indeed, notable examples of large anomalously bright shock fronts, in particular, the bow shock in the Sausage cluster (van Weeren et al. 2011a), are known, which modeling has shown to coincide with their observed projected shock front (Molnar & Broadhurst 2017). However, when there are only a few relics tracing the shock surface, as in the case of the bow shock in ZwCl008, the position of the shock is not well defined because we do not see a bright edge but only a few randomly scattered relics. When the rotation angle is reasonably small, no patches can fall outside of the edge of the hyperboloid of revolution in projection (as it surrounds a convex volume), thus we expect the projected shock surface to be outside of the relics, ahead of them, toward the direction of the assumed motion of the shock. This can be clearly seen in Figure 4 of van Weeren et al. (2011a), where, in projection, the simulated radio emission from relics is inside the projected shocks.
To find the best model, we used the following set of criteria: the position of the back shock as suggested by the radio relics (van Weeren et al. 2011b), the distance and positions of the mass centers of the subclusters derived from gravitational lensing (Golovich et al. 2017), the positions of the bright and secondary X-ray peaks associated with the infalling and main cluster, and the X-ray morphology (e.g., the cometary shape of the bright X-ray peak; the secondary peak, which is much fainter and forms a plateau; the two peaks, which are not well separated; Golovich et al. 2017).
A systematic parameter search is currently beyond reach of conventional high-speed computing resources based on CPUs. Therefore, first we analyzed simulations in parameters randomly distributed in a larger parameter space: initial cluster masses  ≤ Mvir1,2 ≤ 1.2 ×
  , concentration parameters 3 ≤ cvir1,2 ≤ 10, and infall velocities and impact parameters of 500 kpc ≤ Vin ≤ 3000 kpc and 0 kpc ≤ P ≤ 600 kpc. We choose simulations from our extended suite of simulations we carried out earlier, or performed new simulations. This process narrowed down the parameter space substantially. We also carried out a suite of simulations to provide a rough estimate of the errors on the infall velocity, impact parameter, and masses of the merging system before the collision.
Table 1 contains a list of the initial parameters of those simulations we discuss in this paper. This is a narrow subset of parameter space that contains our best solution with enough spread to illustrate the observable effects of moving away from it. The first column contains the IDs of our runs as "PijkVmn," where "Pijk" is the impact parameter in kpc, and "Vmn" is the infall velocity in units of 100 km s−1. In columns 2–5, we show the virial masses, Mvir (in units of  ), and concentration parameters (cvir) of the two subclusters. Columns 6 and 7 contain the impact parameters (P) and infall velocities (Vin) in km s−1. We define the infall velocity as the relative velocity of the two clusters at the time of their first contact, i.e., when the distance between them is Rvir1 + Rvir2.
Table 1. IDs and Input Parameters for the Different Models Used in Our Hydrodynamical Simulations
| IDa | Mvir1 b | cvir1b | Mvir2 c | cvir2c | Pd | Vine |
|---|---|---|---|---|---|---|
| P400V18B | 7.0 | 5 | 5.0 | 5 | 400 | 1800 |
| P050V05G | 5.7 | 4 | 1.2 | 4.6 | 50 | 500 |
| P200V10G | 5.7 | 4 | 1.2 | 4.6 | 200 | 1000 |
| P400V16G | 5.7 | 4 | 1.2 | 4.6 | 400 | 1600 |
| P300V18 | 7.0 | 5 | 5.0 | 5 | 300 | 1800 |
| P500V18 | 7.0 | 5 | 5.0 | 5 | 500 | 1800 |
| P400V15 | 7.0 | 5 | 5.0 | 5 | 400 | 1500 |
| P400V20 | 7.0 | 5 | 5.0 | 5 | 400 | 2000 |
| P400C44 | 7.0 | 4 | 5.0 | 4 | 400 | 1800 |
| P400C66 | 7.0 | 6 | 5.0 | 6 | 400 | 1800 |
| P400C56 | 7.0 | 5 | 5.0 | 6 | 400 | 1800 |
| P400C54 | 7.0 | 5 | 5.0 | 4 | 400 | 1800 |
| P400C65 | 7.0 | 6 | 5.0 | 5 | 400 | 1800 |
| P400C64 | 7.0 | 6 | 5.0 | 4 | 400 | 1800 |
| P400C45 | 7.0 | 4 | 5.0 | 5 | 400 | 1800 |
| P400C46 | 7.0 | 4 | 5.0 | 6 | 400 | 1800 |
| P400C68 | 7.0 | 4 | 5.0 | 6 | 400 | 1800 |
| P400V18M1 | 7.0 | 5 | 5.5 | 5 | 400 | 1800 |
| P400V18M2 | 7.0 | 5 | 4.5 | 5 | 400 | 1800 |
| P400V18M3 | 7.5 | 5 | 5.5 | 5 | 400 | 1800 |
| P400V18M4 | 7.5 | 5 | 5.0 | 5 | 400 | 1800 |
| P400V18M5 | 7.5 | 5 | 4.5 | 5 | 400 | 1800 |
| P400V18M6 | 6.5 | 5 | 5.5 | 5 | 400 | 1800 |
| P400V18M7 | 6.5 | 5 | 5.0 | 5 | 400 | 1800 |
| P400V18M8 | 6.5 | 5 | 4.5 | 5 | 400 | 1800 |
| P400V18C68 | 7.0 | 6 | 5.0 | 8 | 400 | 1800 |
Notes.
aIDs of the runs indicate the impact parameters in kpc and the infalling velocities in units of 100 km s−1. bVirial mass in units of and concentration parameter for the main cluster (1).
cVirial mass in units of
and concentration parameter for the main cluster (1).
cVirial mass in units of  and concentration parameter for the infalling cluster (2).
dImpact parameter in units of kpc.
eInfall velocity of cluster 2 in km s−1.
and concentration parameter for the infalling cluster (2).
dImpact parameter in units of kpc.
eInfall velocity of cluster 2 in km s−1.
Download table as: ASCIITypeset image
4. Results and Discussion
4.1. Dynamical Model for ZwCl008
The second panel in Figure 1 shows a simulated X-ray color image of our best model at the epoch of tb = 428 Myr after the first core passage for ZwCl008, run P400V18B, with infall velocity Vin = 1800 km s−1, impact parameter P = 400 kpc, masses Mvir1 = 7 ×  and Mvir2 = 5 ×
  , and concentration parameters cvir1 = 5 and cvir2 = 5 (main and infalling cluster). The concentration parameters for the two colliding clusters we derived are close to cvirD,1 = 5.25 and cvirD,2 = 5.4, as suggested by the mass–concentration relation of Duffy et al. (2008) for virial overdensities. The yellow contours represent the projected dark matter distribution from our simulation. The white contours are based on radio observations; the white dashed circle and the horizontal bar represent R500 and a physical length of 1 Mpc (from Golovich et al. 2017; as in the first panel). The viewing (rotation) angles were chosen the following way. First, we rotated the system by an angle φ = 29° ("roll angle") around the axis connecting the two dark matter centers (rotation around the y-axis) then we rotated this axis by an angle θ = − 70° out of the x–y plane. θ was chosen to provide a projected distance between the two dark matter centers, D = 940 kpc, to match the positions of the observed centers based on weak lensing mass reconstruction; the roll angle was chosen to find the best match with the observed X-ray morphology (Golovich et al. 2017). We chose the output (epoch) that could be rotated in such a way that the position of the back shock is near the eastern edge of the observed long radio relic to the east of the X-ray peak and the bow shock in the west is not inside the radio relic associated with it, as radio observations suggest (van Weeren et al. 2011b). The shocks in our simulated images were located based on projected pressure gradients. A detailed description of our method to generate mock X-ray and mass surface density images can be found in Molnar & Broadhurst (2015).
In Figure 2, we show images of models for ZwCl008, which do not satisfy our requirements for a good match with the data. In this figure, the color images represent the simulated X-ray surface brightness, and the color code for the contours is the same as in the second panel in Figure 1. The procedure is as follows. First, we aligned the position of the X-ray peak associated with the infalling cluster with that of the observed, then we chose the projection angles to match the distances and position angles between the dark matter centers to match those derived from weak lensing observations. In the third step, if it was possible, we selected cases where the position of the back shock is near the eastern edge of the long radio relic to the east of the X-ray peak.
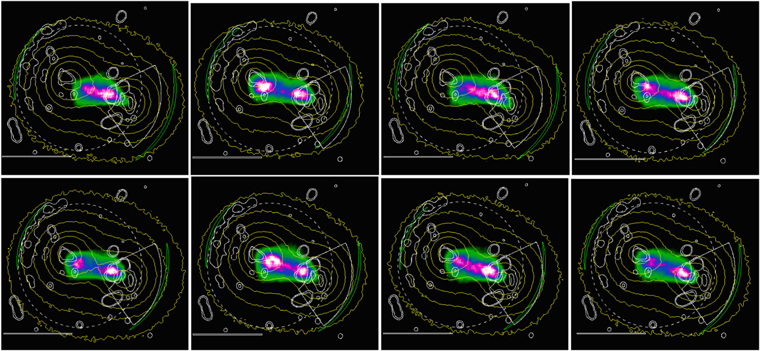
Figure 2. Samples of simulations that do not fully resemble the X-ray morphology of ZwCl008. The color code is the same as in the second panel in Figure 1. The parameters are those of the best model (run P400V18B), except those explicitly shown. Left to right, first row: the first and second panels show runs with P = 300 and 500 kpc (P300V18 and P500V18). The third and fourth panels show Vin = 1500 and 2000 km s−1 (P400V15 and P400V20). Second row: the first and second panels show cvir1,2 = 4, 4 (run P400C44) and Mvir1,2 = 6.5 ×  , 4.5 ×
  (run P400M8). The third and fourth panels display the best model (run P400V18B), but before and after the best epoch (412 Myr and 444 Myr after the first core passage). The best epoch is tobs = 428 Myr. See Table 1 for a list of initial parameters for the runs.
Download figure:
Standard image High-resolution imageIn each panel in the first row, the positions of the X-ray peak associated with the infalling cluster and the back shock match the observations. The first and second panels in the first row show runs with only the impact parameters changed to P = 300 and 500 kpc (runs P300V18 and P500V18) from the best model (run P400V18B with P = 400 kpc). The X-ray morphology of P300V18 (first panel) is elongated along the line connecting the two dark matter centers, but it has only one X-ray peak, no secondary peak. Run P500V18 displays two X-ray peaks with a large separation and very small offset from the dark matter centers, as well as the brightest X-ray peak associated with the main cluster. The third and fourth panels show simulations changing only the relative (infall) velocity of the infalling cluster to Vin = 1500 and 2000 km s−1 (runs P400V15 and P400V20) to bracket our best model with Vin = 1800 km s−1. The X-ray morphology in the third panel (Vin = 1500) is similar to that of the first panel, the brightest X-ray peak is associated with the main cluster, not to the infalling cluster as observed, and the fourth panel (Vin = 2000 km s−1) show two bright X-ray peaks.
The first and second panels in the second row display simulations changing only the concentration parameters to cvir1 = 4 and cvir2 = 4 (run P400C44), and the masses of the colliding clusters to Mvir1 = 6.5 ×  and Mvir2 =4.5 ×
  (run P400M8). The X-ray emission in these two panels show two bright X-ray peaks, again differing significantly with respect to the observed morphology. In the first panel, the X-ray peaks are well separated; in the second panel the main X-ray peak is associated with the main cluster and not with the infalling cluster. The third and fourth panels in the second row display our best model (run P40V018) but before and after the best epoch, at t1 = 412 Myr and t2 = 444 Myr after the first core passage. The best epoch is tobs = 428 Myr. The third panel in the second row shows only one X-ray peak and the back shock is closer to the peak than observed, the fourth panel shows an epoch when the back shock is too far from the X-ray peak, thus its position does not match that of the observed. See Table 1 for a list of initial parameters for the runs. Figure 2 demonstrates that changing the virial masses of the subclusters by ΔM = 5 ×
  , the concentration parameters by Δcvir = 1, the impact parameter by ΔP = 100 kpc, and the infall velocity by ΔVin = 300 km s−1 changes the X-ray morphology substantially, and the colliding systems do not resemble ZwCl008, giving a rough estimate of the errors in our derived parameters.
Sampling a larger parameter space initially, we found that values of the initial cluster masses, concentration parameters, infall velocities and impact parameters very different from those of our best model provide very different shock positions and X-ray morphology. The positions of the mass centers are less constraining. It is unlikely that, using the parameters we varied, we missed the "best model." This can be proved only with a densely sampled parameter space, which is beyond the scope of our paper.
We conclude from our suite of N-body/hydrodynamical simulations that ZwCl008 is viewed at about tobs = 428 Myr after first core passage, and that the infalling cluster has a mass Mvir2 ∼ 5  moving to the west with an impact parameter P ∼ 400 kpc and infall velocity of Vin ∼ 1800 km s−1, disrupting the gas of the main cluster with mass Mvir1 ∼ 7
  , so that it lies to the west of the main cluster at the observed epoch. Our best model also clearly confirms that the disrupted gas of the main cluster is offset from its dark matter center, as the observations seem to indicate. Our simulations clearly demonstrate that the merging cluster, ZwCl008, is in the outgoing phase just after the first core passage, before the first turnover. The gas and dark matter associated with the two components are moving outward (the infalling cluster moving to the east, the main cluster to the west; see fist and second panels in Figure 1).
These results are in broad qualitative agreement with the results of Golovich et al. (2017). However, our self-consistent simulations break the degeneracy between the outgoing phase after the first core passage and the infalling phase after the first turnover found by Golovich et al. and clearly prefer an epoch close to post-collision and exclude later ones, since by that time the shock fronts will have long left the system. Our best model has a somewhat larger total mass, 1.2 × 10¹⁵ M⊙, than the one derived by Golovich et al. using gravitational lensing, 
 (note we converted their M200 G,total to virial mass based on the scaling of Hu & Kravtsov 2003); however, these masses agree within 1σ. Golovich et al. (2017) also derived total mass estimates based on velocity dispersion measurements and X-ray temperature and luminosity scaling relations, which were smaller but within 1σ of the estimate based on lensing (M200,total = 6, 6.5, and
  respectively, versus
 ; see their Table 5). In their dynamical model, Golovich et al. adopted the masses they derived based on gravitational lensing as the more reliable value. However, our best model has a pericenter velocity of Vperictr = 3515 km s−1, which is much larger than the Vperictr,G = 1800 km s−1 derived by Golovich et al. (2017). This is partly due to the fact that our best model has a larger total mass than the one used by Golovich et al.
We performed a simulation, run P05V05G, with initial conditions suggested by Golovich et al. (2017). See Table 1 for the initial parameters of this run. We used Vin = 500 km s−1 to get the velocity at the pericenter within 1σ of the velocity quoted in Golovich et al. ( km s−1). Note that in the case of a small impact parameter, the infalling cluster reaches the deep potential well of the main cluster, acquiring higher velocities. We show the result in the third panel in Figure 1. There are two X-ray peaks, but the main X-ray peak is associated with the gas of the main cluster. The infalling cluster has a very faint X-ray peak, contrary to observations. The back shock has already left the cluster gas. We chose a projection, which provides a rough match to the positions of the two X-ray and dark matter peaks. Most of the gas of the infalling cluster has been stripped off as a result of the low mass of the infalling cluster and the relatively high velocity at pericenter (∼2000 km s−1; note that in the case of lower pericenter velocity, we found that the infalling cluster does not get as far from the main cluster as the gravitational lensing observations suggest). Golovich et al. (2017) assumed zero impact parameter, which would make it even easier to strip the gas from the infalling cluster. We chose a non-zero, but small, impact parameter since the observed X-ray morphology is not symmetric. We carried out simulations using the Golovich models but with different infall velocities and impact parameters (runs P200V10G and P400V16G) to check if using these models provide a better match with observations, but we found that they also do not resemble the observed features of ZwCl008.
X-ray observations measure a gas temperature weighted with emission in the LOS convolved with the response of the detectors, which we approximate with the spectroscopic temperature (Mazzotta et al. 2004). In Figure 3, we show the spectroscopic temperature, Tspec, of our best model (see, e.g., Molnar & Broadhurst 2017 for our method to derive Tspec from simulations) with contours of the X-ray emission overlaid. The X-ray peak is close to the center in a cooler region where the gas density is higher; the shocks are not visible in the observations (see the left panel of Figure 1). We obtain 6 keV for the X-ray emission dominating the high-density region (see Figure 3), which is somewhat higher than the observed global temperature, 4.9 ± 0.13 keV (Golovich et al. 2017).
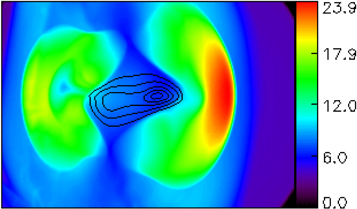
Figure 3. Spectroscopic temperature (Mazzotta et al. 2004) in keV of our best model with contours of the X-ray emission overlaid (the image size is 3.2 Mpc × 2.2 Mpc). The bow shock (west of the center) is delineated by the western edge of the high-temperature (red) region. The back shock is located at the eastern edge of the green region east of the center.
Download figure:
Standard image High-resolution imageWe derive the Mach numbers for the merging shocks based on our best model using the temperature jump at the shocks, as it is done using temperature based on X-ray observations. The Rankine–Hugoniot jump conditions provide the connection between the temperature jump, T2/T1, and the Mach number,

where T1 and T2 are the pre- and post-shock temperatures (e.g., Akamatsu et al. 2015; Molnar & Broadhurst 2017; for a review, see Markevitch & Vikhlinin 2007). Using the temperature jump from our simulations at the shocks in Equation (3), we obtain Mach numbers for the merging shocks directly from the physical (not the observed) temperature ratios (the bow shock and back shock to the west and east):  and
and  .
.
4.2. Biases in Mach Numbers Derived from Observations
Recently, Mach numbers significantly larger than X-ray measurements of some merging clusters were derived from radio observations (e.g., the Sausage cluster:  ,
,  , van Weeren et al. 2010, Stroe et al. 2013, and Akamatsu et al. 2015; RX J0603.3+4214, the "Toothbrush" cluster:
  ,
,  , van Weeren et al. 2016; A2255:
  ,
,  , Akamatsu et al. 2017; A3667:
  ,
,  , Sarazin et al. 2014).
Using our N-body/hydrodynamical simulations, we demonstrated that gas temperatures around shocks in merging clusters derived from X-ray observations may be much lower than physical temperatures depending on the viewing angle of the collision (Molnar & Broadhurst 2017). In Figure 4, we show the physical temperature and Tspec (solid and dashed lines) along a cut through the center of the X-ray peak based on our best model for ZwCl008. Using Equation (3) with the values of Tspec at the shocks, we estimate the Mach numbers that would be derived from X-ray observations:  and
and  . Interestingly, these Mach numbers for the shocks in ZwCl008 we derived assuming X-ray observations based on our N-body/hydrodynamical simulations using spectroscopic temperatures are close to those derived from radio observations assuming a linear diffusive shock acceleration (DSA) mechanism,
  –2.4 (van Weeren et al. 2011b; Kierdorf et al. 2017).
We have found a similar discrepancy modeling the northern shock in the Sausage cluster using N-body/hydrodynamical simulations (Molnar & Broadhurst 2017). The Mach numbers we derived for this shock based on our simulations using physical and spectroscopic temperatures were  and
and  . Radio and X-ray observations of this shock suggested
  (assuming a linear DSA mechanism) and
  (van Weeren et al. 2010; Stroe et al. 2013; Akamatsu et al. 2015). The
  we derived for this shock is within 1.5σ of the Mach number derived from these radio observations.
Our hydrodynamical simulations of merging clusters (ZwCl008, the Sausage cluster) suggest that Mach numbers of merging shocks based on X-ray observations can be significantly underestimated due to projection effects. Other explanations for this Mach number discrepancy are based on using more complicated particle acceleration models than the linear DSA. Analyzing the radio observations of the Toothbrush cluster, van Weeren et al. (2016) suggested that either the shock has a complex morphology in the LOS or the radio emission is due to a reaccelerated population of electrons. Van Weeren et al. conclude that more theoretical work is necessary to understand the acceleration and reacceleration processes in merger shocks.
Stroe et al. (2014), analyzing radio observations of the northern relic in the Sausage cluster, used different spectral aging models to address the discrepancy between Mach numbers derived from radio and X-ray observations of the shock. For the northern shock, they derived  , which is consistent with the Mach number derived from X-ray observations. However, as they noted, their solution has an aging problem: the aging of the accelerated high-energy electrons derived from the shock speed is not compatible with the aging derived from the radio spectrum data. Stroe et al. concluded that the models they investigated have difficulties in explaining all of the observations. Recently, Hoang et al. (2017) carried out deep radio observations of the Sausage cluster. Assuming linear DSA, they derived
  for the northern shock. They concluded that high acceleration efficiency is necessary to explain the radio observations, which is problematic for the DSA mechanism.
However, using time-dependent DSA simulations, Kang et al. (2012, 2017) showed that both larger and smaller Mach numbers derived from radio and X-ray observations can be explained. Kang et al. (2012) carried out time-dependent DSA simulations and found that models with and without preexisting cosmic-ray electrons can explain the radio observations of the northern shock in the Sausage cluster providing Mach numbers  and
and  , respectively. Recently, Kang et al. (2017) performed time-dependent DSA simulations including radiative cooling and post-shock turbulent acceleration to explain the different Mach numbers derived for the shock in the Toothbrush cluster based on radio and X-ray observations. Kang et al. derived synchrotron emission from the accelerated electrons based on a model for low Mach numbers,
  , which includes a preexisting population of cosmic-ray electrons assuming a flat energy spectrum, and a model for larger Mach numbers,
  , which assumes either shock-generated suprathermal electrons or preexisting cosmic-ray electrons. They found that both models can explain reasonably well the observed integrated radio spectrum of the northern relic in the Toothbrush cluster. However, they prefer their model for the higher Mach number, because explaining the lower Mach number with a uniform population of preexisting cosmic-ray electrons with a high cutoff energy (≥40 GeV) on a large scale of 400 kpc would be difficult, due to the short cooling time of those electrons.
4.3. Outgoing Merging Shocks in ZwCl008
The properties of merging shocks were studied in detail by making use of N-body/hydrodynamical simulations (e.g., Ha et al. 2018; Molnar & Broadhurst 2017). In this section, we study the evolution of merging shocks as a function of time around the first core passage before the first turnover using our best solution for ZwCl008 as an example.

Figure 4. Temperature, T (in keV), of our best model as a function of distance from the center, D (in Mpc), along a cut through the maximum X-ray emission. The bow shock is at D ≈ 1 Mpc. The solid and dashed lines are showing cuts using the physical temperature taken from our simulation directly and the spectroscopic temperature after the rotation to match the observations (see Figure 3 for the spectroscopic temperature map).
Download figure:
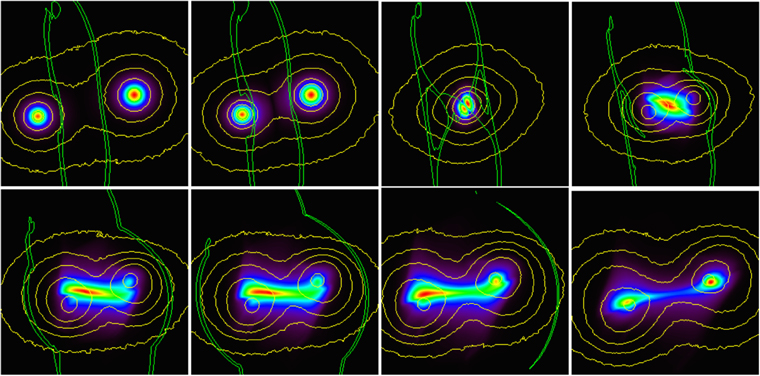
Standard image High-resolution imageThe evolution of merging shocks is illustrated in Figure 5. The panels in this figure show a color image of the X-ray emission with contours of the dark matter distribution (yellow) and the merging shocks (green) superimposed. We used a projection along the z-axis, i.e., we assumed that z coincides with the LOS, and the collision takes place in the plane of the sky (x, y plane). The infalling cluster passes the main cluster center from below, moving east to west (second panel in the first row; run P40V18). The time is measured in Myr relative to the first core passage (t0 = 0 Myr; left to right, first row: t = −475, −317, 0, and 238 Myr; second row: t = 396, 459, 555, and 713 Myr).
Figure 5. Merging shocks and the distribution of the mass surface density of dark matter (green and yellow contours) overlaid on the X-ray emission (color image) as a function of time before and after the first core passage based on our model P400V18C68 (see Table 1). We assumed that the collision occurs in the plane of the sky (projections in the LOS). The panels are 3 Mpc on a side. Left to right in the first and second rows, the epochs (relative to the first core passage; t0 = 0) are t = −475, −317, 0, 238, and t = 396, 459, 555, 713 Myr, respectively. The infalling cluster passes the main cluster from below, moving east to west. Panels in the first row: the first two panels show epochs before the first core passage. The third panel represents the epoch of the first core passage. The two dark matter peaks overlap at the center, and the two X-ray peaks mark the centers of the gas. The fourth panel shows a phase right after the first core passage. Panels in the second row show phases of the collision when there are two X-ray peaks. The first two panels show two shocks ahead of the cluster centers moving outwards. The third panel shows the phase when the back shock has already left the gas of the infalling cluster. The bow shock is still moving outward (toward the west). The fourth panel shows a later epoch, when both shocks have left the gas of the merging system, and the gas is falling back to the cores of the dark matters of the two components.
Download figure:
Standard image High-resolution image
The first two panels in the first row show the epochs before the first core passage, when only the outer regions of the gas in the two clusters take part in the collision. The shocks, generated in the same direction as the respective dark matter (the shock on the east moves to the west, the shock on the west moves to the east), move ahead of the two clusters. The third panel represents the epoch of the first core passage. The two dark matter peaks overlap at the center; they are slightly ahead of the X-ray peaks. The structure of the merging shocks change; multiple shocks are generated due to the collision of the denser gas in the merging clusters. The fourth panel shows the phase right after the first core passage, when there is only one X-ray peak, and the bow shock in the gas west of the main cluster is moving to the west ahead of the infalling cluster. The back shock in the east propagates to the east in the gas of the infalling cluster. Panels in the second row show phases after the first core passage, when there are two X-ray peaks. The first two panels show two shocks ahead of the cluster centers moving outward. The third panel shows the phase when the back shock has already left the gas of the infalling cluster. The bow shock is still moving outward (toward west). The fourth panel shows a later epoch, when both shocks have left the gas of the merging system, and the gas is falling back to the cores of the dark matter of the two components.
We study these outgoing merging shocks in detail because of their importance in determining the dynamical state of the merging cluster and the phase of the collision. The phase of the collision is important for particle acceleration models, because the physical properties of the shock depend on it, and these properties have a large impact on particle acceleration (e.g., Stroe et al. 2014; Fujita et al. 2016; Kang & Ryu 2016), as well as testing cosmological models (e.g., Molnar 2015).
The reason why the outgoing shocks constrain well the phase of the collision right after the first core passage in the outgoing phase is that they move fast and leave the gas as they propagate with high speed in the low-density gas at the outskirts of the system. Because of these relatively high outer shock speeds, these shocks can (re)accelerate particles and generate luminous radio relics for a limited time. As a consequence, shocks and bright relics can only be expected to be detected in a pair of merging clusters relatively soon after the first core passage, before the first turnaround, after which the relics become fainter without a shock to provide additional energy.
In general, as we see here, if the observed shocks were to lie in between the two X-ray peaks associated with relaxed cluster centers, we would conclude that the merging system is being viewed before the first core passage, as shown in the first panel of Figure 5, such as in the case of, e.g., Abell 1750 (Molnar et al. 2013a). A disturbed X-ray morphology, displaying one or two X-ray peaks within one or two shocks, instead suggests a system caught after first core passage (e.g., Mastropietro & Burkert 2008; Molnar & Broadhurst 2015).
Figure 5 also illustrates how fast the outgoing shocks propagate in a merging cluster similar to ZwCl008. After ∼500 Myr, both the bow shock and the back shock propagating in the gas of the main and the infalling cluster have left the system (panel 4 in Figure 5). The velocity of the bow shock relative to the ambient gas (the shock on the west moving west) is 4500 km s−1; the back shock propagates faster (to the east) with 4900 km s−1. At these speeds, the merging shocks (bow and back shocks) would have left the gas 470 and 380 Myr after the first core passage, but our numerical simulations suggest that they leave after 618 and 522 Myr. The turnover occurs 1.5 Gyr after the first core passage; thus, well before the turnover, both merger shocks leave the system. This is a general feature of merging shocks in most colliding clusters with moderate mass ratios and infall velocities  km s−1.
4.4. Comparing ZwCl008 to the Bullet Cluster
ZwCl008 has been suggested to be an older, less massive version of the Bullet Cluster (Golovich et al. 2017), where the less massive infalling cluster has pushed the gas of the main cluster out of equilibrium, and as a result, the X-ray morphology, which traces the gas of the main cluster, is irregular (X-ray feature in the east in the first panel of Figure 1). However, our hydrodynamical simulations suggest that the cometary-like X-ray peak in ZwCl008 near the center of mass of the smaller western cluster (see the first panel of Figure 1) marks the gas density maximum of the infalling cluster, similar to El Gordo (Molnar & Broadhurst 2015) and unlike the Bullet Cluster, in which the wedge-shaped bright X-ray feature marks a contact discontinuity. The shock in the Bullet Cluster is a faint X-ray feature ahead of the merging shock to the west (e.g., Markevitch & Vikhlinin 2007). Based on our best model, ZwCl008 is only 428 Myr past the first core passage and in a much earlier phase than the turnover, 1.5 Gyr, like the Bullet Cluster.
Our results suggest instead that, because of a larger impact parameter for the collision in ZwCl008 and the lower infall velocity relative to the Bullet Cluster, the ram pressure cannot fully hold back the gas relative to the dark matter in the infalling cluster, as opposed to the case of the Bullet Cluster. Instead, the infalling cluster in ZwCl008 passes relatively unhindered through the gas of the main cluster since it does not penetrate through the dense central gas of the main cluster.
5. Conclusions
We have performed a set of self-consistent N-body/hydrodynamical simulations based on FLASH, a publicly available AMR code, to augment our existing library of binary cluster encounters generated in our previous work in order to study the particular dynamics during the collision of the merging cluster ZwCl008. We have modeled ZwCl008 as a binary merger, constraining the initial parameters using gravitational lensing, X-ray morphology, and observations of radio relics. Unfortunately, the merger shock positions cannot be determined from the Chandra observations without longer X-ray exposures. Therefore, we refer to the positions of the pair of opposing distinctively polarized radio relics, which we can assume to have resulted from the two predicted outgoing shocks, and use a simple geometrical argument (see Section 4.1) to limit the current shock locations. The detailed X-ray morphology and the locations of the two lensing centroids were used to constrain the masses and concentration parameters of the colliding clusters, the infall velocity, the impact parameter, as well as the viewing angle.
We have demonstrated that the outgoing shocks travel fast (4000–5000 km s−1) in the low-density outer gas of the two subclusters, and therefore, their positions relative to those of the mass peaks can be used to accurately derive the phase of the collision. Thus, merging shocks can (re)accelerate particles and generate relics only for a limited time,  , and hence shocks and bright relics can be detected in a merging system soon after the first core passage, before the first turnaround. After that time, the relics become fainter after no shocks feed them as the electrons lose energy. This point has been unappreciated in earlier works (Ng et al. 2015; Golovich et al. 2017), where later stage merging has been entertained without the guidance of hydrodynamical simulations like those presented in this paper.
Based on our N-body/hydrodynamical simulations, we derived virial masses Mvir1 ∼ 7 and Mvir2 ∼ 5
  , an impact parameter of P ∼ 400 kpc, an infall velocity of Vin ∼ 1800 km s−1, and concentration parameters of cvir1 ∼ 5 and cvir2 ∼ 5 for the main and infalling cluster, respectively. We found that ZwCl008 is observed about 430 Myr after the first core passage. Our best model suggests that the bow shock is farther ahead than the relics we associate with it. Deep X-ray observations carried out with the Chandra observatory could be used to test this prediction. If future X-ray observations find that the bow shock is closer to the leading edge of the western relic, our best model would have to be modified. A search should be carried out extending the parameter space and, perhaps, more complicated physics should be taken into account (e.g., magnetic fields, viscosity).
Our numerical simulations represent the first attempt to model the newly discovered Bullet-Cluster-like merging system ZwCl008 using self-consistent N-body/hydrodynamical simulations. Previously, ZwCl008 was modeled by Golovich et al. (2017) using their method based on a model assuming fixed NFW profiles for the dark matter distribution for the merging subclusters assuming zero impact parameter and ignoring the gas components (Dawson 2013). However, their simplified dynamical model cannot distinguish between the outgoing phase soon after the first core passage and the returning phase after the first turnaround. Our self-consistent simulations break this degeneracy and clearly demonstrate that ZwCl008 is currently in the outgoing phase, before the first turnover, otherwise the bow shock and the back shock fronts would have long departed the system to the east and west.
Our full self-consistent simulation containing dark matter and gas can constrain the impact parameter, the phase of the collision, and the viewing angle with the location of the merging shocks and provide both a check on the apparent interpretation of this system as a binary encounter and reliable estimates of the basic masses, velocities, and the age and orientation of the system.
We thank the referee for detailed and constructive comments. The code FLASH used in this work was in part developed by the DOE-supported ASC/Alliance Center for Astrophysical Thermonuclear Flashes at the University of Chicago. We thank the Theoretical Institute for Advanced Research in Astrophysics, Academia Sinica, for allowing us to use its high-performance computer facility to carry out our simulations.