


Abstract
The role of feedback in triggering or quenching star formation and hence driving galaxy evolution can be directly studied with high-resolution integral field observations. The manifestation of feedback in shocks is particularly important to examine in galaxy mergers, where violent interactions of gas take place in the interstellar medium during the course of the galactic collision. As part of our effort to systematically study the local population of luminous infrared galaxies within the Great Observatories All-Sky LIRG Survey, we undertook the Keck OSIRIS AO LIRG Analysis observing campaign to study the gas dynamics in the inner kiloparsec regions of these systems at spatial scales of a few tens of pc. With high-resolution near-infrared adaptive optics–assisted integral field observations taken with OSIRIS on the Keck Telescopes, we employ near-infrared diagnostics such as Brγ and the rovibrationally excited H2 lines to quantify the nuclear star formation rate and identify feedback associated with shocked molecular gas seen in 21 nearby luminous infrared galaxies. Shocked molecular gas is preferentially found in the ultraluminous infrared systems but may also be triggered at a lower-luminosity, earlier merging stage. On circumnuclear scales, AGNs have a strong effect on heating the surrounding molecular gas, though their coupling is not simply driven by AGN strength but rather is complicated by orientation, dust shielding, density, and other factors. We find that nuclear star formation correlates with merger class and diminishing projected nuclear separations. These trends are largely consistent with the picture of merger-induced starbursts in the center of galaxy mergers.
Export citation and abstract BibTeX RIS
1. Introduction
A principal process that regulates the stellar content of a galaxy and drives its evolution is energetic feedback from stars, supernovae, and accreting supermassive black holes. Feedback injects energy and momentum into a galaxy's interstellar medium (ISM) and can drive powerful winds from the nucleus to galactic scales. These winds play a key role in the chemical evolution of galaxies through metal enrichment, metal redistribution, and the suppression or enhancement of star formation throughout the galaxy.
Galactic outflows are prevalent in (ultra-)luminous infrared galaxies ((U)LIRGs), which in the local universe (z < 0.08) are mostly galaxy mergers (Armus et al. 1987; Sanders et al. 1988; Larson et al. 2016). Mergers funnel gas to the central black hole or nuclear starburst, which in turn transfers momentum to the surrounding dense gas and potentially drives an outflow. This phenomenon has been seen both in simulations (Mihos & Hernquist 1994; Springel & Hernquist 2003; Hopkins et al. 2005; Narayanan et al. 2006, 2008; Torrey et al. 2012; Muratov et al. 2015; Nims et al. 2015) and in observations (Heckman et al. 1990; van der Werf et al. 1993; Veilleux et al. 1995, 2005, 2013; Moran et al. 1999; Rupke et al. 2002; Martin 2006; Dasyra et al. 2011; Dasyra & Combes 2011; Rich et al. 2011, 2015; Rupke & Veilleux 2011, 2013; Soto et al. 2012; Spoon et al. 2013; Arribas et al. 2014).
Because feedback usually manifests itself in terms of high fractions of shocked and/or outflowing atomic gas, unusual optical and infrared emission line ratios, blueshifted and redshifted emission lines, and broad emission lines signaling turbulent gas are pivotal detection tools. For instance, optical emission-line ratios provide a critical diagnostic that illuminates the excitation and ionization conditions, e.g., through the use of [O iii], Hβ, [S ii], Hα, [N ii], and [O i] for distinguishing active galactic nuclei (AGNs) from starbursts with the so-called "BPT/VO87 diagrams" (Baldwin et al. 1981; Veilleux & Osterbrock 1987; Kewley et al. 2001; Yuan et al. 2010). The interpretation of these optical line ratios in the context of photoioniziation and radiative shocks is further facilitated by self-consistent codes such as MAPPINGS III (e.g., Allen et al. 2008) and others (Farage et al. 2010; Monreal-Ibero et al. 2010; Rich et al. 2010, 2011). However, such optical-based tools encounter challenges at the physical and technical levels; i.e., shocks and photoionization from the AGN are difficult to differentiate using optical ratios alone, and these emission lines may suffer high levels of dust attenuation ( ; Piqueras López et al. 2013; Stierwalt et al. 2013), particularly in the nuclei of (U)LIRGs. It is nontrivial to investigate the contribution of shocks to the total energy budget of the feedback when the optical line ratios are muddled by mixtures of shocks, starbursts, AGNs, and clumpy dust.
The mid-infrared counterparts of these AGNs and star formation tracers include high excitation lines like H2, [Ne v], or [O iv] and polycyclic aromatic hydrocarbons (PAHs) or unidentified infrared bands (UIBs; Genzel et al. 1998; Laurent et al. 2000; Armus et al. 2007, 2009; Spoon et al. 2007; Groves et al. 2008; Dale et al. 2009; Petric et al. 2011; Alonso-Herrero et al. 2012; Stierwalt et al. 2014). However, most mid-infrared and ground-based seeing-limited observations are hampered by a lack of high angular resolution, which is needed to resolve the regions from which winds originate because they are often complex and involve multiple ionization sources.
In the near-infrared, using line diagnostics for studying the ISM excitation and ionization has been challenging. Theoretical models that integrate the complexities of molecular physics to radiative transfer have been limited. Nonetheless, empirical studies have produced BPT-like diagnostic diagrams in order to assess the excitation and ionization conditions of the gas. Since iron in the ISM is highly depleted onto grains, strong [Fe ii] emission in the near-infrared is often associated with shock-excited gas (Larkin et al. 1998; Rodríguez-Ardila et al. 2004, 2005; Riffel et al. 2006, 2013) where the grains have been processed by winds, supernovae, or other sources. Line ratios such as [Fe ii] (1.26 μm)/Paβ and H2 1−0 S(1)/Brγ are thus helpful in differentiating between starbursts, AGNs, low-ionization nuclear emission-line regions (LINERs), and Seyferts.
In many systems, multiple mechanisms may contribute to the ISM conditions to different degrees, and integral field spectroscopy (IFS) with high angular resolution is crucial to distinguish them. The integrated measurements from large apertures or coarse-resolution observations tend to blend signals from interesting starburst, AGN, and shocked regions, presenting a median measurement representative of the general excitation and ionization conditions of the diffuse ISM in these LIRGs. Differences between line ratios measured from integrated versus spatially resolved regions may be as large as a factor of two in the case of LIRGs (Colina et al. 2015). In order to discern the true underlying contribution from the ionizing sources, we need to look into the near-infrared with adaptive optics (AO)–assisted IFS for a higher-resolution view of the central gas properties. Near-infrared studies at high spatial resolution form the basis for our understanding of the mechanisms powering emission lines in dusty ULIRGs (U et al. 2013; Medling et al. 2015b) and will pave the way for the upcoming James Webb Space Telescope (JWST) era.
Here, as part of the Keck OSIRIS AO LIRG Analysis (KOALA) Survey,23 we present the warm molecular and atomic gas dynamics in the nuclear regions of 21 nearby (U)LIRG systems (22 nuclei), approximately 40% of the local (U)LIRGs suitable to observe with the current Keck AO system due to limitations on the availability of tip-tilt stars. The larger campaign and early results have been introduced in our previous work. In Medling et al. (2014, hereafter Paper I), we presented the gas and stellar morphology and kinematics and characterized the properties of the nuclear disks that were found to be nearly ubiquitous in these (U)LIRGs. Medling et al. (2015a, hereafter Paper II) built upon these nuclear disks, computed the dynamical masses for the central supermassive black holes, and found that late-stage mergers have central masses that are overmassive relative to the MBH−σ⋆ relation of normal galaxies. Here we present our search for outflows and the effects of feedback in the nuclei of the galaxies in the KOALA survey.
This paper is organized as follows. Section 2 describes the subsample from our larger Keck campaign analyzed for gas properties, as well as an overview of the acquisition and processing of Keck OH-Suppressing Infra-Red Imaging Spectrograph (OSIRIS) data presented here. Section 3 describes the line-fitting analysis, while Section 4 presents the resulting emission-line maps and line ratio analysis. Various diagnostics using these near-infrared emission lines to discern ionization sources and excitation mechanisms are subsequently discussed in Section 5. Our summary is presented in Section 6. The kinematics of the gas will be presented in a forthcoming paper. Throughout the paper, we have adopted H0 = 70 km s−1 Mpc−1, Ωm = 0.28, and ΩΛ = 0.72 (Hinshaw et al. 2009).
2. Data
2.1. The KOALA-GOALS Survey
The Great Observatories All-sky LIRGs Survey (GOALS; Armus et al. 2009) consists of 201 of the brightest and closest (U)LIRGs in the local universe, a complete subset of the flux-limited IRAS Revised Bright Galaxy Sample (f60 μm > 5.24 Jy and galactic latitude  ; Sanders et al. 2003). The survey incorporates a wealth of ancillary data spanning the entire electromagnetic spectrum from Chandra X-ray to the Very Large Array radio regime. Our near-infrared Keck sample is limited to selecting from among the most luminous (
 ) 88 objects with coverage by HST-ACS observations that have suitable guide stars for the AO system. The HST-ACS criterion ensures that we have high spatial resolution (0
 05) images with precision astrometry for planning the AO observations, which is critical given the small field of view (FOV) of OSIRIS. At the distance of our sample (z < 0.08, though mostly z < 0.05), we resolve the inner kiloparsec region of each source with ∼20–80 pc per resolution element.
Incorporating observing feasibility (e.g., observable from Maunakea and with available guide stars that fulfill the tip-tilt requirements of the Keck LGS/NGS AO systems; Wizinowich et al. 2000, 2006; van Dam et al. 2006), approximately half the HST-GOALS sample may be followed up with the Keck AO system. Since one of our program's goals is to trace feedback properties along the merging sequence, our observing priorities took into account the merger classification scheme for the GOALS sample as adopted from Haan et al. (2011) and Kim et al. (2013): (0) a single galaxy with no obvious major merging companion, (1) separate galaxies with symmetric disks and no tidal tails, (2) distinguishable progenitor galaxies with asymmetric disks and/or tidal tails, (3) two distinct nuclei engulfed in a common envelope within the merger body, (4) double nuclei with visible tidal tails, (5) a single or obscured nucleus with prominent tails, and (6) a single or obscured nucleus but with disturbed morphology and short faint tails signifying a postmerger remnant.
We initially prioritized late-stage mergers with one nucleus or two close nuclei on the verge of coalescence (Papers I and II). Our campaign has since been extended to include systems at earlier stages of merging that tend to be at lower luminosities and thus more closely resemble normal star-forming galaxies in other nearby studies (e.g., Kennicutt et al. 2003). Our current study comprises 21 interacting systems (22 nuclei; see Table 1) for which K-band data targeting atomic and molecular hydrogen transitions have been gathered. Comparisons of our current KOALA sample with the entire HST-GOALS sample in infrared luminosity and merger stage are shown in Figure 1. The KOALA sample as presented here is not yet complete with respect to the limitations imposed by the Keck AO system requirements. However, it has achieved a representative range in LIR and merger stage relative to the HST-GOALS sample, which is complete in infrared luminosity within GOALS down to  .
.
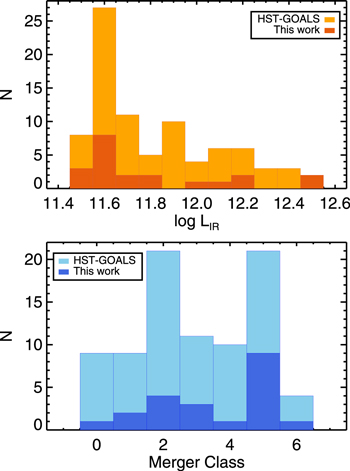
Figure 1. Distributions in infrared luminosity (top) and merger class (bottom) for the HST-GOALS sample (light orange, light blue) and the galaxy systems in this work (dark orange, dark blue). See the description for the merger classification scheme in the text. Only approximately half of the HST-GOALS sources may be observed with Keck AO. The existing KOALA sample is not yet complete with regard to the observing limitations within the HST-GOALS sample, but it spans a representative range.
Download figure:
Standard image High-resolution imageTable 1. Keck OSIRIS Observations
| Galaxy Name | R.A. | Decl. | log LIR | Redshift | Physical Scale | Filter | Plate Scale | FOV | Obs. Date | texp | PA |
|---|---|---|---|---|---|---|---|---|---|---|---|
| (J2000) | (J2000) | (L⊙) | (kpc arcsec–1) | (mas) | (arcsec2) | (YYYYMMDD) | (minutes) | (deg) | |||
| (1) | (2) | (3) | (4) | (5) | (6) | (7) | (8) | (9) | (10) | (11) | (12) |
| UGC 08058/Mrk 231 | 12:56:14.231 | 56:52:25.250 | 12.53 | 0.0433 | 0.856 | Kbb | 35 | 0.56 × 2.24 | 20110523 | 36 | 45 |
| IRAS F17207−0014 | 17:23:22.010 | −00:17:00.200 | 12.46a | 0.0432 | 0.878 | Kcb | 100 | 1.6 × 6.4 | 20110523-24 | 60 | 0 |
| UGC 08696/Mrk 273 | 13:44:42.140 | 55:53:13.700 | 12.18 | 0.0380 | 0.775 | Kbb | 100 | 1.6 × 6.4 | 20110522 | 50 | 0 |
| IRAS F22491−1808 | 22:51:49.220 | −17:52:23.400 | 12.19 | 0.0781 | 1.467 | Kcb | 100 | 1.6 × 6.4 | 20101114 | 20 | 150 |
| IRAS F15250+3608 | 15:26:59.443 | 35:58:37.010 | 12.07 | 0.0563 | 1.103 | Kbb | 50 | 0.8 × 3.2 | 20110523 | 80 | 120 |
| UGC 05101 | 09:35:51.611 | 61:21:11.600 | 12.00 | 0.0390 | 0.793 | Kcb | 100 | 1.6 × 6.4 | 20101114 | 40 | 70 |
| VV 340a | 14:57:00.701 | 24:37:02.220 | 11.79 | 0.0344 | 0.710 | Kcb | 100 | 1.6 × 6.4 | 20130518 | 20 | 185 |
| IRAS F01364−1042 | 01:38:52.882 | −10:27:11.480 | 11.79 | 0.0490 | 0.930 | Kcb | 100 | 1.6 × 6.4 | 20101113-14 | 100 | 30 |
| Kbb | 35 | 0.56 × 2.24 | 20121001 | 20 | 30 | ||||||
| UGC 08387 | 13:20:35.350 | 34:08:21.750 | 11.72 | 0.0239 | 0.507 | Kcb | 100 | 1.6 × 6.4 | 20130518 | 30 | 140 |
| CGCG 436–030 | 01:20:02.634 | 14:21:42.260 | 11.68 | 0.0315 | 0.610 | Kbb | 35 | 0.56 × 2.24 | 20120930 | 30 | 0 |
| NGC 6670E | 18:33:37.617 | 59:53:23.280 | 11.65a | 0.0291 | 0.592 | Kbb | 35 | 0.56 × 2.24 | 20140719 | 60 | 280 |
| IRAS F06076−2139N | 06:09:45.800 | −21:40:23.640 | 11.65a | 0.0374 | 0.742 | Kbb | 35 | 0.56 × 2.24 | 20141112 | 40 | −10 |
| IRAS F18090+0130E | 18:11:38.380 | 01:31:39.820 | 11.65a | 0.0286 | 0.611 | Kbb | 35 | 0.56 × 2.24 | 20150529 | 60 | 20 |
| IRAS F18090+0130W | 18:11:33.367 | 01:31:42.370 | 11.65a | 0.0292 | 0.611 | Kbb | 35 | 0.56 × 2.24 | 20150529 | 80 | 110 |
| III Zw 035 | 01:44:30.537 | 17:06:08.900 | 11.62 | 0.0278 | 0.547 | Kcb | 100 | 1.6 × 6.4 | 20110110 | 20 | 90 |
| Kbb | 35 | 0.56 × 2.24 | 20111210 | 100 | 38 | ||||||
| IRAS F20351+2521 | 20:37:17.743 | 25:31:37.750 | 11.61a | 0.0344 | 0.683 | Kcb | 100 | 1.6 × 6.4 | 20110522 | 40 | 0 |
| NGC 2623 | 08:38:24.087 | 25:45:16.590 | 11.58 | 0.0196 | 0.393 | Kcb | 100 | 1.6 × 6.4 | 20110110 | 50 | −50 |
| NGC 7469N | 23:03:17.985 | 08:53:37.750 | 11.58 | 0.0163 | 0.332 | Kbb | 35 | 0.56 × 2.24 | 20141112 | 80 | 130 |
| NGC 6090 | 16:11:40.865 | 52:27:27.640 | 11.55 | 0.0303 | 0.626 | Kcb | 100 | 1.6 × 6.4 | 20110524 | 20 | 150 |
| NGC 7674W | 23:27:56.726 | 08:46:44.660 | 11.51 | 0.0289 | 0.574 | Kbb | 35 | 0.56 × 2.24 | 20141112 | 50 | 110 |
| IRAS F03359+1523 | 03:38:47.070 | 15:32:53.740 | 11.51 | 0.0365 | 0.690 | Kcb | 100 | 1.6 × 6.4 | 20101114 | 60 | 75 |
| Kbb | 35 | 0.56 × 2.24 | 20141112 | 60 | 75 | ||||||
| MCG +08−11−002 | 05:40:43.783 | 49:41:42.150 | 11.46a | 0.0195 | 0.391 | Kcb | 100 | 1.6 × 6.4 | 20120102 | 50 | 70 |
| Kbb | 35 | 0.56 × 2.24 | 20120102 | 90 | 70 |
Notes. Column 1: galaxy name, following the naming convention of the Revised Bright Galaxy Sample (Sanders et al. 2003). Columns 2 and 3: precise R.A. and decl. locations for OSIRIS pointing. Column 4: logarithmic infrared luminosity defined as log LIR [8–1000 μm], as adopted from U et al. (2012) and aArmus et al. (2009). Column 5: redshift from fitting emission lines. Column 6: physical scale in kpc arcsec–1. Column 7: OSIRIS K broad- or narrowband filter used. Column 8: plate scale in milliarcseconds. Column 9: FOV in arcsec2. Column 10: observation dates. Column 11: total exposure time on target in minutes. Column 12: position angle of OSIRIS FOV.
Download table as: ASCIITypeset image
2.2. Observations and Data Processing
The observations were taken with OSIRIS (Larkin et al. 2006) on the Keck II and Keck I telescopes before and after 2012 January 3, respectively. The weather conditions varied from run to run but were sufficiently good (with typical FWHM ∼ 006 estimated from imaging the tip-tilt star). We employed AO corrections with both natural and laser guide stars, the tip-tilt requirements for which are R magnitude <15.5 and separation r < 35'' and R magnitude <18.5 and r < 65'', respectively.
For this study, we focused on the observations obtained with the broad K-band filter "Kbb" (and "Kcb," which has identical spectral specifications as "Kbb" but with a pupil paired to the 100 mas plate scale) covering wavelengths 1965 nm < λ < 2381 nm with spectral resolution R ∼ 3800. This wavelength range enables us to primarily target the molecular hydrogen rovibrational transitions and atomic hydrogen recombination lines as tracers for shock excitation and star formation, respectively. Our choice of observing mode, balancing the size of the FOV and the angular resolution, depended upon each target's redshift and spatial features. The FOV is 056 × 224 for the 35 mas plate scale, 08 × 32 for the 50 mas plate scale, and 16 × 64 for the 100 mas plate scale. We aimed to center the observations at our best guess of the kinematic nucleus or nuclei based on high-resolution HST-ACS F435W and F814W observations (Kim et al. 2013, A. Evans et al. 2019, in preparation) aligned at the position angles that would best capture multiple nuclear star clusters and/or the kinematics of the nuclear region (see Paper I for both the gaseous and stellar distributions). Standard A0V stars were imaged throughout the observing runs for telluric corrections. A summary of the observation details for the individual galaxy systems can be found in Table 1.
Most of the data sets were processed using the standard OSIRIS pipeline (Krabbe et al. 2004) that incorporates dark-frame subtraction, channel level adjustment, cross-talk removal, glitch identification, cosmic-ray cleaning, data-cube assembly, dispersion correction, scaled sky subtraction for enhanced OH-line suppression, and telluric correction. The extracted spectra were subsequently processed to remove bad pixels. More details regarding the reduction process for specific galaxy systems may be found in U et al. (2013), Medling et al. (2015b), Davies et al. (2016), Paper I, and Paper II.
3. Emission-line Fitting and Continuum Extraction
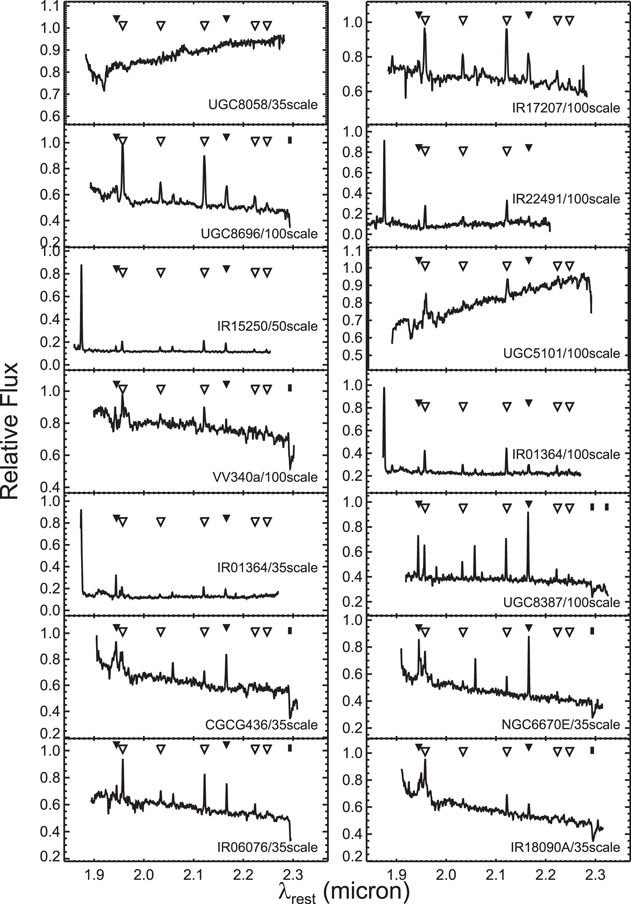
We have detected five rovibrational transitions of H2 observable within the OSIRIS K broadband filter with varying signal-to-noise ratios (S/Ns) in all of our galaxies: 1−0 S(3) (λrest = 1.9576 μm), 1−0 S(2) (λrest = 2.0338 μm), 1−0 S(1) ( = 2.1218 μm), 1−0 S(0) (λrest = 2.2235 μm), and 2−1 S(1) (λrest = 2.2477 μm). In addition, our typical K broadband spectrum also features Brγ (λrest = 2.166 μm) and Brδ (λrest = 1.945 μm) lines, the ratio of which provides a measure of the dust extinction in the region. The median line fluxes and ratios for these H2 and Brackett line transitions within the OSIRIS FOV are compiled in Table 2. The He i (λrest = 2.059 μm) and [Si vi] (λrest = 1.965 μm) lines are also within our spectral coverage and will be presented in a forthcoming paper. The entire suite of integrated 1D spectra for our sample is presented in Figure 2, featuring a variety of continuum levels and line ratios of the aforementioned emission lines. From our IFS data cubes, we map the morphology and kinematics of these emission lines with the line-fitting method presented in U et al. (2013) and Paper I. Our method can be summarized as follows.
Download figure:
Standard image High-resolution image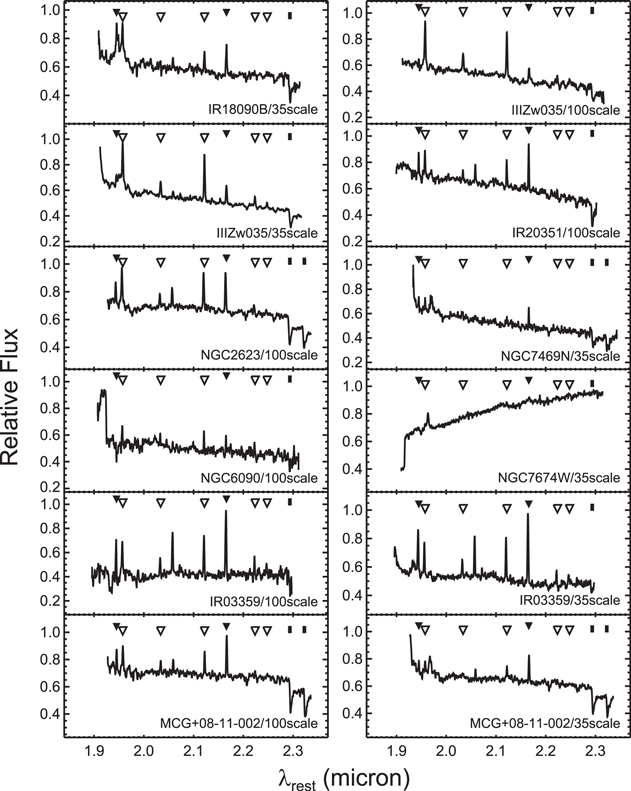
Figure 2. The 1D K broadband spectrum averaged over the nuclear region for all of the galaxies in this sample. The spectra are normalized to a common scale for better presentation of the various emission and absorption features. The open triangles mark the five H2 transitions, the filled triangles mark the two Br transitions, and the filled bars mark the CO absorption bandheads. Not marked on the plots are Paα (λrest = 1.875 μm), He i (λrest = 2.059 μm), and [Si vi] (λrest = 1.964 μm). The sample exhibits a variety of continuum slopes, including the positive slopes typical of strong Seyfert cases. Object names and observed plate scales are labeled accordingly.
Download figure:
Standard image High-resolution imageTable 2. Median H2 and Brγ Line Fluxes and Ratios
| Galaxy Namea | H2 1–0 S(1) Flux | 1–0 S(3)/1–0 S(1) | 1–0 S(2)/1–0 S(1) | 1–0 S(0)/1–0 S(1) | 2–1 S(1)/1–0 S(1) | Brγ Flux | Brδ/Brγ |
|---|---|---|---|---|---|---|---|
| (10−16 erg s−1 cm−2) | (10−16 erg s−1 cm−2) | ||||||
| UGC 08058 (35 mas) | 0.18 ± 0.07 | 0.92 ± 0.03 | 0.48 ± 0.03 | 0.32 ± 0.95 | 0.17 ± 0.03 | 0.14 ± 0.01 | 0.07 ± 0.47 |
| IRAS F17207−0014 | 0.48 ± 0.01 | 0.92:: | 0.48:: | 0.25 ± 0.01 | 0.18 ± 0.01 | 0.30 ± 0.01 | 0.09 ± 0.09 |
| UGC 08696 | 1.01 ± 0.01 | 1.04 ± 0.01 | 0.38 ± 0.01 | 0.27 ± 0.01 | 0.16 ± 0.01 | 0.46 ± 0.27 | 0.16 ± 0.07 |
| IRAS F22941−1808 | 0.17 ± 0.91 | 0.75 ± 0.08 | 0.31 ± 0.22 | ... | ... | 0.15 ± 0.78 | 0.04 ± 1.49 |
| IRAS F15250+3608 (50 mas) | 0.10:: | 0.85 ± 0.03 | 0.35 ± 0.02 | ... | ... | 0.11 ± 0.06 | 0.07:: |
| UGC 05101 | 0.52 ± 0.01 | 1.18 ± 0.04 | 0.39 ± 0.02 | 0.36 ± 0.01 | 0.22 ± 0.01 | 0.29 ± 0.02 | 0.09 ± 0.46 |
| VV 340a | 0.12:: | 0.92 ± 0.01 | 0.48 ± 0.01 | 0.26 ± 0.03 | 0.17 ± 0.02 | 0.05 ± 0.01 | 0.07 ± 0.78 |
| IRAS F01364−1042 | 0.69 ± 0.05 | 0.79 ± 0.02 | 0.37 ± 0.02 | 0.27 ± 0.05 | 0.19 ± 0.02 | 0.38 ± 0.34 | 0.03 ± 0.99 |
| IRAS F01364−1042 (35 mas) | 0.31 ± 0.02 | 0.88 ± 0.03 | 0.43 ± 0.03 | 0.32 ± 0.10 | 0.21 ± 0.44 | 0.31 ± 0.01 | 0.05 ± 0.34 |
| UGC 08387 | 0.30:: | 0.92 ± 0.02 | 0.44 ± 0.01 | 0.32 ± 0.06 | 0.23 ± 0.04 | 0.25 ± 0.01 | 0.21 ± 0.39 |
| CGCG 436−030 (35 mas) | 0.40 ± 0.03 | 0.71 ± 0.06 | 0.33 ± 0.22 | 0.44 ± 0.13 | 0.35 ± 0.04 | 0.58 ± 0.01 | 0.15 ± 0.01 |
| NGC 6670E (35 mas) | ... | 0.83 ± 0.02 | 0.39 ± 0.01 | 0.35 ± 0.01 | 0.30 ± 0.01 | ... | 0.11:: |
| IRAS F06076−2139N (35 mas) | 0.07:: | 0.98 ± 0.02 | 0.34 ± 0.01 | 0.29 ± 0.01 | 0.22 ± 0.02 | 0.07:: | 0.04 ± 0.12 |
| IRAS F18090+0130E | ... | 1.00 ± 0.05 | 0.38 ± 0.02 | 0.31 ± 0.21 | 0.17 ± 0.30 | ... | 0.10 ± 0.25 |
| IRAS F18090+0130W | ... | 0.96 ± 0.05 | 0.28 ± 0.04 | 0.24 ± 0.06 | 0.18 ± 0.05 | ... | 0.18 ± 0.06 |
| III Zw 035 | 1.42 ± 0.02 | 0.90 ± 0.02 | 0.35 ± 0.02 | 0.24 ± 0.01 | 0.17 ± 0.01 | 0.49 ± 0.03 | 0.12 ± 0.02 |
| III Zw 035 (35 mas) | 0.14:: | 0.74 ± 0.01 | 0.32 ± 0.01 | 0.22 ± 0.01 | 0.14 ± 0.01 | 0.04 ± 0.09 | 0.03 ± 0.29 |
| IRAS F20351+2521 | 0.29 ± 0.01 | 0.76 ± 0.03 | 0.38 ± 0.03 | 0.26 ± 0.02 | 0.27 ± 0.02 | 0.52 ± 0.01 | 0.15:: |
| NGC 2623 | 1.22 ± 0.01 | 0.90 ± 0.01 | 0.33 ± 0.01 | 0.24 ± 0.01 | 0.15 ± 0.01 | 1.11 ± 0.63 | 0.18 ± 0.19 |
| NGC 7469N (35 mas) | 0.02:: | 0.92 ± 0.04 | 0.49 ± 0.03 | 0.27 ± 0.02 | 0.55 ± 0.04 | 0.02:: | 0.02:: |
| NGC 6090 | 0.10 ± 0.01 | 0.90 ± 0.07 | 0.36 ± 0.04 | 0.51 ± 0.05 | 0.30 ± 0.05 | 0.12 ± 0.01 | 0.05 ± 0.05 |
| NGC 7674W (35 mas) | 0.17:: | 1.23 ± 0.14 | 0.37 ± 0.04 | 0.25 ± 0.02 | 0.22 ± 0.11 | 0.18 ± 0.01 | 0.21 ± 0.06 |
| IRAS F03359+1523 | 0.14 ± 0.08 | 0.69 ± 0.34 | 0.39 ± 0.09 | 0.43 ± 0.04 | 0.36 ± 0.03 | 0.25:: | 0.07 ± 0.01 |
| IRAS F03359+1523 (35scale) | 0.06:: | 0.56 ± 0.03 | 0.36 ± 0.03 | 0.40 ± 0.02 | 0.31 ± 0.02 | 0.09:: | 0.06:: |
| MCG +08−11−002 | 0.26 ± 0.30 | 0.87 ± 0.02 | 0.44 ± 0.01 | 0.29 ± 0.01 | 0.21 ± 0.01 | 0.34 ± 0.03 | 0.10 ± 0.08 |
| MCG +08−11−002 (35scale) | 0.09 ± 0.20 | 0.94 ± 0.15 | 0.34 ± 0.01 | 0.26 ± 0.01 | 0.22 ± 0.01 | 0.14 ± 0.12 | 0.03 ± 0.01 |
Note.
aAll galaxies refer to the 100 mas data unless specified otherwise. :: = upper limit.Download table as: ASCIITypeset image
For each of the reduced data cubes, we extracted the underlying power-law continuum and subtracted it from the spectra in each spaxel. We then fit the lines with a Gaussian profile to determine the flux, velocity, and velocity dispersion. The choice of using a single-component Gaussian fit overall was motivated by low S/N within some individual bins. In certain cases, multicomponent fits might be justified over integrated areas. For example, in Mrk 273, two Gaussian components were fit to the [Si vi] line from different integrated regions within the OSIRIS FOV that exhibited different kinematics arising from two distinct parts of the outflow see U et al. 2013 for more details). In IRAS F17207−0014, the integrated H2 flux from the shocked region was decomposed into two Gaussian fits that were consistent with the velocities of the western and eastern nuclei, respectively (Medling et al. 2015b). Multicomponent spectral fitting will be incorporated for integrated fluxes over specific regions in the outflow candidates in our follow-up work on the detailed kinematic analysis of winds.
In the case of the rovibrational molecular hydrogen transitions and hydrogen recombination lines, we fit the lines simultaneously by species. To increase the S/N in the individual line maps, we adopted optimal Voronoi binning using the Cappellari & Copin (2003) code so that the emission line in each spatial bin achieves an S/N of at least 3. In order to make proper comparisons of the H2 and Brγ lines within each galaxy, we further imposed the spatial bins computed from the strongest H2 transition within this regime, H2 1–0 S(1), onto the Brγ line while generating the flux, velocity, and velocity dispersion maps of the latter. This binning constraint allows us to have bin-matched line ratio maps for all of the galaxies. The errors for the line and line ratio maps were determined from refitting the line parameters to a synthetic data cube with added random noise 500 times and propagated accordingly. We present our extracted continuum and line emission, line ratio, and other derived property maps for our sample in Figure 3.
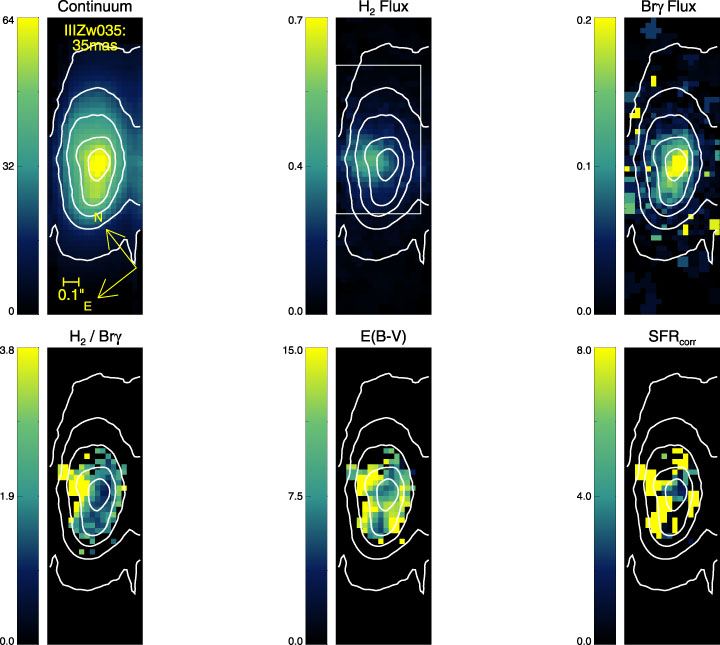
Figure 3.
Six-panel figure for III Zw 035 (with 35 mas sampling) showing, from left to right, top to bottom: (1) K-band continuum map in relative flux units and shown with 01 scale bar and compass rose; the continuum contours are shown in all subsequent panels. (2) H2 1–0 S(1) flux map in 10−16 erg s−1 cm−2, with box highlighting the "H2-dominated region." (3) Brγ flux map in 10−16 erg s−1 cm−2. (4) H2 1–0 S(1)/Brγ (hereafter H2/Brγ) map showing the reliable spaxels (with S/N > 3 in both H2 and Brγ). (5)  map. (6) Dust-corrected SFR map (M⊙ yr−1) . In several galaxies, the SFR exhibits a large dynamic range such that the chosen color scale may be limited in showing the full range of the derived values. (The complete figure set (26 images) is available.)
Download figure:
Standard image High-resolution image4. Near-infrared Emission-line Diagnostics
4.1. H2 Excitation Mechanisms and Temperatures
Five H2 emission lines in our spectra trace the warm molecular gas. These lines can be thermally excited through collisions with the surrounding atomic gas, itself heated by shocks, turbulence, UV photons from OB stars, or even X-rays from the central AGN (Mouri 1994). On the other hand, nonthermal excitation processes include absorption of UV photons (resonance fluorescence) and collisions with high-energy electrons (Burton 1987). The flux ratios between the transitions can partially distinguish between thermal and nonthermal excitation mechanisms, thanks to the difference in their efficiencies in populating the various vibrational levels. Much effort has been put into developing models to predict the values of these line intensity ratios for the scenarios of nonthermal excitation (Black & van Dishoeck 1987), shock heating (Brand et al. 1989), and thermal UV excitation (Sternberg & Dalgarno 1989). Detailed studies of the near-infrared H2 line ratios in Seyferts (Müller-Sánchez et al. 2018), star-forming galaxies (Riffel et al. 2013), LIRGs (Bedregal et al. 2009; Emonts et al. 2014; Väisänen et al. 2017), and nearby spirals (Mazzalay et al. 2013; Smajić et al. 2015; Busch et al. 2017) have been enabled within the past decade by a suite of near-infrared integral field instruments. Several of the results have indicated that the warm molecular gas in these systems is consistent with being thermally excited by a combination of X-ray radiation and slow shocks.
Here we employ two particular H2 line ratio diagnostics, 2−1 S(1)/1−0 S(1) versus 1−0 S(3)/1−0 S(1) and versus 1−0 S(2)/1−0 S(0), to gain insight into the excitation mechanisms of our galaxies by extracting their integrated values over the high-S/N, H2 emission–dominated "nuclear" region within each galactic nucleus (see Figure 3 and Table 3) and comparing them to various theoretical models (Figure 4). First, we note that the locus of the galaxies lies closer to the various thermal models on the left side of the plot, suggesting that nonthermal UV fluorescence, though plausibly present, is unlikely to contribute to the dominant excitation mechanism. The exception is NGC 7469N, which, interestingly, features offset ( ) Brγ emission relative to the continuum peak. We further note that several of the systems where we found shocked gas based on enhanced H2/Brγ ratios (e.g., Mrk 273 in U et al. 2013; IRAS F17207−0014 in Medling et al. 2015b; III Zw 035; filled cyan circles in the figure) reside near the region on the diagnostic plot occupied by predictions from shock models. See Section 4.4 for further analysis of the H2/Brγ of this sample.
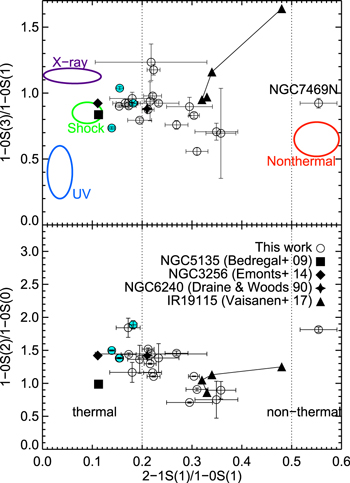
Figure 4. The H2 ratio diagnostic plots comparing the nuclei of our (U)LIRGs (open circles) to other (U)LIRGs from the literature (filled symbols). In the top plot, the ovals designate models as adopted from Draine & Woods (1990; X-rays, purple), Brand et al. (1989; shock, green), Sternberg & Dalgarno (1989; UV, blue), and Black & van Dishoeck (1987; nonthermal, red). The thermal and nonthermal regions are indicated as  and
and  , respectively. Most of the H2 line ratios of our merger systems do not align with pure theoretical models, indicating that mixing may complicate the identification of the main mechanism at hand. The filled cyan circles represent Mrk 273, IRAS F17207−0014, and III Zw 035, which display some of the best cases of shocked gas (see Section 4.4) and reside near the region predicted by shock models. The connected filled triangles represent spatially resolved regions within IRAS F19115–2124 (Väisänen et al. 2017), showing that different spatial components within a merger may also host distinctly excited molecular gas.
Download figure:
Standard image High-resolution imageTable 3. Derived Quantities
| Galaxy Namea | Area | Ftotal (H2) | Mtotal (H2) | A2.2 μm | L(Brγ) | Lcorr(Brγ) | ΣSFR | ΣcorrSFR | Tvib | Trot |
|---|---|---|---|---|---|---|---|---|---|---|
| (kpc2) | (10−16 erg s−1 cm−2) | (103 M⊙) | (106 L⊙) | (106 L⊙) | (M⊙ yr−1 kpc−2) | (M⊙ yr−1 kpc−2) | (K) | (K) | ||
| UGC 08058 (35 mas) | 0.32 | 49.5 ± 9.2 | 9.1 ± 1.7 | 0.0 ± 2.6 | 2.7 ± 0.1 | 2.7 ± 0.1 | 26.8 ± 1.8 | 26.8 ± 5.6 | 2670 ± 190 | 1540 ± 640 |
| IRAS F17207−0014 | 1.39 | 111.6 ± 11.2 | 360.0 ± 36.1 | 3.1 ± 2.3 | 6.2 ± 0.1 | 109.5 ± 1.4 | 14.0 ± 2.3 | 247.7 ± 29.5 | 2790 ± 65 | 2250 ± 160 |
| UGC 08696 | 1.44 | 123.0 ± 20.3 | 89.6 ± 14.8 | 1.2 ± 2.3 | 2.2 ± 0.1 | 10.7 ± 0.3 | 6.7 ± 1.3 | 33.0 ± 6.3 | 2590 ± 50 | 1380 ± 60 |
| IRAS F22941−1808 | 3.08 | 20.0 ± 2.7 | 283.3 ± 37.8 | 5.5 ± 0.1 | 0.4 ± 0.1 | 9.0 ± 1.4 | 0.4 ± 0.4 | 9.2 ± 3.0 | ⋯ | ⋯ |
| IRAS F15250+3608 (50 mas) | 0.43 | 22.8 ± 2.1 | 57.6 ± 5.4 | 2.3 ± 2.2 | 2.8 ± 0.1 | 22.7 ± 0.4 | 20.3 ± 0.9 | 163.9 ± 17.0 | ⋯ | ⋯ |
| UGC 05101 | 1.04 | 123.0 ± 20.3 | 89.6 ± 14.8 | 1.7 ± 3.1 | 2.2 ± 0.1 | 10.7 ± 0.3 | 6.7 ± 1.3 | 33.0 ± 6.3 | 3100 ± 100 | 1080 ± 70 |
| VV 340a | 0.78 | 9.7 ± 1.7 | 28.5 ± 5.1 | 0.0 ± 1.5 | 0.1 ± 0.0 | 3.8 ± 0.2 | 0.6 ± 0.1 | 15.2 ± 2.3 | 2720 ± 190 | 2150 ± 420 |
| IRAS F01364−1042 | 1.14 | 97.2 ± 13.5 | 745.9 ± 103.8 | 3.8 ± 2.2 | 3.8 ± 0.1 | 123.4 ± 4.1 | 10.4 ± 1.8 | 339.1 ± 50.3 | 2890 ± 180 | 1350 ± 330 |
| IRAS F01364−1042 (35 mas) | 0.12 | 28.8 ± 5.3 | 41.9 ± 7.6 | 2.0 ± 2.7 | 3.2 ± 0.1 | 19.8 ± 0.4 | 86.1 ± 1.5 | 532.4 ± 81.0 | 2990 ± 330 | 1310 ± 500 |
| UGC 08387 | 1.10 | 111.3 ± 15.4 | 14.8 ± 2.0 | 1.5 ± 2.1 | 3.1 ± 0.0 | 7.4 ± 0.1 | 8.7 ± 1.1 | 21.1 ± 2.4 | 3180 ± 320 | 1380 ± 320 |
| CGCG 436−030 (35 mas) | 0.07 | 8.4 ± 2.2 | 1.3 ± 0.3 | 0.0 ± 3.8 | 6.2 ± 0.1 | 10.1 ± 0.1 | 273.5 ± 2.7 | 445.9 ± 61.6 | 4120 ± 380 | 790 ± 400 |
| NGC 6670E (35 mas) | 0.12 | ⋯ | ⋯ | 0.8 ± 2.4 | ⋯ | ⋯ | ⋯ | ⋯ | 3750 ± 90 | 1100 ± 50 |
| IRAS F06076−2139N (35 mas) | 0.47 | 38.5 ± 6.2 | 29.0 ± 4.6 | 1.9 ± 3.4 | 2.5 ± 0.0 | 13.7 ± 0.1 | 16.5 ± 1.2 | 91.8 ± 14.7 | 3090 ± 140 | 1140 ± 50 |
| IRAS F18090+0130E | 0.22 | ⋯ | ⋯ | 0.0 ± 1.7 | ⋯ | ⋯ | ⋯ | ⋯ | 2690 ± 230 | 1200 ± 910 |
| IRAS F18090+0130W | 0.12 | ⋯ | ⋯ | 0.0 ± 1.3 | ⋯ | ⋯ | ⋯ | ⋯ | 2780 ± 350 | 1140 ± 340 |
| III Zw 035 | 0.25 | 92.1 ± 10.3 | 11.8 ± 1.3 | 0.6 ± 2.9 | 1.5 ± 0.0 | 2.6 ± 0.0 | 18.7 ± 0.3 | 32.3 ± 2.2 | 2720 ± 110 | 1450 ± 140 |
| III Zw 035 (35 mas) | 0.18 | 61.2 ± 4.9 | 86.9 ± 7.0 | 3.2 ± 3.6 | 0.7 ± 0.0 | 12.8 ± 0.1 | 11.7 ± 0.3 | 222.8 ± 27.5 | 2460 ± 40 | 1530 ± 70 |
| IRAS F20351+2521 | 0.41 | 23.1 ± 4.4 | 23.1 ± 4.4 | 3.0 ± 4.2 | 3.2 ± 0.0 | 27.8 ± 0.3 | 24.3 ± 1.0 | 212.2 ± 20.6 | 3460 ± 180 | 1480 ± 220 |
| NGC 2623 | 0.28 | 244.6 ± 19.9 | 44.7 ± 3.6 | 2.4 ± 1.6 | 4.9 ± 0.0 | 24.4 ± 0.2 | 54.5 ± 1.1 | 272.2 ± 19.5 | 2570 ± 50 | 1380 ± 60 |
| NGC 7469N (35 mas) | 0.03 | 1.5 ± 0.3 | 0.2 ± 0.0 | 1.8 ± 3.3 | 0.1 ± 0.0 | 0.4 ± 0.0 | 7.8 ± 0.0 | 41.9 ± 4.6 | 6260 ± 470 | 2080 ± 410 |
| NGC 6090 | 0.95 | 5.3 ± 0.8 | 1.7 ± 0.2 | 0.0 ± 3.2 | 0.7 ± 0.0 | 2.4 ± 0.0 | 2.3 ± 0.3 | 8.1 ± 1.1 | 3680 ± 370 | 750 ± 80 |
| NGC 7674W (35 mas) | 0.08 | 26.0 ± 5.4 | 0.9 ± 0.2 | 0.0 ± 2.9 | 1.2 ± 0.0 | 0.5 ± 0.0 | 48.9 ± 0.7 | 21.2 ± 3.9 | 3060 ± 860 | 1460 ± 270 |
| IRAS F03359+1523 | 0.95 | 21.6 ± 4.1 | 11.9 ± 2.3 | 1.7 ± 3.3 | 4.0 ± 0.0 | 16.9 ± 0.2 | 13.1 ± 1.5 | 55.7 ± 6.7 | 4200 ± 260 | 900 ± 190 |
| IRAS F03359+1523 (35 mas) | 0.11 | 9.3 ± 1.9 | 7.0 ± 1.4 | 1.9 ± 2.4 | 1.3 ± 0.0 | 7.9 ± 0.0 | 37.0 ± 0.1 | 215.6 ± 2.7 | 3790 ± 180 | 910 ± 60 |
| MCG +08−11−002 | 0.44 | 62.6 ± 9.9 | 23.3 ± 3.7 | 2.5 ± 1.9 | 1.9 ± 0.0 | 19.8 ± 0.2 | 13.8 ± 0.7 | 142.1 ± 15.9 | 3020 ± 90 | 1560 ± 110 |
| MCG +08−11−002 (35 mas) | 0.08 | 25.6 ± 4.5 | 22.8 ± 4.0 | 3.5 ± 3.3 | 1.2 ± 0.0 | 30.7 ± 0.2 | 52.0 ± 0.4 | 1277.7 ± 120.5 | 3050 ± 90 | 1280 ± 100 |
Note.
aAll galaxies refer to the 100 mas data unless specified otherwise.Download table as: ASCIITypeset image
We also compare our H2 line ratios with those of several LIRGs found in the literature in Figure 4. For both NGC 5135 (Bedregal et al. 2009;  ) and NGC 3256 (Emonts et al. 2014;
  ), the H2 line ratios within their respective nuclei are represented as single components. In the case of NGC 6240 (Draine & Woods 1990;
  ), the H2 line ratios were extracted from the inner 3'' region. These sources are broadly consistent with the (U)LIRGs in our sample, where the H2 gas is likely excited by X-ray irradiation and/or shocks from supernova remnants. We also show the spatially resolved H2 line ratios extracted from different regions within IRAS F19115–2124, where the aperture corresponding to the circumnuclear region is shown to be dominated by nonthermal emission and that corresponding to the strongest star-forming areas appears to be dominated by thermal excitation (Väisänen et al. 2017).
Given the H2 line ratios, we make use of the equations from Reunanen et al. (2002) and Rodríguez-Ardila et al. (2004, 2005) to compute the rotational and vibrational temperatures within the nuclei of our sample:
The derived vibrational and rotational temperatures are listed in Table 3 and illustrated in Figure 5. The mean vibrational temperature for our sample is  , whereas the mean rotational temperature is
  . The vibrational temperatures for our sample tend to be above those measured for Seyferts (Tvib ≲ 2600 K; Reunanen et al. 2002). We note that the mean values for Tvib and Trot differ by a factor of ∼2 for most of the sample, but the difference is particularly appreciable for NGC 7469N. A large difference between Trot and Tvib is usually explained by the presence of fluorescently excited H2, while purely thermally excited H2 would exhibit much more similar Trot and Tvib values (e.g., Black & van Dishoeck 1987; Draine & Bertoldi 1996; Martini et al. 1999).
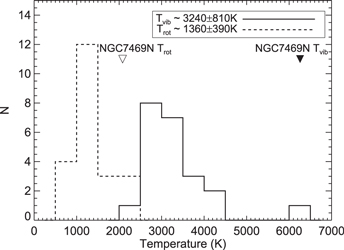
Figure 5. Histograms of the vibrational (solid) and rotational (dashed) temperatures computed from H2 transitions (see equations in text). The mean values for Tvib and Trot differ appreciably, by about a factor of two. The triangles mark the Tvib (filled) and Trot (open) for NGC 7469N, which shows the largest discrepancy.
Download figure:
Standard image High-resolution image4.2. Dust Correction and Nuclear Star Formation Rates
Given the expected level of heavy dust extinction in the nuclei of (U)LIRGs (AV ∼ 3−17 mag; Piqueras López et al. 2013), star formation rates (SFRs) as computed from optical or UV tracers may not offer the complete picture in this domain. The hydrogen recombination lines in the near-infrared, such as the Brackett or Paschen series, may offer a truer measure of the nuclear SFR, as they trace ionizing photons from young stars. However, if the dust extinction in the nuclear region were patchy or had an unusual wavelength dependence, even global SFRs determined from these near-infrared lines may be biased. Thus, we compute the spatially resolved extinction map for each source and determine the nuclear SFR using the dust-corrected Brγ line flux as a proxy for recent star formation. Following, e.g., Calzetti et al. (1994) and Domínguez et al. (2013), we compute the intrinsic luminosities Lint as follows:

where Lobs is the observed luminosity and Aλ is the extinction at wavelength λ,  . We determine the color excess E(B − V) using the relationship between the nebular emission-line color excess and the Brackett decrement (Brγ and Brδ; e.g., Momcheva et al. 2013),
where k(Brδ) = 0.43 and k(Brγ) = 0.36 are the reddening curves evaluated at Brδ and Brγ wavelengths, respectively (e.g., Cardelli et al. 1989; Calzetti 2001, D. Calzetti 2018, private communication). We obtain (Brγ/Brδ)int = 3.0/2.1 = 1.4 from Osterbrock (1989), which, in combination with the extinction curves and observed Brγ/Brδ maps, provides the color excess map for each nucleus and, subsequently, the dust-corrected Brγ maps. We then convert the luminosity of Brγ, L(Brγ), to SFR using

as adopted from Kennicutt (1998). In order to compare SFRs across galaxies and data sets covering different physical scales of the nuclear regions, we further compute the surface density of the SFR, ΣSFR (in M⊙ yr−1 kpc−2), by taking into account only the subregion within the OSIRIS FOV where reliable H2 and Brγ fluxes can be measured. The observed and extinction-corrected total nuclear Brγ luminosities, along with their corresponding SFR surface densities, are listed in Table 3.
4.3. Warm Molecular Gas Mass
The total warm molecular hydrogen mass in the galactic nuclei can be computed from the flux-calibrated H2 1−0 S(1) emission line. Using the prescriptions from, e.g., Mazzalay et al. (2013),
where  is the mass of the warm H2 at T ≃ 2000 K in M⊙, DL is the luminosity distance in Mpc, F1−0S(1) is the flux of the H2 1−0 S(1) line, and A2.2 is the extinction at 2.2 μm (e.g., Scoville et al. 1982). The total flux of H2 within the same subregion of reliable measurements and the corresponding derived molecular gas mass are listed in Table 3.
4.4. H2/Br as a Shock Tracer

Given that the warm (T ∼ 2000 K) molecular gas is most likely thermally excited due to shocks or, perhaps, X-ray radiation (Figure 4), and that the Brγ line traces UV-ionizing radiation from young stars, the H2 1−0 S(1)/Brγ (hereafter H2/Brγ) ratio quantifies the relative contributions from these energy sources. Specifically, a high H2/Brγ ratio signals a contribution to the H2 heating that is above and beyond that contributed by the source of the radiation that produces the H ii regions. That excess heating may be due to shocks or X-ray radiation. The H2/Brγ ratio is arguably better at separating starbursts, Seyferts, and composite galaxies than its optical counterparts, because H2 traces the warm molecular gas at ∼100 K rather than 104 K ionized atomic gas and is therefore less closely coupled with high-ionization lines (e.g., [O iii]). The H2/Brγ ratio divides starburst galaxies and Seyferts at 0.6, while H2/Brγ ≳ 2−3 further indicates shock heating or photoionization by the central AGN (e.g., Larkin et al. 1998; Rodríguez-Ardila et al. 2005; Riffel et al. 2008).
In our sample of 21 interacting systems, six sources have regions with H2/Brγ > 2 (UGC 08058, IRAS F17207−0014, UGC 08696, IRAS F22491−1808, UGC 05101, and III Zw 035). These shocked candidates consist of five ULIRGs and one LIRG within our sample (see Figure 6). The shocked nature of the outflowing molecular gas in UGC 08696 and IRAS F17207−0014 has been discussed extensively in U et al. (2013) and Medling et al. (2015b), respectively. UGC 08696 features a dual AGN system where enhanced H2/Brγ ratios are found both at the site of a hard X-ray AGN in the southwestern region and near the obscured AGN in the north. Given that the northern AGN is very obscured, its surrounding H2 gas is likely to be primarily heated by shocks, despite the presence of an AGN. The shocked molecular gas in IRAS F17207−0014 is spatially coincident with the base of a nuclear superwind.
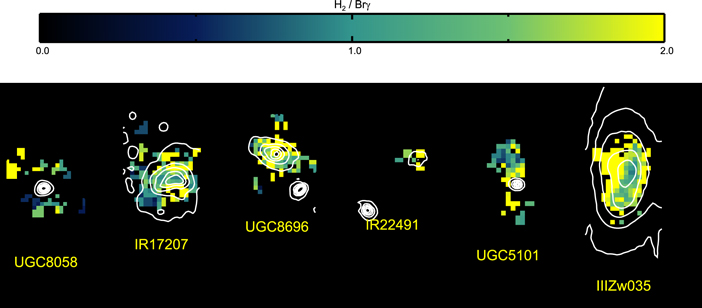
Figure 6. Spatial distribution of the H2/Brγ maps for potential shock candidates. These sources exhibit coherent structure with elevated H2/Brγ values by visual inspection. Here the color bar is constant for all panels. The contours represent the K-band continuum.
Download figure:
Standard image High-resolution imageThe strongest new shocked outflow candidate is the OH megamaser host galaxy III Zw 035, whose H2/Brγ line ratio and H2 kinematic maps point to a clump of shocked, outflowing H2 just south of the continuum peak (see Figure 3). This shocked gas is seen emanating from the minor axis of the disk in a fan shape. There is a hint of biconical signature on the opposite side of the disk, but the spatial coverage of the OSIRIS FOV is too limiting to confirm its full extent. The lack of AGN signature from hard X-ray or [Ne v] detection in our multiwavelength ancillary data set (Iwasawa et al. 2011; Petric et al. 2011; Inami et al. 2013) would suggest that these shocks are not being driven by an AGN. IRAS F22491−1808 hosts two kinematically distinct nuclei that are 2.2 kpc apart (see Paper I and the Appendix for details), and a molecular outflow has been detected in H2 (Emonts et al. 2017) but not in OH (Veilleux et al. 2013). Our OSIRIS data show that the H2 outflow entrains shocked gas with H2/Brγ > 2 in the eastern nucleus. Both UGC 08058 and UGC 05101 feature a bright AGN in the center, so the gas is difficult to see at the nucleus given the bright continuum source, but excited H2 gas is detected in the circumnuclear region that may be caused by shocks or AGN photoionization.
For the remaining sources, the H2/Brγ ratio reaches no higher than ∼1.5. In several cases, H2 is preferentially located on the outskirts (∼150–250 pc) of the nucleus relative to Brγ (e.g., UGC 08387, NGC 2623, and IRAS F03359+1523). Here the spatial coincidence of Brγ relative to the K-band continuum indicates the sites of nuclear star formation, whereas the off-nuclear H2 gas may be expelled winds from the nearby central sources based on kinematics analysis (to be presented in a forthcoming paper). For CGCG 436–030, IRAS F20351+2521, and NGC 6090, the H2 flux is weak but cospatial relative to that of Brγ, resulting in low H2/Brγ values across the nuclear region.
Statistical results of the H2/Brγ line ratio for our sample (for individual galaxies as well as for ULIRGs and LIRGs as two populations) are presented in Table 4. We note that the median value for our LIRGs, 0.77, is consistent with the VLT/SINFONI results presented for LIRGs (median = 0.77 with 5th and 95th percentiles of 0.29 and 2.30, respectively) in Colina et al. (2015), which consists of a sample of LIRGs with  , reaching a lower luminosity range than our LIRGs. The VLT/SINFONI observations span a larger FOV and coarser resolution (average FWHM ∼ 06) than our OSIRIS observations. While the sample in Colina et al. (2015) is more nearby (
 ), their IFS coverage includes the inner ∼2.5−5 kpc regions, more extended than ours in general. The statistical results for our ULIRGs (median H2/Brγ = 1.43) are similar to those obtained from Gemini/NIFS observations of Seyferts (median = 1.41 with 5th and 95th percentiles = 0.40 and 4.00, respectively) as reported in Colina et al. (2015), even though not all of our ULIRGs host an AGN. The similarity in the high H2/Brγ ratio between the ULIRGs and the Seyferts suggests that the two populations both have significant excesses of warm molecular gas compared to what is seen in the larger population of LIRGs.
Table 4. Statistical H2/Brγ Line Ratios
| Galaxy Namea | Maximum (Visual) | Median | Mean | Variance |
|---|---|---|---|---|
| UGC 08058 (35 mas) | 4.20 | 1.54 | 2.56 | 2.96 |
| IRAS F17207−0014 | 4.85 | 1.30 | 1.41 | 0.62 |
| UGC 08696 | 5.30 | 1.64 | 1.84 | 0.79 |
| IRAS F22491−1808 | 1.63 | 1.63 | 1.63 | ... |
| IRAS F15250+3608 (50 mas) | 2.86 | 1.13 | 1.26 | 0.50 |
| UGC 05101 | 3.71 | 1.31 | 1.46 | 0.63 |
| ULIRGs | 3.76 | 1.43 | 1.69 | 0.92 |
| VV 340a | 1.92 | 0.99 | 1.00 | 0.55 |
| IRAS F01364−1042 | 2.17 | 1.22 | 1.27 | 0.39 |
| IRAS F01364−1042 (35 mas) | 2.21 | 0.88 | 0.97 | 0.41 |
| UGC 08387 | 1.67 | 0.80 | 0.81 | 0.44 |
| CGCG 436−030 (35 mas) | 1.17 | 0.54 | 0.68 | 0.31 |
| NGC 6670E (35 mas) | 1.22 | 0.34 | 0.40 | 0.21 |
| IRAS F06076 (35 mas) | 3.72 | 0.90 | 0.97 | 0.40 |
| IRAS F18090+0130E (35 mas) | 1.23 | 0.59 | 0.64 | 0.30 |
| IRAS F18090+0130W (35 mas) | 0.98 | 0.38 | 0.40 | 0.17 |
| III Zw 035 | 4.27 | 2.25 | 2.19 | 1.09 |
| III Zw 035 (35 mas) | 6.00 | 2.01 | 2.40 | 1.26 |
| IRAS F20351+2521 | 1.85 | 0.58 | 0.56 | 0.18 |
| NGC 2623 | 2.04 | 0.99 | 1.02 | 0.28 |
| NGC 7469N (35 mas) | 1.18 | 0.74 | 0.75 | 0.35 |
| NGC 6090 | 1.06 | 0.55 | 0.67 | 0.43 |
| NGC 7674W (35 mas) | 2.65 | 0.83 | 0.89 | 0.45 |
| IRAS F03359+1523 | 1.20 | 0.51 | 0.58 | 0.30 |
| IRAS F03359+1523 (35 mas) | 3.58 | 0.58 | 0.60 | 0.21 |
| MCG +08−11−002 | 2.20 | 0.70 | 0.74 | 0.31 |
| MCG +08−11−002 (35 mas) | 1.46 | 0.56 | 0.59 | 0.22 |
| LIRGsb | 2.12 | 0.77 | 0.83 | 0.39 |
Notes.
aAll galaxies refer to the 100 mas data unless specified otherwise. bFor galaxies observed in both 35 and 100 mas scales, only the values at the 35 mas scale have been incorporated into the LIRG statistics.Download table as: ASCIITypeset image
4.5. Effects of Spatial Resolution
The effect of angular resolution on line ratios was considered significant in previous studies, particularly in the case of LIRGs (e.g., Colina et al. 2015). Given that lower-resolution observations are commonplace, whether due to seeing limitations or different instrument capabilities, we explored how differences in spatial resolution might affect our measurements in these exotic environments within the nuclei of (U)LIRGs. High-resolution data, such as those taken with OSIRIS, present the opportunity to distinguish resolved sources from diffuse emission at small scales and quantify the dilution of the emission-line signal, if any.
First, it is worth reiterating the findings from Colina et al. (2015) that are relevant to the discussion at hand. In assessing the effect of spatial resolution, they compared the integrated (e.g., flux-weighted) and median [Fe ii] (1.64 μm)/Brγ and H2/Brγ measurements and found that, with the exception of a few objects, most LIRGs show large differences in the [Fe ii]/Brγ ratio with integrated over median values ∼1.5–2.2 times higher. They reasoned that integrated values are more affected by the locus of the nuclei and might therefore appear as higher excitation than the median ones, but they questioned whether this was a general behavior in LIRGs or galaxies in general if larger volumes of galaxies with IFS data were present.
We investigated whether a similar effect in line ratios might be seen in our data. Within our sample, four sources were taken in both the 35 and 100 mas plate scales: III Zw 035, IRAS F01364−1042, IRAS F03359+1523, and MCG +08–11–002. Since all but the two observations for MCG +08–11–002 were obtained on different nights, line ratios provide a more robust test of consistency than calibrated line fluxes, which may incorporate photometric errors from different observing conditions. We extract the H2/Brγ statistics from Table 4 for these objects and compare the flux-weighted mean over median values at different plate scales. We do find a slight enhancement in the mean over median values of ∼1.1–1.3 times, but we see no systematic differences between those measured from the 100 and 35 mas scales.
There may be several reasons for the apparent discrepancy from the Colina et al. (2015) claim. The OSIRIS area coverage is more limited to the central kpc region, which is dominated by the nuclear source. Thus, a median measurement representative of the nuclear region is less susceptible to the diffuse emission on broader physical scales. Even in the case of our coarser resolution, the nuclear components are resolved. In addition, Colina et al. (2015) illustrated that the disparity between the median and integrated line ratios is negligible in Seyferts but more prominent in LIRGs and star-forming galaxies. There may be a range of the expected divergence among different types of galaxies, and our sample lies in the higher-luminosity end of such a spectrum. Lastly, the Colina et al. (2015) conclusion was based on the integrated and median values of the [Fe ii]/Brγ ratio. They showed the H2/Brγ measurements in their Figure 7, where the differences appear to be smaller.
5. Discussion
5.1. SFR at Nuclear Scales
In Figure 7, we show the histograms of our derived SFR and ΣSFR for the sample both before and after extinction correction. In both cases, it is clear that there is an ∼1–1.5 dex enhancement in the SFR and SFR surface density that was obscured by the dust in the nuclear regions of our galaxies. This correction corresponds to an extinction up to ∼2.5–4 mag in the K band, or ∼25–40 in the V band, significantly higher than the  mag quoted from Piqueras López et al. (2013) but consistent with the AV ∼ 5–40 mag found in other AO studies of LIRG nuclei (Mattila et al. 2007; Väisänen et al. 2017). If we take a closer look at the VLT/SINFONI results, the AV values of individual spaxels reach upward of 20–30 mag. In some cases, the extinction at the very center of the K-band continuum peak is not reported due to insufficient S/N in the Brackett line fluxes. The lack of signal at the center, coupled with the integrated nature of the statistics reported in Piqueras López et al. (2013), could explain the discrepancy in extinction corrections between this work and their VLT/SINFONI results.
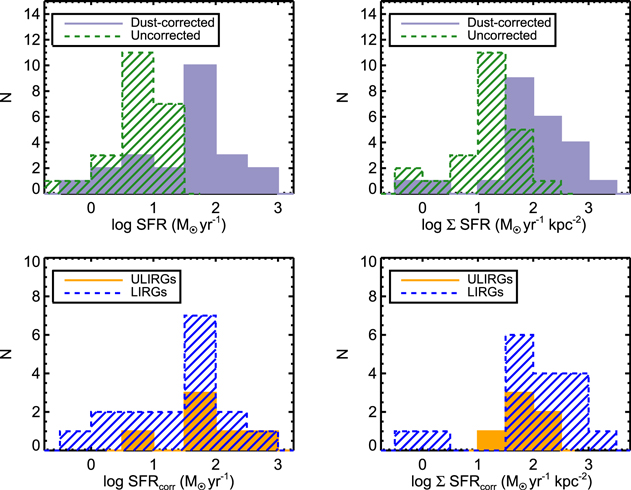
Figure 7. (Top) Histograms of the nuclear SFR (left) and SFR surface density (right) on logarithmic scales before (green hatched) and after (purple shaded) dust correction. In both cases, dust correction raises the observed SFR by a factor of  dex. (Bottom) Histograms of the dust-corrected nuclear SFR (left) and SFR surface density (right) on logarithmic scales as segregated by ULIRGs (orange shaded) and LIRGs (blue hatched). It can be seen that the ULIRGs have SFRs that are comparable to the high end of what the LIRGs span but may be indistinguishable from the LIRGs in terms of SFR surface densities. Bin sizes are 0.5 dex.
Download figure:
Standard image High-resolution imageFor comparison, observed SFRs have been derived for both nuclear and extranuclear star-forming clumps identified in high-resolution HST/WFC3 narrowband images of Paα and Paβ emission of the LIRGs in GOALS. The nuclear SFR ranges from 0.02 to 10 M⊙ yr−1, while the nuclear ΣSFR spans ∼4–20 M⊙ yr−1 kpc−2 (K. Larson et al. 2018, in preparation). These measurements are broadly consistent with the median values of our uncorrected SFR and ΣSFR distributions. Dust corrections computed from Paschen lines in the H band and Brackett lines in the K band should be applied accordingly, as different extinctions would be determined depending on the lines used and, hence, on the depth probed through the dust (e.g., Väisänen et al. 2017).
Furthermore, we break down the distribution of dust-corrected SFR and ΣSFR by infrared luminosity. The bottom panels of Figure 7 show the histograms of the corrected SFR and ΣSFR for LIRGs and ULIRGs, respectively. In terms of total SFRs, ULIRGs do, on average, make more stars than their lower-luminosity counterparts in the resolved nuclear regions. However, we see here that some LIRGs match their ultraluminous counterparts in SFR. Also, the ULIRGs appear indistinguishable from the LIRGs in terms of SFR surface densities, suggesting that they are similarly efficient at producing stars at these scales from near-infrared star formation indicators. It is plausible that the ULIRG nuclei are still optically thick and thus undercorrected at these wavelengths; future resolved far-infrared observations could confirm these findings. We note that these observed SFR and SFR surface density values within our S/N-defined nuclear regions are not consistent in physical scales across our sample that spans a range in redshifts, such that even SFR surface density could be affected if a radial gradient were present. The fact that the LIRGs and ULIRGs exhibit similar distributions in ΣSFR is consistent with what was observed with VLT/SINFONI of the inner regions of nearby southern (U)LIRGs (Piqueras López et al. 2016).
We further explore the dust-corrected nuclear SFR and SFR surface density relations with various properties of the (U)LIRG hosts in Figure 8. First, we examine how they may correlate individually with the host's infrared luminosity. Globally, we expect the infrared luminosity to correlate with SFR, particularly in (U)LIRGs, because the light from the formation of young stars is reprocessed through dust in the cooler regime (cf. U et al. 2012). We saw in Figure 7 that ULIRGs occupy the high end of nuclear SFR; however, the relation between SFR and log LIR is difficult to quantify (see top left panel in Figure 8). The trend is similarly insignificant in the case of SFR surface density (bottom left panel).
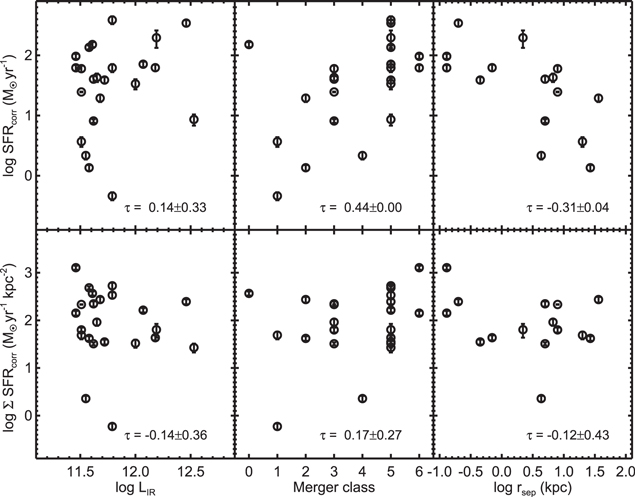
Figure 8. Dust-corrected nuclear SFR (top) and nuclear SFR surface density (bottom) on logarithmic scales as a function of galaxy-integrated global infrared luminosity  (left), merger class (middle), and nuclear separation
  (right). Kendall's correlation coefficient τ, along with its significance, is given in each panel.
Download figure:
Standard image High-resolution imageNext, we consider the relation of the nuclear SFR with the merger class of the (U)LIRG host system. If the most rapid star formation in (U)LIRGs is triggered by merger activity, we would expect the nuclear SFR to be most enhanced at coalescence. We have compiled the merger classification for our sample in our summary table (see Table 5). We have also collated, in the same table, the projected nuclear separation between nuclei, if observed and resolved, from the literature, should it offer additional insights into the accretion of gas onto the galaxy center throughout the merging process.
Table 5. Summary Table
| Galaxy Name† | Merger Class | Nuclear Separation (kpc) | AGN | Feedback Signature | |
|---|---|---|---|---|---|
| from OSIRIS | from Literature | ||||
| (1) | (2) | (3) | (4) | (5) | (6) |
| UGC 08058 (35 mas) | 5 | single (a) | Y (1) | Y | Y (i) |
| IRAS F17207−0014 | 5 | 0.20 (b) | N (b) | Y (b) | N (i), (iii),Y (ii) |
| UGC 08696 | 5 | 0.75 (c) | Y (1) | Y (c) | Y (i) |
| IRAS F22491−1808 | 5 | 2.20 (a), (d) | N (2), (3) | Y | N (i), Y (iii) |
| IRAS F15250+3608 (50 mas) | 5 | single (a) | Y(buried) (2), (3) | (Y) | Y (i) |
| UGC 05101 | 5 | single (a) | Y (1) | Y | N (i) |
| VV 340a | 1 | single (a) | Y (1) | N | ⋯ |
| IRAS F01364−1042 | 5 | single (a) | unclear (4) | (Y) | ⋯ |
| IRAS F01364−1042 (35 mas) | 5 | single (a) | unclear (4) | (Y) | ⋯ |
| UGC 08387 | 5 | 0.45 (e) | Y (8) | N | ⋯ |
| CGCG 436−030 (35 mas) | 2 | 36.23 (e) | unclear (4) | N | ⋯ |
| NGC 6670E (35 mas) | 2 | 1.04 (e) | N (5), (6) | (Y) | ⋯ |
| IRAS F06076−2139N (35 mas) | 3 | 6.70 (f) | N (6) | N | ⋯ |
| IRAS F18090+0130E (35 mas) | 2 | 49.35 (e) | N (6) | N | ⋯ |
| IRAS F18090+0130W (35 mas) | 2 | 49.35 (e) | N (6) | N | ⋯ |
| III Zw 035 | 3 | 4.99 (e) | N (6), CT (7) | Y | ⋯ |
| III Zw 035 (35 mas) | 3 | 4.99 (e) | N (6), CT (7) | Y | ⋯ |
| IRAS F20351+2521 | 0 | single (a), (e) | N (6) | N | ⋯ |
| NGC 2623 | 5 | single (a), (e) | Y (8) | (Y) | ⋯ |
| NGC 7469N (35 mas) | 2 | 26.76 (e) | Y (8)(S) | N | ⋯ |
| NGC 6090 | 4 | 4.33 (e) | N (9) | N | ⋯ |
| NGC 7674W (35 mas) | 1 | 19.99 (e) | Y (8) | (maybe) | ⋯ |
| IRAS F03359+1523 | 3 | 7.94 (e) | N (6), unclear (4) | (maybe) | ⋯ |
| IRAS F03359+1523 (35 mas) | 3 | 7.94 (e) | N (6), unclear (4) | (maybe) | ⋯ |
| MCG +08−11−002 | 6 | 0.13 (g) | N (8), (g) | N | ⋯ |
| MCG +08−11−002 (35 mas) | 6 | 0.13 (g) | N (8), (g) | N | ⋯ |
Note. Column 1: galaxy name (†all galaxies refer to the 100 mas data unless specified otherwise). Column 2: merger classification adopted from Haan et al. (2011); see text for details. Column 3: nuclear separation between double nuclei, where detected. (Galaxies listed as "single" have only one kinematic nucleus known to us from this data set and the literature.) References: (a) Medling et al. (2014); (b) Medling et al. (2015b); (c) U et al. (2013); (d) this OSIRIS work; (e) Haan et al. (2011); (f) HST-ACS images; (g) Davies et al. (2016). Column 4: detection of any AGN signature. Y: AGN dominated; N: starburst dominated; Y(buried): obscured AGN; unclear: likely a composite. References: (1) Iwasawa et al. 2011; (2) Yuan et al. 2010; (3) Imanishi et al. 2016; (4) Vardoulaki et al. 2015; (5) Mudd et al. 2014; (6) Koss et al. 2013; (7) González-Martín et al. 2015; (8) Petric et al. 2011; (9) Cortijo-Ferrero et al. 2017). For NGC 7469, the southern nucleus is the one identified as a Seyfert. Column 5: detection of feedback signature in this OSIRIS work. Y: shock evidence from elevated H2/Brγ ratio (>2); (Y/maybe): kinematic signature of turbulent gas to be presented in forthcoming paper. Column 6: detection of feedback signature from the literature. (i) OH molecular outflows from Herschel Space Observatory (Veilleux et al. 2013); (ii) Na i D interstellar absorption from ground-based telescopes (Rupke et al. 2005a, 2005b); (iii) hot molecular gas observed with VLT/SINFONI (Emonts et al. 2017). Most studies cover a higher infrared luminosity range than is targeted here by our GOALS/KOALA survey, so the sample overlap only extends to ULIRGs.
Download table as: ASCIITypeset image
In the middle panels of Figure 8, we have plotted the dust-corrected nuclear SFR (top) and SFR surface density (bottom) on a logarithmic scale as a function of merger class. We see that the SFR appears to increase with merger class as the interacting galaxy pair coalesces at merger stages 5–6 (τ = 0.44 ± 0.004). This increase is consistent with the picture of a merger-induced starburst in the central kiloparsec region, as seen in simulations (e.g., Moreno et al. 2015), as well as in observations (e.g., Barrera-Ballesteros et al. 2015).
We consider the relation between the nuclear SFR (and ΣSFR) with the projected nuclear separation between the nuclei, if seen and resolved by observations, in the right panels of Figure 8. An enhancement in the SFR as the projected separation between the nuclei diminishes is evident in this plot (τ = −0.31 ± 0.04). The scatter in the relation may decrease if the separation is more accurately measured from dynamical modeling of the merger system and does not suffer from projection effects. We also caution that the projected nuclear separation is susceptible to instrument resolution. For instance, NGC 7674W is listed as having a companion ∼20 pc away (Haan et al. 2011), but Kharb et al. (2017) recently reported high angular resolution observations from the VLBA that resolve the main western nucleus into two radio cores 0.35 pc apart. It is possible that this system has undergone more than one major merger in the past, and it may be difficult to disentangle the effects of the various merging events without detailed dynamical modeling to assess timescales.
5.2. Shocked Gas among (U)LIRG Hosts
From our H2/Brγ maps, we have identified six of 22 galaxy nuclei that host shocked molecular gas. Five of the six ULIRGs plus one LIRG in our sample host shocked molecular gas in coherent structures (with H2/Brγ > 2; see Figure 6). The fact that shocks appear to be preferentially found in the more infrared luminous systems may be because ULIRGs have more powerful starbursts and more AGNs to heat the dense gas in the nuclear region. Wide-field optical IFS studies have found that the galaxy-wide shock fraction increases with merger stage (Monreal-Ibero et al. 2010; Rich et al. 2015), which also correlates with infrared luminosity. It is thus not surprising to find more shocked gas among the ULIRG hosts than in their less-luminous counterparts. However, our current study using a high angular resolution instrument such as OSIRIS has the unique ability to peer through the dust into the inner kiloparsec of the merging system. The shocked gas detected in this work may represent the smoking-gun signature of the more widespread shocks seen in larger IFS surveys (e.g., Rich et al. 2015; Ho et al. 2016), the connection between which is muddled by drastic differences across existing instrument resolutions and is yet to be thoroughly investigated.
The less-luminous exception, and arguably the most unequivocal case of shocked molecular gas in this sample, was found in the LIRG III Zw 035. As the only LIRG that shows spatially coherent, definitively shock-excited H2 gas, III Zw 035 has an unremarkable infrared luminosity of  at a redshift of 0.0278. It is classified as merger stage 3, with a nuclear separation of 5 kpc. The fact that it has a nondetection in the Swift-BAT hard X-ray bands (Koss et al. 2013) but exhibits Compton-thick AGN qualities in the Spitzer-IRS data (González-Martín et al. 2015) means that its center must be heavily obscured. It also has the most compact 33 GHz continuum emission (with a nuclear half-light radius of only 30 pc) among a sample of 22 local (U)LIRGs from the GOALS sample (Barcos-Muñoz et al. 2017).
5.3. Do AGNs Shock-heat the Molecular Gas?
Further, we want to investigate whether the detected shocks may be a manifestation of AGN- or starburst-driven feedback. We assemble AGN signatures from across the electromagnetic spectrum in Table 5. Among this sample, 12 of 21 systems have been observed by the Chandra X-ray Observatory either as part of GOALS or by other programs. Four are classified as AGN hosts from X-ray observations (UGC 05101, UGC 08058, UGC 08696, and VV 340a; Iwasawa et al. 2011; Ricci et al. 2017). Four additional galaxies are identified as AGN hosts via the detection of the [Ne v] 14.3 μm line in the mid-infrared Spitzer-IRS spectra (UGC 08387, NGC 2623, NGC 7469N, and NGC 7674W; Petric et al. 2011). Among these AGN hosts, UGC 05101, UGC 08696, and UGC 08058 have shocked molecular gas identified in this work. The proximity of the shocked gas to the central AGN may indicate AGN feedback as the source for the shock heating in those three cases.
On the other hand, VV 340a, UGC 8387, and NGC 7469N are three AGN hosts that do not show any signs of shocks or feedback. At an early stage of merging (stage 1; Haan et al. 2011), VV 340a hosts a Compton-thick AGN as detected by Chandra (Iwasawa et al. 2011). If the presence of shocks in (U)LIRGs is plausibly induced by galaxy interaction, the lack of a shock signature in VV 340a could suggest an upper limit on how early shock heating might take place in merging progenitors. In the case of UGC 8387, the OSIRIS data are incomplete in the coverage of the nucleus due to unfortunate observing conditions. A hint of low-velocity, excited H2 is present on the outskirts of the molecular gas disk, so more follow-up observations at the center of the Seyfert nucleus may be worthwhile. As for NGC 7469, the northern nucleus we show here is 26 kpc away from the Seyfert 1 source in the system, which does indeed feature biconical outflows traced by coronal lines (Müller-Sánchez et al. 2011). The remaining two AGN hosts (NGC 2623 and NGC 7674W) feature high-dispersion (≳150–200 km s−1) H2 gas that may be heated by AGN photoionization; a detailed study of the kinematics will be presented in a future paper.
We explore the relation between nuclear shocks and AGN strength more quantitatively in Figure 9. We adopt the average mid-infrared and bolometric AGN fractions computed from various Spitzer-IRS and other diagnostics in Díaz-Santos et al. (2017); see references therein. While the signature from shocked H2 is diluted in the mean H2/Brγ ratio relative to the corresponding maximum value, weak correlations between shocked gas and AGN strength measured in the mid-infrared and bolometrically are seen (Kendall's correlation coefficient τ ∼ 0.3, though generally insignificantly), suggesting that some of the observed shocks may be powered, at least in part, by AGNs in these nuclei. The scatter in these weak correlations can be attributed to patchy dust obscuration in the near-infrared wavelengths or the presence of other mechanisms at work to drive shock excitation.
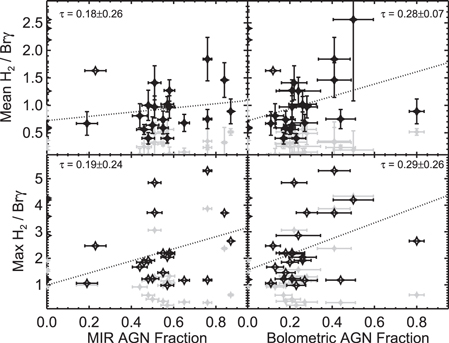
Figure 9. Mean (top) and maximum (bottom) H2/Brγ plotted as a function of mid-infrared (left) and bolometric (right) AGN fraction adopted from Díaz-Santos et al. (2017). Dotted lines are linear fits through the various sets of points, excluding those at zero AGN fraction. Kendall's correlation coefficient τ, along with its significance, is given in each panel. The filled gray stars represent the mean and maximum H2/Brγ values as determined from data that were rebinned to the lowest physical resolution of the sample and show an overall dilution, as expected from lower-resolution data.
Download figure:
Standard image High-resolution imageTo further verify the impact of spatial resolution on our results, we rebinned all the data to the lowest physical resolution present in the sample, e.g., that of IRAS F22491−1808 at 146.7 pc spaxel–1. The most important effect is the loss of the ability to visually identify resolved structures originally present in the sample but also to identify potential shocked gas, given how its peak signal is smoothed out. The quantitative influence from the degradation of angular resolution on peak H2/Brγ values is further shown as gray stars in Figure 9.
Our finding that nearly half of the AGN hosts exhibit shocked H2 suggests that AGNs may shock-heat the molecular gas, but it is not ubiquitous, and photoionization may also be important. Further, we cannot rule out the possibility that other mechanisms, such as cloud–cloud collisions or mechanical perturbations of the ISM, might also contribute to the shocks in these AGN hosts. We also find shocked gas in four non-AGN hosts that must have been excited by other ionizing sources. We will further discuss the impact of AGN- and starburst-driven winds on the ISM in a future paper.
5.4. Comparison with OH Gas
In Table 5, we record the detection of feedback signatures in other wavelength regimes in the literature. Molecular outflows in galaxy mergers have previously been identified in the longer far-infrared and millimeter wavelengths, for instance, using the OH 119 μm feature from observations taken with the Herschel Space Observatory (Veilleux et al. 2013). Due to differences in the target selections, there are only six ULIRGs in our overlapping sample. Of these, two sources (UGC 08696 and UGC 08058) exhibit OH outflows with median velocities of ∼−200 km s−1. These velocities agree very well with those of our molecular outflows seen in the near-infrared H2 transitions (U et al. 2013; Medling et al. 2015b). We do see outflowing gas in UGC 08696, though the S/N of our data cubes renders the case of UGC 08058 less conclusive.
Of the remaining four sources in our overlapping sample with Herschel observations, three have detected inflows based on redshifted OH absorption features with median velocity v50(abs) ≥ 50 km s−1: IRAS F22491−1808, IRAS F15250+3608, and IRAS F17207−0014. However, the spectral resolution of OSIRIS (Δv ∼ 80 km s−1) hinders our ability to detect slow, inflowing gas. As for IRAS F17207−0014, our in-depth analysis of the OSIRIS data set along with large-scale optical IFS data has revealed molecular gas dynamics that are more consistent with outflows (Medling et al. 2015b). The other discrepancy between our analysis and that of Veilleux et al. (2013) rests with UGC 05101, where we see shocked, highly turbulent molecular gas well in excess of 200 km s−1 emanating from the Seyfert nucleus, but only v50(abs) = −9 km s−1 was detected of the OH 119 μm feature. It is reasonable to explain this difference in terms of physical scales and the multiphase nature of outflows: it would be normal to have fast, warm outflows closer to the nuclei and slower, cool outflows spatially averaged over kiloparsec scales, which is where most of the outflowing mass would be. We note, however, that a maximum velocity vmax(abs) of −1200 km s−1 was reported in the Herschel work, which is among the fastest outflow velocities in that analysis.
5.5. Gas, Dust, and Star Formation in (U)LIRGs
In order to get a sense of how the ionized gas and dust content might correlate with the warm molecular gas and star formation in these dusty galaxies, we also compare the near-infrared diagnostic H2/Brγ with the mid-infrared line ratio H2/PAH extracted from Spitzer-IRS (Stierwalt et al. 2014) in Figure 10 for the 18 galaxies in our overlapping sample. (All of the galaxies in our sample have been observed with Spitzer-IRS, but only 18 of them, two with two separate observations at different plate scales, have detected the 7.7 μm PAH feature enabling the ensuing analysis. The mid-infrared numerator H2 incorporates the total line flux summed from the mid-infrared S0–S2 transitions. In cases where one of the H2 lines is a mere upper-limit detection, its error has been conservatively estimated at a level equal to its corresponding flux measurement and subsequently propagated into the error of the total H2 flux.) The H2/Brγ ratios are the clipped mean and maximum values (excluding outliers) within the central ≲400 pc region. The adopted H2/PAH values incorporate the H2 (S0–S2) transitions and the 7.7 μm PAH feature in the larger IRS slit (≲2 kpc).
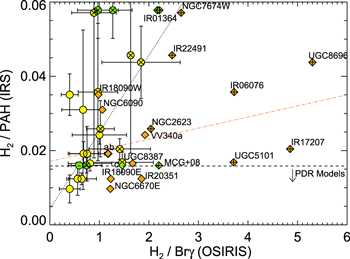
Figure 10. Comparison of the near-infrared diagnostic H2/Brγ from OSIRIS to mid-infrared line ratio H2/PAH from Spitzer-IRS from Stierwalt et al. (2014). Twenty systems in the overlap sample that have the 7.7 μm PAH feature detected are represented in this plot; each galaxy is plotted twice to illustrate the difference between the two derivation methods. The filled circles indicate the 3σ clipped mean H2/Brγ values with 1σ horizontal error bars; the large vertical error bars on four of the data points are due to the limited detection for one or more of the mid-infrared H2 lines in the IRS spectra. In contrast, the filled diamonds represent the maximum H2/Brγ values indicating the most highly excited spaxels in the resolved nuclear regions for the same galaxies. The crossed symbols signify those objects identified as shock candidates from the 2D H2/Brγ morphology. The nonparametric linear fit for the maximum-value diamonds (dot-dashed line) is flatter with larger scatter than that for the mean value circles (dotted line), indicating that while excited H2 can be seen in both the near- and mid-infrared diagnostics, high angular observations are necessary to pick out the shock-excited regions. The dashed line reflects the upper limit in H2/PAH explained by PDR models, above which another type of excitation, most likely shocks, will play a role. The green points indicate the two instances where an object is plotted twice for different plate scales: IRAS F01364−1042 and MCG +08–11–002. Sources a and b correspond to CGCG 436–030 (35 mas) and NGC 7469N, respectively, to clarify the particularly crowded points.
Download figure:
Standard image High-resolution image
Overall, the sample shows a correlation between the two diagnostic line ratios (as indicated by the dotted line in Figure 10, with a correlation coefficient τ = 0.40 and p-value of 0.0135); a correlation is expected because the H2 is likely to be excited by the same processes across the two wavelength regimes. The nonparametric generalized Kendall's τ and the Theil–Sen median-based linear model (implemented in the mblm R statistical package) were used for the correlation measurement and linear fitting, given their robust treatment of potential outliers. The scatter about the linear fit may be due to differences in patchy extinction in the nuclear regions and in the mismatched physical scales. Some scatter is also likely due to Brγ and PAH spatial variations, since the ionized gas and dust emission regions need not correlate on small scales, as was seen in Díaz-Santos et al. (2008, 2010) using high-resolution (04) mid-infrared Gemini/T-ReCS data.
Also shown on the plot are the outlier-excluded maximum H2/Brγ values for each galaxy; the variance in how much they are offset with respect to their average counterpart is challenging to predict based on integrated properties, but it highlights the importance of high angular resolution observations. The flatter fit with a negligible slope (τ = 0.21 and p-value of 0.194) between the H2/PAH values from integrated light through the IRS slit and the maximally enhanced excited OSIRIS spaxels suggests that shocked regions may be small and unresolved at 10'' (∼10 kpc) scales. Spatially resolving and quantifying the cooler gas and dust will require mid-infrared imaging or IFS observations using the upcoming JWST. Our OSIRIS shock candidates span a range in H2/PAH ratios, likely due to the fact that significant star formation, which could drive shocks and feedback, contributes to the PAH emission. We note that all of the identified shock candidates lie above the upper limit of H2/PAH expected from photodissociation region (PDR) models (see Stierwalt et al. 2014 for the adoption of this value in these H2 and PAH transitions).
6. Summary
We present high-resolution (0035–0100 spaxel–1, ∼40 pc spaxel–1) near-infrared AO-assisted integral field observations taken with Keck/OSIRIS for a sample of 21 nearby (z < 0.05) (U)LIRG systems (22 nuclei) from the KOALA-GOALS Survey. In particular, we focus on examining the nuclear SFR and identifying shocks using H2/Brγ as a tracer. We summarize our findings as follows.
- 1.Using H2 line ratio diagnostics, we find that the molecular gas in our sample of (U)LIRGs is more likely excited by thermal emission (from X-ray irradiation or shocks or a combination of both). Systems where we identified shocked gas based on excess H2 relative to Brγ gas reside on the diagnostic diagram nearest to that occupied by shock predictions.
- 2.We compute dust-corrected nuclear SFR and SFR surface density based on calibrated Brγ fluxes and find that the nuclear SFR correlates with merger class and diminishing nuclear separation. These trends are largely consistent with the picture of merger-induced starbursts within the central kiloparsec region of galaxy mergers.
- 3.Six of our sources (five ULIRGs and one LIRG) feature shocked molecular gas as identified by near-infrared diagnostic H2/Brγ > 2. Considering the infrared luminosity of these shock hosts, it appears that shocks are preferentially found in the ultraluminous systems but may also be triggered at an earlier merging stage.
- 4.Given that nearly half of the AGN hosts exhibit shocked H2, it is clear that on circumnuclear scales, AGNs have a strong effect on heating the surrounding molecular gas. However, the weak correlation between nuclear shocks and AGN strength indicates that it is not simply the relative strength of the AGN that drives the excess in warm H2. The coupling of the AGN power to the dense molecular gas is likely to be complicated and depends on orientation, dust shielding, density, and other factors. Shocks may also be triggered by cloud–cloud collisions or mechanical perturbations of the ISM.
- 5.The near- and mid-infrared diagnostics largely agree, since the warm and cooler H2 is expected to be excited by the same processes. Scatter about the relation may be due to differences in patchy extinction within the nuclei and also likely to Brγ and PAH, since the ionized gas and dust need not correlate at scales comparable to H ii regions. A detailed understanding of molecular gas physics will require spatially resolving and quantifying the cooler gas and dust components as enabled by our upcoming JWST Early Release Science observations (PI: Armus, ID 1328) in the future.
We thank the anonymous referee and the statistical editor for thoughtful suggestions that significantly improved our manuscript. We appreciate informative discussions with B. Groves and P. Creasey regarding photoionization models and wish to acknowledge helpful communication with D. Calzetti regarding dust extinction curves. We thank all of the Keck staff for help with carrying out the observations. The data presented herein were obtained at the W.M. Keck Observatory, which is operated as a scientific partnership among the California Institute of Technology, the University of California, and the National Aeronautics and Space Administration. The Observatory was made possible by the generous financial support of the W.M. Keck Foundation. The authors wish to recognize and acknowledge the very significant cultural role and reverence that the summit of Maunakea has always had within the indigenous Hawaiian community. We are most fortunate to have the opportunity to conduct observations from this mountain. We also acknowledge the Evans Remote Observing Room at UC Irvine for a number of the remote observing sessions carried out there.
VU acknowledges funding support from the University of California Chancellor's Postdoctoral Fellowship, JPL Contract/IRAC GTO grant No. 1256790, and NSF grant AST-1412693. Support for AMM is provided by NASA through Hubble Fellowship grant #HST-HF2-51377, awarded by the Space Telescope Science Institute, which is operated by the Association of Universities for Research in Astronomy, Inc., for NASA, under contract NAS5-26555. TD-S acknowledges support from ALMA-CONICYT project 31130005 and FONDECYT project 1151239. GCP acknowledges support from the University of Florida. This work was conducted in part at the Aspen Center for Physics, which is supported by NSF grant PHY-1607611; we thank the center for its hospitality during the Astrophysics of Massive Black Hole Mergers workshop in 2018 June and July. This research has made use of the NASA/IPAC Extragalactic Database (NED), which is operated by the Jet Propulsion Laboratory, California Institute of Technology, under contract with the National Aeronautics and Space Administration.
Facilities: Keck: I/II (OSIRIS - , AO). -
Appendix: Notes on Individual Objects
Here we include detailed notes on the individual galaxies as relevant for interpreting our OSIRIS maps.
A.1. UGC 08058
UGC 08058, or Mrk 231, is the most luminous ULIRG in GOALS and, hence, in this KOALA sample. As a bona fide QSO, it has been found to host molecular outflows as an indicator of AGN feedback in previous infrared and submillimeter work (Alatalo 2015; González-Alfonso et al. 2017). With velocities well exceeding 500 km s−1 ∼1 kpc away from the center, one might expect to see high-velocity gas close to the ionizing source in the central kpc region. However, the S/Ns in our emission lines are weak, as the near-infrared spectrum is dominated by the AGN continuum. Thus, we were not able to directly detect outflow signatures in the H2 or Brγ line kinematics close to the center, though a coherent region ∼250 pc SE of the nucleus is seen to feature elevated H2/Brγ ratios.
A.2. IRAS F17207−0014
IRAS F17207−0014 is a late-stage merging ULIRG with two kinematically distinct nuclei, the collision of whose ISM has likely induced shocks tracking the base of a collimated outflow (see details in our previous work in Medling et al. 2015b). High-resolution Plateau de Bure interferometer data also found a CO molecular outflow plausibly associated with a hidden AGN in the western nucleus, as suggested by García-Burillo et al. (2015). From the SFR map, we find that the sites for star formation as traced by Brγ are to the west of the outflow base.
A.3. UGC 08696
UGC 08696, or Mrk 273, is another ULIRG in the late-stage merging phases analyzed in detail in our previous work (U et al. 2013). We have found evidence for a molecular outflow originating from a plausible obscured AGN nucleus in the north (instead of from the X-ray-bright AGN nucleus in the southwest). The multiphase and multiscale nature of its outflow has been detailed in other studies of the warm and cold ionized and molecular gases (e.g., Rupke & Veilleux 2013; Veilleux et al. 2013; Cicone et al. 2014; Aladro et al. 2018). Here we can see that the outflow is traced by shocked H2 gas in the northern nucleus.
A.4. IRAS F22491−1808
IRAS F22491−1808 is a ULIRG system with two kinematically distinct nuclei in the K-band continuum and Paα emission approximately 2.2 kpc apart (see Paper I for a detailed flux and kinematics map of H2 and Paα). Since the H2 and Paα do not share the same kinematics, the presence of a strongly streaming or outflowing shocked gas has been conjectured. Indeed, H2 outflows have been detected by Emonts et al. (2017) from the eastern galaxy, which is the fainter component in the system and cospatial with our maximum H2/Brγ spaxels.
A.5. IRAS F15250+3608
IRAS F15250+3608 is the only galaxy in Paper I for which we did not see rotation in either stars or gas. There is potentially shocked H2 gas near the nucleus reaching a velocity dispersion upward of 150 km s−1, which could be worth follow-up observations to confirm.
A.6. UGC 05101
UGC 5101 features a Compton-thick AGN with strong mid-infrared (Armus et al. 2004, 2007) and X-ray signature (Imanishi et al. 2003; Ptak et al. 2003; González-Martín et al. 2009) but lacks optical signatures (Yuan et al. 2010). In our OSIRIS maps, the AGN continuum dominates, though H2 and Brγ emission both peak at the same location. The H2 gas is particularly bright near the nucleus, such that enhanced H2/Brγ spaxels can be seen coming out of the center and may be interpreted as a shock candidate.
A.7. VV 340a
VV 340a is at an early stage of merging as categorized in Haan et al. (2011). It hosts a Compton-thick AGN that was detected by Chandra but not by Swift-BAT (Iwasawa et al. 2011; Koss et al. 2013). Its large-scale disk features a solid dust lane, while its nuclear disk is seen in the continuum and H2 emission (see nuclear disk properties in Paper I). We see no coherent structure in the H2/Brγ map that could be associated with outflows, which, if warranted by the depth of the data, could place an upper limit on how early outflows are triggered in the nuclei of merging progenitors.
A.8. IRAS F01364−1042
IRAS F01364−1042 is a LIRG with a clear rotating gas disk detected in H2 and Paα as detailed in Paper I. In the 100 mas scale data, extended H2 to the south between the major and minor axis has been seen, lending potential support to an outflowing structure traced by H2. In the 35 mas scale data, the continuum is resolved into east–west extended emission with the enhanced H2/Brγ spaxels originating from the center. The spatial correlation of this excited molecular gas with prominent non-Keplerian motion and elevated velocity dispersion as mentioned in the text lends support that there could be molecular outflows present, to be confirmed by follow-up high angular resolution observations.
A.9. UGC 08387
UGC 08387, or IC 883, has been identified as an AGN host by the detection of the [Ne v] line from IRS spectra (Petric et al. 2011). A parsec-scale radio jet detected using VLBI further suggests that the nucleus plays host to AGN activity (Romero-Cañizales et al. 2017). Though the mosaicking of the nucleus of this galaxy is unfortunately incomplete due to observing conditions, we included the data analysis here for completeness. Even though the central AGN is not pictured within the frame, we see a hint of what may be low-velocity, excited H2 on the outskirts of the molecular gas disk. Due possibly to heating by AGN photoionization, the H2/Brγ map may indicate a layer of H2 gas heated by the Seyfert nucleus worthy of future follow-up observations perpendicular to the gas disk.
A.10. CGCG 436−030
CGCG 436−030 is an LIRG with a star-forming clump to the northwest of the nucleus, as demonstrated in its Brγ flux map well modeled in Paper I. In this galaxy, the H2 gas is relatively weak and does not appear to be shock-heated by the nearby star-forming clump. Both H2 and Brγ display rotational kinematic signatures that follow each other fairly consistently.
A.11. NGC 6670E
NGC 6670E is the eastern component of a merging galaxy pair with a companion ∼17 kpc away (see resolved X-ray emission in Mudd et al. 2014), but the measured separation between the two nuclei as detected in H-band HST-NICMOS images within the eastern galaxy is ∼1 kpc (Haan et al. 2011). There are two caveats regarding the analysis of this galaxy: (1) the OSIRIS data analyzed in this work were taken after Paper I was published, and thus we do not yet have the quantitative properties of the nuclear disks; and (2) this was one of three nuclei for which we did not have proper calibration frames of our standard stars, and thus we were unable to flux-calibrate this galaxy in the consistent manner we did the others. For this reason, the units on the continuum, H2, and Brγ maps are not properly displayed, and the intensity of the line and continuum should be treated in relative units. We were also unable to produce an SFR map, since we did not have a properly calibrated map of the Brγ luminosity.
Nonetheless, it is interesting that the gas peaks for both H2 and Brγ are displaced from the main continuum peak, residing instead at an off-nucleus star-forming clump ∼200 pc west of the K-band continuum peak. The H2 does not appear to be excited, though it displays high velocity dispersion that may be traced to the gas peak and could be a candidate for star formation–driven outflows in future studies.
A.12. IRAS F06076−2139N
IRAS F06076 is a system of two clearly distinct galaxies with a projected nuclear separation of ∼6.7 kpc according to HST-ACS imaging. Large-scale, optical IFS data from VLT/VIMOS show that at low-intermediate masses and with projected velocities of ∼550 km s−1, the two galaxies are unlikely to ever merge (Arribas et al. 2008). The northern nucleus, which is the one our OSIRIS FOV covers, is dominated by star formation, as indicated by the optical line ratio and velocity dispersion (Rich et al. 2015). Our 35 mas data resolve the K-band continuum emission into two peaks and illustrate that the Brγ gas is extended over this region. The H2 gas is more concentrated at the continuum peaks, with a velocity dispersion of ∼110 km s−1 in this inner 200 pc region.
A.13. IRAS F18090+0130E/W
IRAS F18090+0130 hosts two progenitor galaxies 49 kpc apart (Haan et al. 2011). At the early stage of merging, this system was observed but not detected in Swift-BAT (Koss et al. 2013). The OSIRIS observations here provide a baseline of what early-stage galaxy mergers may feature before they become morphologically disturbed: the extended continuum is resolved into what appear like spiral arms well traced by the gas in both nuclei. Both the molecular and ionized gas appears extended but not heated, given the lack of significant nuclear activity in the respective regions. Like NGC 6670E, we lacked proper calibration frames for these galaxies and thus were unable to flux-calibrate the OSIRIS data.
A.14. III Zw 035
The galaxy III Zw 035 is an LIRG that shows strong extension in H2 emission along the minor axis of the galaxy coupled with non-Keplerian kinematics and enhanced velocity dispersion in the same region. The 100 mas scale data show a hint of this extension in the H2 maps, but the molecular outflow is best resolved in the 35 mas scale maps in Figure 3. The H2 peak is not only displaced from that of the K-band continuum but is shown to be shock-excited in a coherent region in the H2/Brγ map.
A.15. IRAS F20351+2521
IRAS F20351+2521 is an LIRG with galactic-scale spiral arms that feed into the clumpy nature as sampled within the OSIRIS FOV. As was found in Paper I, its H2 and Brγ emission show similar kinematics, as this early-stage LIRG shows no sign of outflowing or shock-heated gas.
A.16. NGC 2623
NGC 2623, a well-studied LIRG hosting both off-nuclear star clusters and an AGN, represents a prototypical advanced merger with twin tidal tails extending from a single nucleus (Sanders et al. 2003; Evans et al. 2008). Its K-band IFS data feature smooth flux profiles and kinematically rotating kinematics in all tracers (Paper I). Its H2 gas is extended relative to the Brγ emission and may have a hint of >150 km s−1 dispersion of H2 gas along the minor axis of the rotating disk. It is a potential outflow candidate to be resolved by higher-resolution data in the future.
A.17. NGC 7469N
NGC 7469 is a Seyfert 1 system with a disturbed companion ∼26 kpc away. It features an ∼107 M⊙ black hole measured virially from reverberation mapping (Peterson et al. 2014) surrounded by a star-forming ring (Díaz-Santos et al. 2007). The southern nucleus features coronal-line biconical outflows (see details in Müller-Sánchez et al. 2011). Here we have imaged the northern component of this merger system with OSIRIS. At 0035 spaxel–1 resolution, the nucleus appears compact with extended diffuse emission in the K-band continuum. Interestingly, the peak of the Brγ flux is offset (∼02, or 65 pc) from the continuum peak; its rotational kinematics likely signifies an off-nucleus star cluster rather than outflowing ionized gas.
A.18. NGC 6090
NGC 6090 has a companion nucleus 4 kpc away (Haan et al. 2011). The main nucleus that we targeted with OSIRIS features large-scale spiral arms traced primarily by Brγ flux as star formation sites. Chisholm et al. (2016) detected a galactic outflow with a mass outflow rate of 2.3 M⊙ yr−1 using the HST Cosmic Origins Spectrograph. As noted in Paper I, extracting kinematic information for the gas has proven to be challenging, given the relative lack of gas in the near-infrared range. The H2/Brγ line ratio map also provides no evidence for the presence of shocked gas in this nucleus.
A.19. NGC 7674W
NGC 7674W is a famous Seyfert galaxy recently found to be a subparsec binary black hole candidate with a projected nuclear separation of 0.35 pc between radio cores (Kharb et al. 2017). It also has a companion 20 kpc away (Haan et al. 2011). Its K-band continuum emission is compact, while the Brγ gas emission is extended. There is a relative lack of H2 at the peak of the K-band continuum, possibly masked by strong [Si vi] emission at that location. While the H2/Brγ ratio does not reach the canonical value of 2 for shocks, it does appear enhanced in a coherent region that also features highly dispersed (≳200 km s−1) gas. This gas is likely heated by photoionization by the AGN in the nucleus; a detailed study of the kinematics will follow.
A.20. IRAS F03359+1523
IRAS F03359+1523 is an early-stage merger with a large, nearly edge-on disk that has yet to be disrupted (as evidenced by the analysis of the 100 mas data in Paper I). Here we zoom into the nucleus of the galaxy with 35 mas data. The distribution of the continuum and gas are consistent with the larger-scale data. However, the higher-resolution data show that enhanced H2/Brγ may correlate with a region of high H2 velocity dispersion (∼200 cm s−1), even though the gas has not yet reached our conservative shock threshold.
A.21. MCG +08−11−002
MCG +08−11−002 is a late-stage merging LIRG with two distinct clumps, with the ages of its stellar clusters thoroughly analyzed in our previous work (Davies et al. 2016). The extended Brγ emission relative to that of the K-band continuum illustrates the strong and clumpy nuclear star formation (Paper I). In the finer-resolution 35 mas data taken since Paper I, the two continuum peaks are better resolved to a separation of 110 pc. The Brγ emission traces the bright but more extended continuum nucleus in the northeastern direction, leaving the compact continuum peak, likely a star cluster, void of ionized gas. The H2 gas seems to concentrate on the compact star cluster, but we see no evidence for shocked or outflowing molecular gas from the OSIRIS data.