


Abstract
We explore the spiral arm structural properties in a large variety of simulated galaxy systems. We study spiral arms arising from isolated barred and unbarred galaxies, as well as from interactions with small satellites. In all these first models, galactic systems are all embedded in a spherical dark matter halo. We also study spiral arms arising from a galactic system embedded in a triaxial dark matter halo. Simulations used in this work have been obtained by using different N-body codes and initial conditions techniques. Our strategy is to study the 3D arm structure through the analysis of pitch angle, along/transverse/vertical density laws and their corresponding scale lengths, and spiral lifetime. Our main results are as follows. First, the radial density profile of all spiral arms analyzed in this work is exponential. This profile resembles the one of the disk but with a scale length that is systematically larger (5%–40%). This result suggests that spiral arm gravitational influence is important beyond the scale radius of the disk. Second, the vertical and transversal density laws of the spiral arms follow a sech2. The vertical scale length is compatible with the one of the disk; this is observed in all spiral arms analyzed here, independently of their origin, i.e., bar, high-order disk perturbation, tidal interaction with satellites, or halo triaxiality. Third, in the triaxial and satellite simulations, spiral arms follow a logarithmic locus all through their lifetime; the remaining models develop transient, recurrent, and short-lived spirals with a nondefined locus. In all cases, spiral arms wind up in their lifetime with a small pitch angle reduction. It is common that newborn spirals inherit the pitch angle of the previous ones; this result challenges the dynamical relevance of arm evolution. Finally, from the analysis of public photometric observations of NGC 2543, we state that the properties of observed spiral arm structure can be consistent with our conclusions. Further and systematic comparisons with observations are needed in order to confirm our results.
Export citation and abstract BibTeX RIS
1. Introduction
It is well known that several processes can induce the formation of spiral arms in disk galaxies: among others, bars (e.g., Sellwood & Sparke 1988), tidal interactions (e.g., Toomre & Toomre 1972; Oh et al. 2008; Dobbs et al. 2010; Struck et al. 2011; Semczuk et al. 2017), triaxial dark matter halos (Bekki & Freeman 2002; Valenzuela et al. 2014; Butenko et al. 2015), and other intrinsic disk instabilities (e.g., Lin & Shu 1964). However, the understanding of such structures' nature, i.e., evolution, dynamics, and detailed 3D density structure, has been elusive, despite of decades of efforts.
The most acknowledged hypothesis to explain the existence and persistence of spiral arms is the one that describes them as quasi-stationary density waves with a constant pattern speed (Lin & Shu 1964; Bertin & Lin 1996); in this scenario, the spiral arms are self-induced by density waves in globally stable disks, and the pattern speed and structural characteristics of the spiral arms are stable in long timescales. It is well known now that the quasi-stationary hypothesis requires mechanisms to amplify the effect that maintains the waves (Mark 1976), since the tight winding waves experience rapid radial dispersion that propagates with the group velocity (Toomre 1969); these kinds of waves would be absorbed in the Lindblad resonances (Lynden-Bell & Kalnajs 1972). However, a feedback cycle produced by the Q-barrier reflecting a propagating wave might cause spiral modes to live longer (Bertin et al. 1989a, 1989b; Thomasson et al. 1990; Elmegreen & Thomasson 1993; Saha & Elmegreen 2016), but the wave is not steady (Sellwood 2011).
On the other hand, the vast majority of pure N-body simulations show that spiral arms are rather transient features that fade away in timescales of a few rotational periods, particularly, the ones produced intrinsically (i.e., by nonexternal induced sources such as bars, etc.; Sellwood & Carlberg 1984; Sellwood & Binney 2002; Fuchs et al. 2005; Baba et al. 2009; Sellwood & Carlberg 2014). In these cases, a scenario that has been invoked to explain the continuous regeneration of modes from small perturbations is the swing amplification mechanism (Goldreich & Lynden-Bell 1965; Julian & Toomre 1966; Toomre 1981). Other plausible mechanisms to achieve the production of longer-lasting spiral arms might be the use of cooling gas, like in simulations (Sellwood & Carlberg 1984); in this scenario, new dynamically cold-born stars (low velocity dispersion) are added into the simulations at a constant rate, giving place to long-lasting spiral arms. Furthermore, Fujii et al. (2011) showed that, although stellar spiral arms are transient, they form recurrently in such a way that disks possess arms all the time (Sellwood 2011).
We are now facing an exciting time when computers are able to solve complex N-body high-resolution simulations that allow the possibility of studying in fair detail the spiral arms (Baba et al. 2013; D'Onghia et al. 2013; Roca-Fàbrega et al. 2013) that traditionally had been almost neglected in a number of galactic studies, not necessarily because of their allegedly low mass, but rather because it was impossible to elucidate their physical characteristics due to the lack of resolution in self-consistent simulations.
In this work, we present a series of high quality resolution N-body simulations that allow us to study spiral arms in detail in different scenarios: spirals induced by the intrinsic modes of a disk (i.e., no perturber), a bar, an interaction (satellite), or a triaxial halo. For consistency purposes, we have also employed two different N-body codes. The aim of this work is to shed some light on the understanding of the effective dynamical influence of spiral arms as they evolve (are born, grow, and vanish) and to address some specific questions, such as: are the pitch angles of spiral arms the same through time (i.e., do they corotate, or are they rigid)? If they corotate, how much does the pitch angle really diminish before the arms are destroyed, and how fast does this happen (which is of great importance to the dynamical effect of the spiral arms on the disk)? If they are rigid, what happens with newborn spiral arms; are they born with the same pitch angle every time? How is the three-dimensional structure of the arms (density falls along the radial, azimuthals and transversal directions)? How are the density contrast, mass, etc. We finally compare some of our results with observed galaxies, where possible.
This paper has been organized as follows. In Section 2.1, we describe the numerical methods and simulations; in Section 2.2, we present the analysis methods and tools; and in Section 3 we present our results and a full discussion. Finally, in Section 4, we present our main conclusions.
2. Numerical Methods
2.1. N-body Simulations
In this work, we employ a set of simulations that includes models presented in Roca-Fàbrega et al. (2013); see Table 1 for further details on the model U1 and B1 parameters and a set of new simulations. The new models include isolated barred models that explore slightly different parameters from the ones in Roca-Fàbrega et al. (2013): an interacting disk galaxy and a self-consistent stellar disk inside a triaxial dark matter halo. All simulations presented here have been performed using either the GADGET (Springel 2005) or the ART (Kravtsov et al. 1997; Kravtsov 2003) codes. Initial conditions (ICs) in spherical halo models were generated following the Hernquist moments method (Hernquist 1993) and the Widrow & Dubinski (2005) distribution function method. The model with a triaxial dark matter halo has been obtained by using the Rodionov iterative method (Rodionov et al. 2009; Rodionov & Athanassoula 2011). The halo profile is a Navarro–Frenk–White (NFW; Navarro et al. 1997) with semiaxis ratios of b/a = 0.83 and c/a = 0.67. The spatial resolution ranges from 11 pc in the ART simulations to, in the triaxial GADGET case, 35 pc in the rest of the GADGET models. All galactic models have evolved at least 3 Gyr, and by this time, they have already produced spiral arms. Spiral arms have been produced through different mechanisms, depending on the properties of the simulated system, i.e., a central bar perturbation, other intrinsic disk instabilities, satellite interactions, and triaxial dark matter halo effects.
Table 1. Galaxy Models
| Parameter | U1 | B1 | Gu1/Gu4 | Gb4 | GT4 |
|---|---|---|---|---|---|
| Md [1010 M⊙] | 3.75 | 5.0 | 3.75 | 4.68 | 4.00 |
| Rd [kpc] | 4.00 | 3.86 | 4.00 | 3.86 | 3.50 |
| zo [kpc] | 0.20 | 0.20 | 0.20 | 0.20 | 0.20 |
| Nd [×106] | 1 | 1 | 1/4 | 4 | 4 |
| rout [kpc] | 298.9 | 291.9 | 240 | 220 | 228 |
| v0 [km s−1] | ⋯ | ⋯ | 4.83 | 3.20 | ⋯ |
| a [kpc] | 16.61 | 29.19 | 16.6 | 16.6 | 16.6 |
| Mh [1012 M⊙] | 1.5 | 1.38 | ⋯ | ⋯ | 0.75 |
| Nh [×107] | 4.1* | 2.86* | 1 | 1 | 1 |
Download table as: ASCIITypeset image
Aiming to understand how satellite interaction affects the formation and evolution of nonaxisymmetric structures, we have generated a new model based on U1 but with the addition of a companion satellite. We have decided to use model U1 in order to distinguish among the different trigger mechanisms of spiral arm formation. Model U1 does not develop a strong bar, and only a few short-lived spiral arms are generated in the disk (see Roca-Fàbrega et al. 2013).
The satellite ICs have been generated using the same procedure as for the main galaxy but changing the initial parameters: a smaller and ∼100 times less massive stellar disk and spherical dark matter halo (see Table 1). All of the satellite particles have the same mass. Once generated, the satellite particles have been added to the main galaxy simulation box (U1 model) at different locations and initial velocities in order to test the impact of the satellite orbital parameters in the outcome (see Table 2).
2.2. Analysis Methods
In this section, we explain in detail the techniques employed to obtain our main results. We also expose how the diagrams shown throughout the paper have been obtained.
2.2.1. Pitch Angle
To enhance the overdensity structure, we estimated the surface density over a polar grid. At every cell in the grid, we subtracted the azimuthal average density corresponding to its radial position, and we normalized the result by the same azimuthal average density value. In every simulation, we searched for a strong arm structure and kept track of it forward and backward in time until the structure vanished. We fitted a logarithmic function that matched the arm structure at three different snapshots: when the arm is born, when it reaches its peak strength, and when it disappears.
Figure 1 shows that by applying these techniques, we are able to (a) quantify the pitch angle from the very start of its formation until it has vanished and (b) estimate the pitch angle of different newborn strong arms within the same simulation.
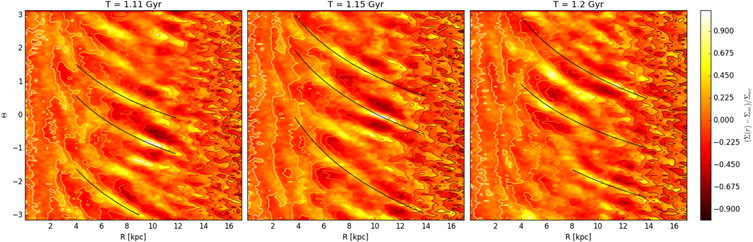
Figure 1. Arm density contrast in polar coordinates for an example of a barless GADGET simulation (Gu1). Contours show the surface disk density. Different boxes show the evolution for three different arms of the same simulation during 100 Myr. Lines represent the logarithmic loci fitting to the arm.
Download figure:
Standard image High-resolution image2.2.2. Spiral Arm Radial Density Law and Scale Lengths
To estimate the scale length of the arm, we selected the density maxima at each radius. At each annulus of the polar ring, we separate the arm contribution by subtracting the azimuthal average surface density at each radius to finally find that the arm contribution and the azimuthal average surface density follow an exponential function (e.g., Figure 2).
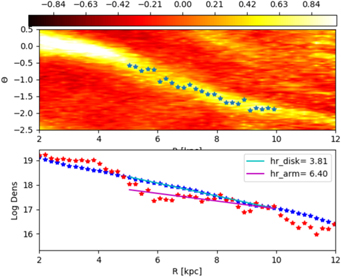
Figure 2. In the top panel, we show the surface density map in polar coordinates with a color scale. The stars mark the position of the maxima density along a given arm. The bottom panel shows the density of the axisymmetric disk (blue stars), the density of the arm (red stars), and their respective exponential fits (blue and red lines, respectively).
Download figure:
Standard image High-resolution image2.2.3. Spiral Arm Vertical and Transversal Density Profiles
In order to study the 3D structure of spiral arms, we need to assess the vertical and transversal density laws. We calculate the particle density using a spherical constant-density kernel, including the 30 nearest neighbors.
To characterize the transversal/vertical structure of the spiral arms, for simplicity, we define the transversal/vertical direction of the arm as the corresponding direction of the ring that intersects the spiral. We proceed to subtract a symmetrized version of the disk density inside this ring. After this procedure, we consider the density residuals as the spiral arm's contribution. Finally, we build the density profile along the transversal/vertical directions (see Figure 3).
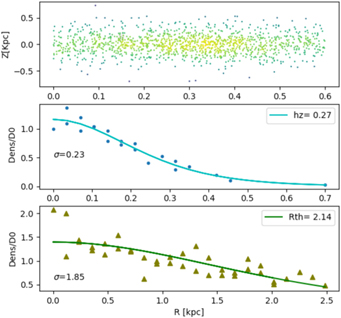
Figure 3. The top panel shows the transversal position of the particles corresponding to the arm (i.e., after subtracting the disk contribution). The middle and bottom panels show the density profile in the vertical and transversal directions, respectively, and their corresponding sech2 fittings (blue and green curves).
Download figure:
Standard image High-resolution image3. Results
In this section, we present a thorough study of the morphology of spiral arms in the high-resolution N-body simulations presented above. We present studies of spiral arms with different origins for the following quantities: a density fall along the transversal and perpendicular directions to the plane of the spiral arms, scale radii in three directions, and pitch angles. We also investigate whether newborn arms, in the recurrent spiral arm formation scenario observed all through the models analyzed here, share similar (or not) characteristics with the foregoing arms in disk galaxy simulations. We also analyze some spiral arm properties in photometric observations of the galaxy NGC 2543 (Figure 16).
3.1. Spiral Arms Self-induced in Nonbarred, Spherical Halo, Isolated Galaxies
In general, spiral arms in isolated simulations with spherical halos show arms that rip and vanish quickly after less than a galactic rotation. By the time the first arms vanish, new arms are already forming in such a way that the disk always presents strong spiral arms coexisting with weak fading arms. In this work, we fit a logarithmic spiral only to strong and well-defined spiral arms. Our fitting strategy is to locate the density peak of the spiral as a function of radius. In order to properly locate the spiral arm density peak, we analyze overdensities in the disk surface density after subtracting the radial average density (see Section 2.2 and Figure 4). In most cases, the fit has been performed only over the arm section with higher-density contrast. High-density contrast sections usually span a few kpc. In particular, these simulations that have no large-scale mechanism inducing spiral arm formation (i.e., bars, triaxial halos, or satellite interactions) show more fragmented arms with smaller-density contrast. These arms are highly transient and also show shorter lifetimes than the ones induced by large-scale mechanisms.
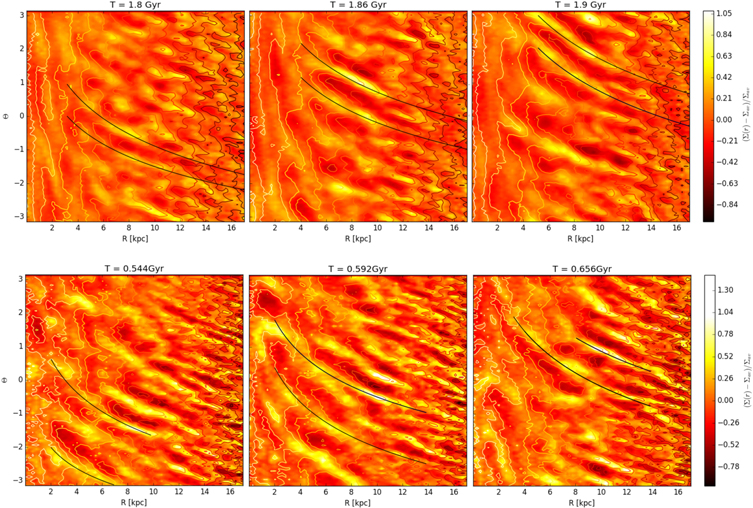
Figure 4. Arm density contrast in polar coordinates of unbarred GADGET 3 (top) and ART (bottom) simulations. Different panels (left to right) show temporal evolution. The time is labeled at the top of each panel.
Download figure:
Standard image High-resolution imageTable 2. Satellite Parameters in ART Simulations
| Parameter | U1S1 | U1S2 |
|---|---|---|
| Disk mass [109 M⊙] | 1.3 | 1.3 |
| Halo mass [1010 M⊙] | 3.5 | 3.5 |
| Disk exp. length Rd [kpc] | 1.0 | 1.0 |
| Disk sech2 height Zd [kpc] | 0.1 | 0.1 |
| Halo NFW Rd [kpc] | 25.0 | 25.0 |
| Halo concentration | 12 | 12 |
| N*,disk (104) | 5.0 | 5.0 |
| Ntot (106) | 1.3 | 1.3 |
| xini [kpc] | 150.0 | 150.0 |
| yini [kpc] | 25.0 | 0.0 |
| zini [kpc] | 50.0 | 50.0 |
| vx,ini [km s−1] | −50.0 | −100.0 |
| vy,ini [km s−1] | 150.0 | 25.0 |
| vz,ini [km s−1] | 0.0 | −25.0 |
Note. Orbital parameters have been computed relative to the position of the main galaxy and its mean velocity.
Download table as: ASCIITypeset image
Our results also show that in this scenario, the pitch angle of the spiral arms deviates just a few degrees, winding up at less than 8° before losing strength or ripping up. This can be seen in Figure 4. In this figure, we show how spiral arms in unbarred systems (U1, GU1, GU4) almost keep the pitch angle for all of their lifetime. This happens recurrently in the disk in all newly generated spiral arms, regardless of the simulation code (see U1, GU1, and GU4 in Table 3). This means that, even when there is a winding up (i.e., an effective reduction of the pitch angle), the reduction is very small prior to the dissolution of the spiral arm. Also, the amplitude density of the spiral arms reduces promptly as the pitch slightly decreases.
Table 3. Measures of Pitch Angles of Different Arms along the Simulations of Isolated Disks in a Spherical Halo
| Model | Time | Pitch | Hr | Hz | Ht |

|
||
|---|---|---|---|---|---|---|---|---|
| (Gyr) | (1) | (2) | (3) | (kpc) | (kpc) | (kpc) | ||
| U1 | 0.096 | 38.0 | 38.0 | ⋯ | ⋯ | ⋯ | ⋯ | ⋯ |
| 0.16 | 28.5 | 28.5 | ⋯ | 4.2 | 0.2 | 2.45 | 1.46 | |
| 0.24 | 28.0 | 28.0 | ⋯ | ⋯ | ⋯ | ⋯ | ⋯ | |
| 0.544 | 48.0 | 35.0 | ⋯ | 7.46 | 0.19 | 1.19 | 2.10 | |
| 0.592 | 35.0 | 33.0 | 34.0 | ⋯ | ⋯ | ⋯ | ⋯ | |
| 0.656 | 29.0 | 28.7 | ⋯ | 7.99 | 0.19 | 1.19 | 2.17 | |
| 2.48 | 33.5 | 39.0 | ⋯ | 5.22 | 0.27 | 2.48 | 1.66 | |
| 2.368 | 33.5 | 32.0 | 32.0 | ⋯ | ⋯ | ⋯ | ⋯ | |
| 2.528 | 34.5 | 32.5 | 32.5 | 3.91 | 0.24 | 2.17 | 1.66 | |
| B1 | 0.256 | 26.5 | 26.5 | 22.5 | 4.13 | 0.22 | 2.71 | 1.77 |
| 0.352 | 32.0 | 32.0 | 28.0 | 3.72 | 0.24 | 8.89 | 1.86 | |
| 0.592 | 56.0 | 56.0 | 13.0 | 3.86 | 0.21 | 1.15 | 3.62 | |
| 0.688 | 57.0 | 46.0 | ⋯ | 13.1 | 0.19 | 1.8 | 3.27 | |
| 0.72 | 47.0 | 37.0 | 40.5 | 10.7 | 0.19 | 2.7 | 3.38 | |
| GU1 | 0.54 | 30.0 | 30.0 | 32.0 | 4.03 | 0.21 | 1.1 | 1.74 |
| 0.6 | 33.0 | 25.0 | 25.0 | ⋯ | ⋯ | ⋯ | ⋯ | |
| 0.64 | 25.0 | 30.0 | 38.0 | 6.83 | 0.2 | 0.83 | 1.8 | |
| 1.11 | 32.0 | 34.0 | 30.0 | ⋯ | ⋯ | ⋯ | ⋯ | |
| 1.15 | 24.5 | 27.5 | 28.5 | 7.85 | 0.21 | 0.78 | 1.98 | |
| 1.2 | 27.0 | 33.0 | 33.0 | ⋯ | ⋯ | ⋯ | ⋯ | |
| GU4 | 0.95 | 29.0 | 29.5 | 24.0 | 9.18 | 0.24 | 0.88 | 1.50 |
| 1.0 | 37.0 | 27.0 | 27.0 | ⋯ | ⋯ | ⋯ | ⋯ | |
| 1.05 | 29.0 | 27.0 | ⋯ | 5.95 | 0.21 | 1.22 | 1.82 | |
| 1.8 | 32.0 | 37.5 | ⋯ | ⋯ | ⋯ | ⋯ | ⋯ | |
| 1.86 | 32.0 | 34.0 | ⋯ | 7.72 | 0.2 | 1.05 | 1.7 | |
| 1.9 | 27.0 | 27.0 | ⋯ | 5.20 | 0.65 | 1.36 | ⋯ | |
| 2.34 | 30.0 | 30.0 | ⋯ | 6.43 | 0.21 | 1.71 | 1.54 | |
| GB4 | 0.68 | 25.0 | 26.0 | 26.0 | ⋯ | ⋯ | ⋯ | ⋯ |
| 0.78 | 20.0 | 23.0 | 23.0 | 6.97 | 0.65 | 4.29 | 1.62 | |
| 0.95 | 21.0 | 23.0 | 22.5 | ⋯ | ⋯ | ⋯ | ⋯ | |
| 1.1–1.7 | Buckling | |||||||
| 1.8 | 37.5 | 37.5 | ⋯ | 3.78 | 0.28 | 0.94 | 1.93 | |
| 1.9 | 33.5 | 31.0 | ⋯ | 8.57 | 0.24 | 1.74 | 1.62 | |
| 2.05 | 33.5 | 31.0 | ⋯ | 4.2 | ⋯ | ⋯ | 1.68 | |
| 2.75 | 30.0 | 39.0 | 39.0 | ⋯ | ⋯ | ⋯ | ⋯ | |
| 2.82 | 31.0 | 40.0 | 40.0 | 5.27 | 0.24 | 2.68 | 2.13 | |
| 2.9 | 33.0 | 36.0 | 36.0 | ⋯ | ⋯ | ⋯ | ⋯ | |
Note. Radial, vertical, and transversal scale length was measured in just one of the arms at the respective time.
Download table as: ASCIITypeset image
In Figure 5, we show a zoom of the density structure in polar coordinates for four spiral arms taken at different times of the U1 and GU1 simulations. The upper panels show the surface density in polar coordinates. The lower panels show the disk density radial profile (blue stars) and spiral arm density profile (red stars); solid cyan and purple lines show the best exponential for disk and spirals, respectively. Spiral arms, as well as the disk, have a clear density exponential fall, but the scale radius is larger for the spiral arms than for the disk in all cases (see the scale radius in kpc in the legend in the bottom panels). This result indicates that the spiral arms are gravitationally and dynamically relevant far beyond the scale radius of the disk.

Figure 5. In this figure, we show four mosaics for the four spiral arms taken at different times (left to right) of two simulations. The upper panels are zooms of the surface density in polar coordinates of the arms. The lower panels of the four mosaics represent the density fall along the respective spiral arm, where blue stars represent the disk (with the fit in cyan) and red stars represent the arms (with the fit in purple); the scale length is provided in all cases on the top right box inside these panels. The two upper panels were performed with GADGET 3 simulations and the two lower panels with ART simulations.
Download figure:
Standard image High-resolution imageFigure 6 corresponds to the vertical and transversal density profiles for the four spiral arms shown in Figure 5. The first panel of each mosaic is the same radial density scale presented in Figure 5, included here for reference purposes. The second and third panels of each mosaic show the vertical (i.e., perpendicular to the plane of the disk) and transversal density profiles of the respective spiral arm. In all panels of this figure, we present the best fit in solid curves and the respective standard deviation (σ). Scale length is indicated in the legend in each plot (all values in kpc). In these diagrams, we show that all arms have a vertical density profile that agrees with a sech2 in the vertical and transversal directions, while for the radial component, i.e., along the spiral arm, an exponential fall provides the best fit. The scale length of the vertical component of the spiral arm is roughly similar to the corresponding one for the disk.
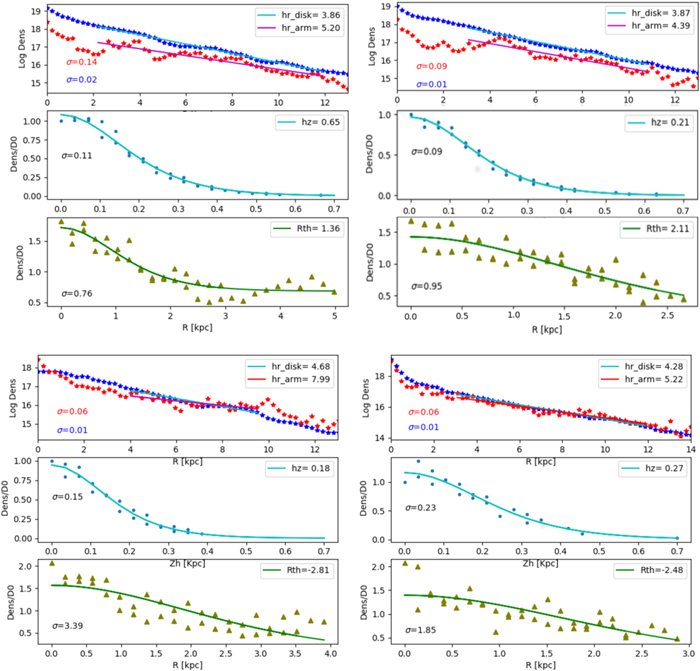
Figure 6. Same spiral arms as in Figure 5. The upper panels of each mosaic correspond to the radial density structure (same as in Figure 5). The middle and lower panels of each mosaic represent the density profile (and its fit; solid curves) of the vertical and transversal components for the respective spiral arms. The scale length is provided in all cases in the upper right of the panel, and the standard deviation is given to the left (σ). The two upper mosaics were performed with GADGET 3 simulations and the two lower mosaics with ART simulations.
Download figure:
Standard image High-resolution imageFinally, we have calculated a density contrast for the spiral arms versus the disk in these nonbarred, spherical halo, isolated simulations. We find that the maximum surface density contrast of the spiral arms is higher by a factor of ∼2.1 with respect to the mean disk density. For a quantitative summary of the parameters obtained in this study, see Table 3.
3.2. Spiral Arms Induced by a Bar in a Spherical Halo
As mentioned in the previous section, in general, spiral arms in the isolated simulations with spherical halos show arms that rip and vanish—in the nonbarred case, swiftly after less than a rotation to the galaxy. On the other hand, in the barred cases, some of the arms last a few rotations. In the barred simulations, the arms are connected and disconnected continually from the bar; some of them seem to be reinforced when the bar rotates half its period and again finds those arms and reconnects with them, again producing a spiral arm with a similar structure as the original (in pitch and density contrast). These types of arms are stronger and slightly more long-lasting than those in the nonbarred, spherical halo cases of Section 3.1. Some other arms are disconnected and slightly shifted outward; those arms will wind up and vanish quickly. Unlike the self-induced spiral arm case, in barred simulations, arms tend to conserve their pitch angle for longer times, as long as they are connected to the bar (this specific timescale depends on the physical characteristics of the bar, such as its mass and size). As soon as they disconnect from the bar, the ones that are not reinforced by the bar again wind up quickly and fade away. These results agree with the findings presented in Roca-Fàbrega et al. (2013).
An interesting feature we found in these simulations was the differences in the spiral arm characteristics before and after the buckling that show up in the first 3 Gyr. Before the buckling, we measure the pitch angles of four spiral arms at different times in the simulation previous to the buckling and find that the four different arms have pitch angles of approximately 26° that wind up a few degrees (with a maximum of 5°). However, after the buckling, we perform the same calculations over four different arms and obtain a systematic increase of the pitches for each one of around 10°. Preliminary analysis shows that this might be due to a redistribution of the mass of the bar (maybe an increase in the bar radial scale length) and the angular momentum. Such behavior is consistent with the discussion in Roca-Fàbrega et al. (2013), where spiral arms rotate rigidly with strong bars and wind up with weaker bars like the buckled ones. A careful study of these results will be developed in a future work.
In Figure 7, we show the surface density of the disk in polar coordinates. As in the previous section, the fitting is performed over the region of the arm where the density contrast is stronger, in this case, also several kpc (in general more than in the nonbarred case). In the case of arms induced by a central bar, they present at its maximum, higher-density contrasts with respect to the disk than in the barless case, with larger lifetimes (see Figure 7) compared to the ones without a bar.
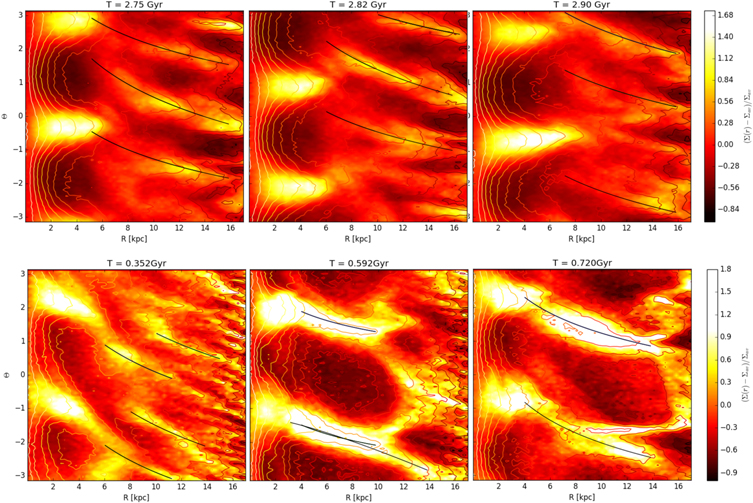
Figure 7. Arm density contrast in polar coordinates of barred GADGET 3 (top) and ART (bottom) simulations. Different panels (left to right) indicate evolution in time, labeled at the top of each panel.
Download figure:
Standard image High-resolution imageAs in the unbarred case (with spherical halos), the spiral arms wind up by at most 6° and usually about 3° or less (see Table 3) while losing strength or ripping up. We find, for instance, in the simulation of Figure 7, an arm born at about 68 Myr that presents a pitch angle of 26°, while one born later, at approximately 95 Myr, presents 23°. In other simulations performed specifically for this work, we find even smaller (than in the barless case) changes in the pitch angle of newborn arms; see Table 3. This means that, even when there is a winding up (i.e., an effective reduction of the pitch angle), the reduction is very small prior to the fading of the spiral arm. Additionally, we noticed that the amplitude density of the spiral arms reduces swiftly as the pitch decreases (see Figure 4) only for the arms that definitely disconnect from the bar, while for those that reconnect continuously every time the bar comes back, the arms always keep approximately the same pitch and density contrast. This is important because a large reduction or increase of the pitch angle would imply a severe difference in the dynamical behavior of gas and stars (Pérez-Villegas et al. 2015a).
Figure 8 is a zoom of the density structure in polar coordinates for three spiral arms taken at different times of the simulation (GB4 and B1). The mosaics show (upper panels) the surface density in polar coordinates and (lower panels) the density fall of the disk (blue stars) and the spiral arms (red stars), as well as a fit for each one (cyan and purple lines, respectively). Bar-induced spiral arms show a clear density exponential profile with a scale radius (indicated in the lower panels at the top right corner in kpc) larger than the disk scale length in all cases. This means that the spiral arms are gravitationally and dynamically very important far beyond the scale radius of the disk, even more than the ones for the barless simulations.
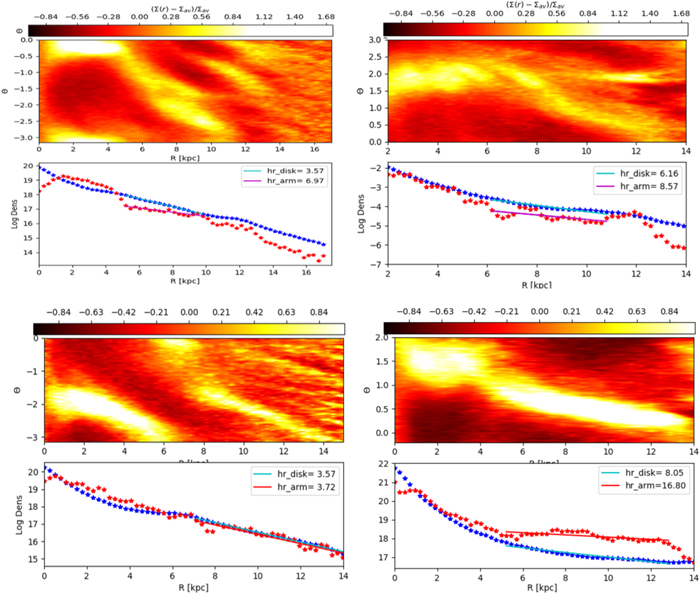
Figure 8. In this figure, we show three mosaics for the three spiral arms taken at different times (left to right). The upper panels of the mosaics are zooms of the surface density in polar coordinates of the arms. The lower panels of the mosaics represent the density fall along the respective spiral arm, where blue stars represent the disk (with the fit in cyan), and red stars represent the arms (with the fit in purple); the scale length is provided in all cases in the top right corner of the panels. The upper panels correspond to simulation GB4, and the lower panels correspond to simulation B1.
Download figure:
Standard image High-resolution imageFigure 9 corresponds to the vertical and transversal density profiles for the spiral arms shown in Figure 8. The upper panel of the first mosaic is the same radial density scale presented in Figure 8, included here for reference purposes; the second and third panels of each mosaic show the vertical (i.e., perpendicular to the plane of the disk) and transversal density profiles of the respective spiral arm. In all panels of this figure, we present the best fit in solid curves, its standard deviation (σ, indicated at left), and the corresponding scale height/length (in kpc, indicated at upper right).
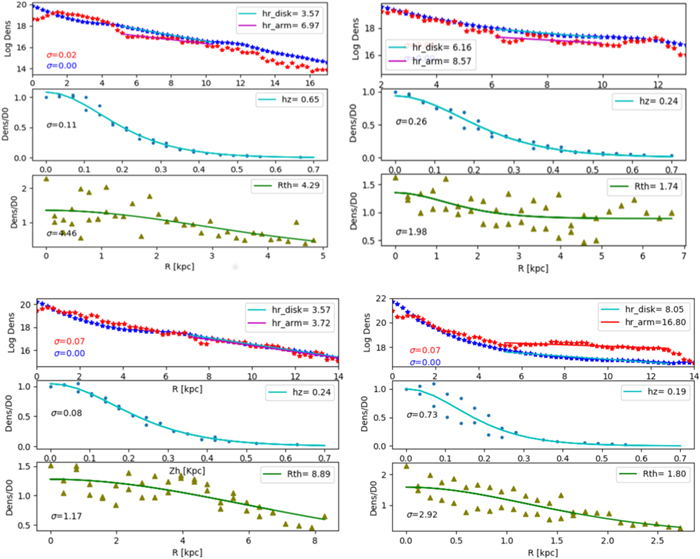
Figure 9. Same spiral arms as in Figure 8. The upper panels of each mosaic correspond to the radial density structure (same as in Figure 8). The middle and lower plots of each mosaic represent the density profile (and its fit with solid curves) of the vertical and transversal components for the respective spiral arm. The scale length is provided in all cases in the upper right of the plots, and the standard deviation is to the left (σ). The upper mosaics correspond to simulation GB4, and the two lower mosaics correspond to simulation B1.
Download figure:
Standard image High-resolution imageLike in unbarred cases, our results show that the 3D arm density structures are well fitted by an exponential profile in the radial direction and by a sech2 in the transversal and vertical directions. In general, the vertical height of the arms is lower than the one of the disk.
Finally, we have also calculated a density contrast for the spiral arms versus the disk in these barred simulations. We find that the density contrast, calculated at the maximum contrast of the spiral arms, is ∼3.3. For a quantitative summary of the parameters obtained in this study, see Table 3.
3.3. Spiral Arms Induced by a Satellite
Unlike the isolated cases presented in the previous sections, in the simulations with a satellite galaxy (with a mass of about ∼3% of the main galaxy), great-design spiral arms with a larger density contrast are induced by the satellite interaction; this type of arm is only strong as long as the perturber is close to the pericenter of its orbit. Satellite-induced spiral arms fade away depending on the satellite trajectory (in agreement with Semczuk et al. 2017; Pettitt & Wadsley 2018). As the satellite slips away from the maximum approach to the main galaxy, the spiral arms suffer the largest and swifter winding up. For example, in Table 4, we can see how the pitch angles of the spiral arms in these simulations reach nearly 20° of change. These severe and fast changes in the pitch angle and their density contrast of the spiral arms will have a great impact on the stellar and gas dynamics of the disk, as long as the satellite is able to produce these kinds of grand-design spiral arms.
Table 4. Measures of Pitch Angles of Different Arms Along the Simulations with Satellite Interaction and Isolated Disks in a Triaxial Halo
| Model | Time | Pitch | Hr | Hz | Ht |

|
||
|---|---|---|---|---|---|---|---|---|
| (Gyr) | (1) | (2) | (3) | (kpc) | (kpc) | (kpc) | ||
| U1S1 | 0.816 | 25.0 | 24.0 | 25.0 | 6.55 | 0.36 | 1.43 | 3.49 |
| 0.976 | 12.2 | 23.5 | 22.0 | ⋯ | ⋯ | ⋯ | ⋯ | |
| 1.136 | 12.0 | 11.0 | 12.5 | 11.9 | 0.71 | 1.42 | 5.51 | |
| 1.296 | 12.5 | 11.0 | 12.5 | ⋯ | ⋯ | ⋯ | ⋯ | |
| 1.616 | 8.5 | 8.5 | 14.0 | 5.8 | 1.24 | 9.7 | 7.88 | |
| 1.712 | 8.5 | 6.5 | 6.5 | ⋯ | ⋯ | ⋯ | ⋯ | |
| U1S2 | 0.16 | 37.0 | 36.0 | 36.0 | ⋯ | ⋯ | ⋯ | ⋯ |
| 0.32 | 24.9 | 25.5 | 23.5 | ⋯ | ⋯ | ⋯ | ⋯ | |
| 0.48 | 39.5 | 39.5 | ⋯ | ⋯ | ⋯ | ⋯ | ⋯ | |
| 0.64 | 40.5 | 40.5 | ⋯ | 8.34 | 0.39 | 2.21 | 2.23 | |
| 0.8 | 43.5 | 37.5 | 40.5 | ⋯ | ⋯ | ⋯ | ⋯ | |
| 0.96 | 43.5 | 42.5 | 39.5 | 6.9 | 0.21 | 1.24 | 2.04 | |
| 1.008 | 40.5 | 32.5 | 25.5 | ⋯ | ⋯ | ⋯ | ⋯ | |
| 1.12 | 33.5 | 25.5 | 37.5 | 8.29 | 0.65 | 1.22 | 2.20 | |
| 1.216 | 29.0 | 27.0 | ⋯ | ⋯ | ⋯ | ⋯ | ⋯ | |
| GT1 | 0.16 | 34.0 | 34.0 | ⋯ | ⋯ | ⋯ | ⋯ | ⋯ |
| 0.32 | 19.0 | 20.0 | 34.0 | 3.8 | 0.65 | 24.32 | 1.98 | |
| 0.48 | 19.0 | 16.0 | 25.0 | ⋯ | ⋯ | ⋯ | ⋯ | |
| 0.64 | 12.5 | 12.0 | 12.5 | 4.16 | 0.63 | ⋯ | 1.86 | |
| 0.8 | 12.5 | 10.5 | 11.5 | ⋯ | ⋯ | ⋯ | ⋯ | |
| 1.12 | 9.5 | 9.5 | 8.6 | 4.45 | 0.65 | 5.15 | 2.25 | |
| 1.44 | 10.0 | 9.0 | 6.2 | ⋯ | ⋯ | ⋯ | ⋯ | |
| 1.92 | 10.0 | 6.0 | 5.0 | 4.45 | 0.65 | 5.15 | 2.98 | |
| 2.4 | 5.5 | 5.6 | 5.6 | ⋯ | ⋯ | ⋯ | ⋯ | |
| 3.2 | 4.7 | 3.6 | 3.5/4.5 | ⋯ | ⋯ | ⋯ | ⋯ | |
| 4.0 | 4.7 | 3.3 | 3.5 | ⋯ | ⋯ | ⋯ | ⋯ | |
| 4.8 | 3.2 | 3.0 | 3.5 | 5.99 | 0.73 | 2.33 | 3.56 | |
| 5.6 | 2.8 | 2.3 | 3.0 | ⋯ | ⋯ | ⋯ | ⋯ | |
| 7.2 | 2.9 | 2.2 | 2.4 | 7.85 | 0.81 | 8.3 | 4.35 | |
Note. Radial, vertical, and transversal scale length was measured in just one of the arms at the respective time.
Download table as: ASCIITypeset image
In Figure 10, we show the surface density of the disk in polar coordinates. The fitting is performed over the region of the arm where the density contrast is stronger, in this case, the outskirts of the disk. The arms induced by a satellite have a higher-density contrast with respect to the disk than in the barless and barred cases, and they also show slightly larger lifetimes (see Figure 10).
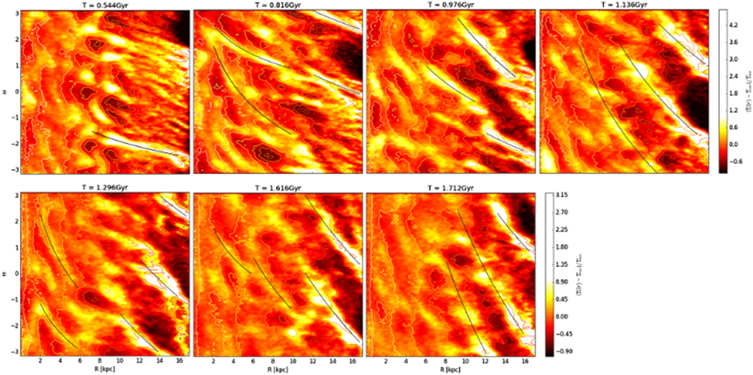
Figure 10. Time evolution of the arm density contrast, indicated by the color bar, in polar coordinates of simulation U1S1. Solid lines represent the logarithmic fitting of the arm. We can appreciate the formation of strong spiral arms at about 0.8 Gyr after the satellite has reached pericenter, which occurred at ∼0.6 Gyr.
Download figure:
Standard image High-resolution imageFigure 11 is a zoom of the density structure in polar coordinates for two spiral arms taken at different times of the simulation. The mosaics show (upper panels) the density contrast and (lower panels) the surface density profile of the disk (blue stars) and spiral arms (red stars), as well as a fit for each one (cyan and purple lines, respectively). Satellite-induced spiral arms also have a clear density exponential profile with a scale radius larger than the one for the disk (indicated in the lower panels at the top right corner in kpc), meaning that they are gravitationally and dynamically very important far beyond the scale radius of the disk.
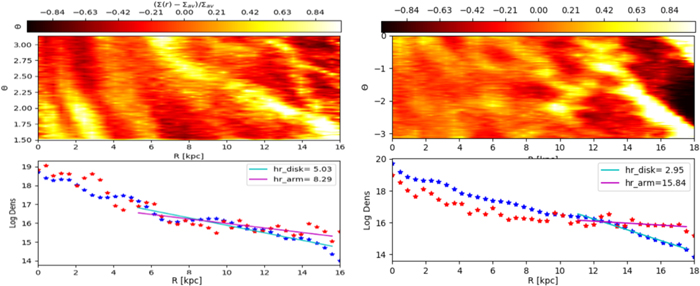
Figure 11. In this figure, we show two mosaics for the spiral arms taken at different times. The upper panels of the mosaics are zooms of the density contrast of the arms in polar coordinates; the lower panels correspond to the density profiles along the spiral arm (red stars) and disk (blue stars). The fitting and scale lengths are also indicated for both cases. These mosaics correspond to simulation U1S2.
Download figure:
Standard image High-resolution imageFigure 12 corresponds to the vertical and transversal density profiles for the two spiral arms shown in Figure 11. The first panel of each mosaic is the same radial density scale presented in Figure 11, included here for reference purposes; the second and third panels of each mosaic show the vertical (i.e., perpendicular to the plane of the disk) and transversal density profiles of the respective spiral arms. In all panels of this figure, we present the fitting in solid curves, with their respective standard deviation (σ) to the left and the scale length (in kpc) at the top right indicated for all cases.
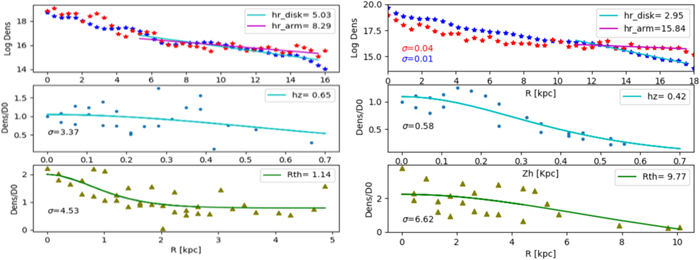
Figure 12. Same spiral arms as in Figure 11. The upper panels of each mosaic correspond to the radial density structure (same as in Figure 11). The middle and lower panels of each mosaic represent the density profile (and its fit with solid curves) of the vertical and transversal components for the respective spiral arms. The scale length is provided in all cases at the top right of the plots, and their standard deviation is given to the left (σ).
Download figure:
Standard image High-resolution imageIn these diagrams, we show that, like in the previous models, all arms are well fitted by a sech2 in the vertical and transversal directions, while for the radial component, i.e., along the spiral arm, an exponential function provides the best fit. The scale length of the vertical component of the spiral arm is similar to the corresponding one for the disk.
Finally, we have calculated a density contrast for the spiral arms versus disk. We find that the density contrast, calculated at the maximum contrast of the spiral arms, is 7.88. For a quantitative summary of the parameters obtained in this study, see Table 4.
3.4. Spiral Arms Induced by a Triaxial Halo
From all the simulations performed for this work, the most physically interesting case is by far the one with a triaxial halo. The outcome spiral arms from this simulation were very interesting because, among other things, the spiral arms were the most long-lasting and had the highest-density contrast compared to the disk. At the beginning, this type of spiral arm acts similarly to the ones induced by a strong galactic bar. However, in this specific simulation, a small bar is also raised at ∼2.6 Gyr.
The spiral arms wound up ∼16° before the formation of the bar; after that, the pitch angle of the arm was maintained over the rest of the simulation (see Table 4). The formation of a bar changed nothing in the spiral arm properties induced by the triaxial halo. This result clearly indicates that since the triaxial halo dominates the global potential, it gives place to the formation and long-lasting nature of these strong spiral arms.
Similar to the spiral arms presented in the previous sections, the radial density profile of the spiral arms is exponential and systematically has a scale length larger than that for the disk itself. In Figure 13, we show the density contrast of the disk in polar coordinates. The fitting is performed over the region of the arm where the density contrast is stronger and extends by several kpc. The arms induced by a triaxial halo tend to be coherent for a long time and maintain their general structure (density profiles: exponential in the radial direction and as a hyperbolic squared secant).
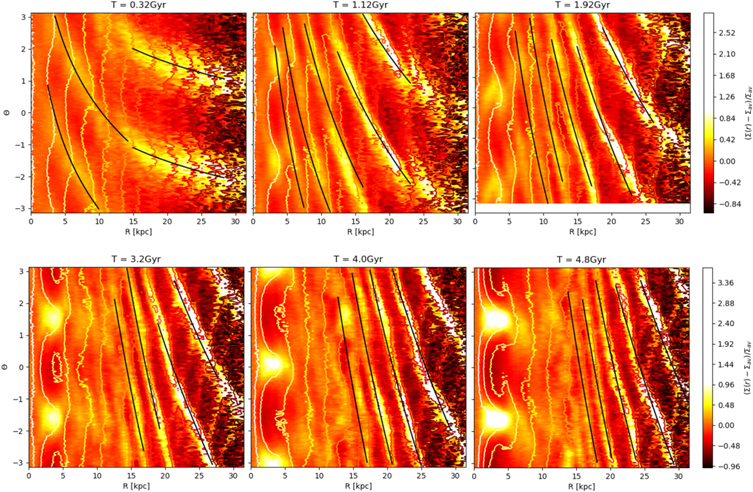
Figure 13. Arm density contrast in polar coordinates of the simulation GT4. It shows the evolution of the simulation before (top) and after (bottom) the formation of the bar. Solid lines represent the logarithmic fitting for the spiral arms.
Download figure:
Standard image High-resolution imageFigure 14 is a zoom of the density structure in polar coordinates for two spiral arms taken at different times of the simulation. The mosaics show (upper panels) the surface density in polar coordinates and (lower panels) the density fall of the disk (blue stars) and spiral arms (red stars), as well as a fit for each one (cyan and purple lines, respectively). As before, the spiral arms follow an exponential profile with a scale length larger than the one of the disk, indicating that they are still dynamically important in the external regions of the disk.
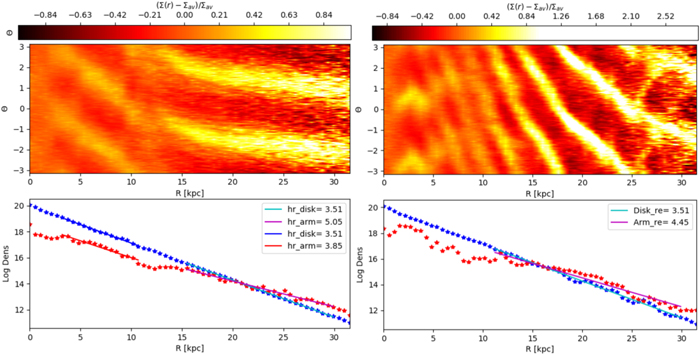
Figure 14. In this figure, we show two mosaics for the spiral arms taken at different times. The upper panels of the mosaics are zooms of the surface density contrast of the arms in polar coordinates; the lower panels correspond to the density fall along the respective spiral arm, where we represent the disk with blue stars (with the fit in cyan) and the arms with red stars (with the fit in purple); the scale length is provided in both cases (top right in the panels).
Download figure:
Standard image High-resolution imageThe 3D structure of the spiral arms is shown in Figure 15, where a sech2 fits well in the vertical and transversal directions, while an exponential provides a radial fitting along the spiral arm. The scale height of the vertical component of the spiral arm is similar to the corresponding one of the disk.
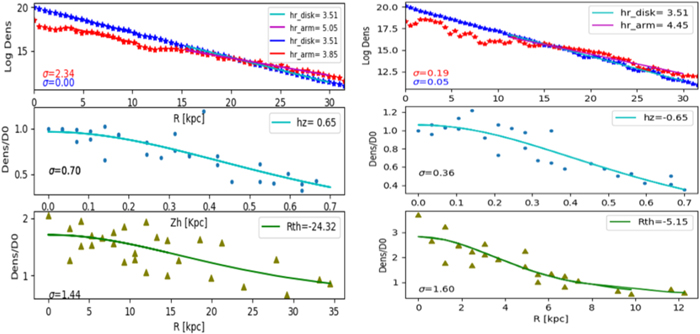
Figure 15. Same spiral arms as in Figure 14. The upper panels of each mosaic correspond to the radial density structure. The middle and lower panels of each mosaic represent the vertical and transversal density profiles (and their fit with solid curves) of the arms. The scale length is provided in all cases at the top right of the panels, and their standard deviation is to the left (σ).
Download figure:
Standard image High-resolution image3.5. Comparison with NGC 2543
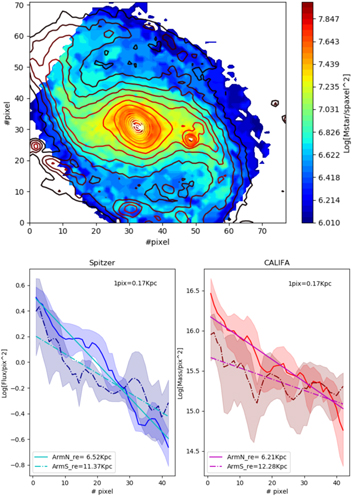
For illustrative purposes, we have selected the galaxy NGC 2543 with observations both in the optical CALIFA IFU survey (Sánchez et al. 2012) and in the near-infrared with the Spitzer Survey of Stellar Structure in Galaxies (S4G; Sheth et al. 2010). The observations at 3.6 μm are less affected by internal extinction and trace old stellar populations. This is particularly important for deriving the properties of disks and, in particular, for studying spiral arms. We retrieved directly from the IRSA website (https://irsa.ipac.caltech.edu/data/SPITZER/S4G) the results of the 2D structural decompositions using GALFIT (Peng et al. 2010). In order to isolate the spiral arms within the image, we subtracted the best bulge (Sérsic fit), disk (exponential fit), and bar (Ferrers bar) models from the original images.
Similar to what has been done with the results of the simulations, we use the Spitzer 3.6 μm images to trace the spiral arm loci and estimate their density mass profile by using the available CALIFA stellar density maps for NGC 2543. The upper panel in Figure 16 shows the contours of the Spitzer 3.6 μm image overplotted on the CALIFA mass density map after a proper spatial scale matching of these images. The lower panel shows the light profile along the spirals inferred from the Spitzer 3.6 μm image (left) and the corresponding stellar mass density profile from the CALIFA IFU data products (right). Notice that the spiral profile scale length is greater than the disk scale length in NGC 2543 after an exponential disk fit.
Figure 16. Spitzer and CALIFA images of NGC 2543.
Download figure:
Standard image High-resolution image
4. Discussion
In this work, we present an extensive study of the properties of spiral arms triggered by different mechanisms, i.e., intrinsic disk instabilities, bars, interactions with satellites, and halo triaxiality. We focus our study on the spiral arms' radial, azimuthal, and vertical density profile; scale radii; pitch angles; and lifetime. In addition, we study their evolution in time, e.g., changes in the morphology and general properties after being destroyed and rebuilt in a transient-recurrent formation scenario. In order to undertake our analysis, we select high density contrast spirals emerging in each of the simulations and thus at different times all along the simulation temporal domain. In the last part of our work, we also include an analysis of a couple of observed galaxies (see Section 3.5 and Figure 16).
At the time the first arms vanish, new strong arms are already forming, in such a way that the disk always presents strong spiral arms coexisting with weak, fading, disconnected arms. Every new spiral reaches a maximum strength at some point in its evolution; we find this moment in the simulation and fit a logarithmic spiral using the density maximum at each radius. To highlight the spiral arms, we use the surface density of the disk in polar coordinates and subtract the average density by rings (see Figure 4). In most cases, the fitting is performed only over the section of the arm where the density contrast is stronger.
Fitting a logarithmic locus to the simulated arms does not work in all cases or for the whole extension of the arm (see Figure 7). In many cases, we need to make a "sectional" fitting in one single arm; this is due to the fact that arms fracture during the simulation.
When the arm decouples from the original large-scale structure (at its maximum strength), the outer region of the arm seems to be more wound up. This means that, once an arm (or a section of an arm) is detached, it seems to follow the motion of the disk, i.e., corotates, decreasing its pitch angle for a short time, and only a few degrees, previously fade out totally.
Spiral arms, as well as the disk, have a clear density exponential fall, but the scale radius (indicated in all lower panels in the top right corner in kpc) is larger for the spiral arms than for the disk in all cases; this means that the spiral arms are gravitationally—and, consequently, dynamically—influential way beyond the scale radius of the disk itself.
Although the spiral arm pitch angle is one of the critical parameters that determines the dynamical behavior of stars and gas in the outer parts of disk galaxies (since it is directly related to the strength of the arm), small changes in the pitch angle only slightly change the dynamics of a given disk (Pérez-Villegas et al. 2012, 2013, 2015b). This means that, according to our simulations, spiral arms are only able to wind up for a few degrees before vanishing, and newborn spiral arms seem to keep very similar pitch angles for a given disk. The dynamics of the spiral arms in this case would be similar to the dynamics of spiral arms that are born steady for long timescales. This is clearer in spirals induced by bars but also for the barless cases where the changes in pitch angles are a only little larger.
On the other hand, in simulations with satellites, prior to the encounter, spiral arms are generated at the beginning of the simulation due to the intrinsic evolution of the galaxy itself (very similar to the multi-armed, rather flocculent structure of the barless case introduced previously). As the satellite approaches the host galaxy, strong bisymmetric great-design arms are born, and those hold for the entire simulation.
The spiral arms formed by the interaction with the satellite keep the pitch angle for a short time that depends on the characteristics and time interaction of the encounter. This means that the arms keep strong as long as the satellite is nearby (a couple of galactic radii); once the satellite goes beyond a few galactic radii, the spiral arms wind up (as previously reported by Semczuk et al. 2017) to a higher degree, up to 11°, than the isolated cases (i.e., the barred and barless cases), but they will do so at a much lower rate (see Figure 10).
New high-quality observations of spiral arms in galaxies, as well as high-resolution N-body simulations, have brought to us the possibility of better understanding, in every new exploration, the very nature of spiral arms in disk galaxies. We present a thorough study of the morphology of spiral arms in high-resolution N-body simulations for different types of spiral arms (i.e., different production mechanisms), as well as for individual spiral arms rising at different times in one simulation. With this study, we aim to shed some light on the physical characteristics of the spiral arm structure in disk galaxies induced by different mechanisms, such as bars, tidal interactions produced by a satellite galaxy, a triaxial halo, or intrinsic disk instabilities for nonbarred galaxies. We also analyze some spiral arm properties in photometric observations of the galaxy NGC 2543 (Figure 16).
The morphology and dynamics of spiral arms, bars, and the shape of the halo define, in noninteracting galaxies, all dynamical processes that, in turn, provide us with their evolution history. For instance, whether newborn spiral arms are similar every time they are born or very different from previous generations of spiral arms completely changes the subsequent dynamical and chemical evolution of a given galaxy (e.g., Martinez-Medina et al. 2017). Therefore, in addition to the morphology studies of spiral arms, another important goal for us with this exploration is to figure out whether newborn arms share similar characteristics as foregoing arms in disk galaxy simulations. Do newborn arms possess similar pitch angles at their maximum dynamical influence moments? Do they have similar morphologies?
This means that, even when there is a winding up (i.e., an effective reduction of the pitch angle), the reduction is very small prior to the dissolution of the spiral arm. This is important because a large reduction or increase of the pitch angle would imply a severe difference in the dynamical behavior of gas and stars (Pérez-Villegas et al. 2012, 2013, 2014, 2015a, 2015b).
5. Conclusions
Using N-body simulations, we explore the spiral arm structural properties in barred, unbarred, and interacting galaxies, as well as one embedded in a triaxial dark matter halo. Our strategy is to study the 3D arm structure through the analysis of pitch angle, along/transverse/vertical density laws and their corresponding scale lengths, and spiral lifetime. Our main results are as follows.
- 1.The radial density profile of all spiral arms analyzed in this work is exponential. This profile resembles the one of the disk, but its scale length is systematically larger (between 5% and 40%). This result suggests that spiral arm gravitational influence is important beyond the scale radius of the disk.
- 2.The vertical and transversal density laws of the spiral arms follow a sech2. The vertical scale length is compatible with the one of the disk; this is observed in all spiral arms analyzed here, independently of the precursor (bar, barless, and satellite simulations and a triaxial halo).
- 3.For the triaxial and satellite simulations, spiral arms follow a logarithmic locus through their lifetime; for the rest, the locus shows a transient and short-lived nature.
- 4.Spiral arms wind up in their lifetime with a small pitch angle reduction. It is common that newborn spirals inherit the pitch angle of the previous ones; this result challenges the dynamical relevance of arm evolution.
- 5.Finally, from the analysis of public photometric observations of NGC 2543, we state that the properties of the observed spiral arm structure can be consistent with our conclusions.
D.M., H.V., and B.P. acknowledge a postdoctoral fellowship by grant CONACyT Ciencia Básica 255167. H.M.V. acknowledges grant DGAPA-PAPIIT IN109116; O.V. and S.R.-F. acknowledge grant DGAPA-PAPIIT IN112518, Fronteras de la Ciencia CONACyT 281; D.M.C. acknowledges grant DGAPA-PAPIIT IN105916, etc. We acknowledge the use of the Atocatl supercomputer at the Instituto de Astronomía of the Universidad Nacional Autónoma de México (UNAM) and DGTIC-UNAM for the use of Miztli, as well as the ABACUS supercomputer, where the simulations were performed. This paper is dedicated to the loving memory of our friend and colleague, Dr. Bárbara Pichardo, who first triggered the dynamical study of spiral arms in Mexico.