


Abstract
We aim to study the properties of a particular type of evolved stars, C-rich evolved stars with high expansion velocities. For this purpose we have focused on the two best studied objects within this group, IRC+10401 and AFGL 2233. We focused on determining their luminosity by studying their spectral energy distribution. Also, we have obtained single-dish line profiles and interferometric maps of the CO J = 1–0 and J = 2–1 emission lines for both objects. We have modeled this emission using a LVG radiative transfer code to determine the kinetic temperature and density profiles of the gas ejected by these stars. We have found that the luminosities obtained for these objects (log(L/L⊙) = 4.1 and 5.4) locate them in the domain of the massive asymptotic giant branch stars (AGBs) and the red supergiant stars (RSGs). In addition, the mass-loss rates obtained (1.5 × 10⁻⁵–6 ×10⁻³ M⊙ yr−1) suggest that while IRC+10401 might be an AGB star, AFGL 2233 could be an RSG star. All these results, together with those from previous works, suggest that both objects are massive objects, IRC+10401 a massive evolved star with Minit ∼ 5–9 M⊙, which could correspond to an AGB or an RSG and AFGL 2233 an RSG with Minit ∼ 20 M⊙, which would confirm the existence of massive C-rich evolved stars. Two scenarios are proposed to form these types of objects. The first one is capable of producing high-mass AGB stars up to ∼8 M⊙ and the second one is capable of forming C-rich RSGs like AFGL 2233.
Export citation and abstract BibTeX RIS
1. Introduction
Evolved stars are responsible for the chemical evolution of the Galaxy (Habing & Olofsson 2003). The elements these objects create in their lifetimes are transported from their cores to the photosphere in the late stages of their evolution, thanks to the so-called third dredge-up process. This process takes place in the asymptotic giant branch (AGB) phase for low and intermediate initial masses (Minit ∼ 1–9 M⊙), and in the red supergiant phase (RSG) for massive stars ( M⊙). These elements are later expelled into the interstellar medium (ISM) as the evolved star starts to loss mass.
The composition of this ejecta is a direct result of the nucleosythesis that has taken place in the stellar core and of the dredge-up. In particular, the initial mass of the star has a direct effect on the nucleosynthesis processes, therefore this parameter has a direct effect on the C/O, C/N, and O/N abundance ratios.
Current nucleosynthesis models predict that, in the early stages of evolution, oxygen is the most abundant metal in the photosphere of most stars. As the initial masses of the stars reach the threshold of 1 M⊙, the third dredge-up is activated in the red giant phase, and the carbon from the core is mixed into the photosphere, which becomes C-rich. In the case of the most massive evolved stars (Minit ≥ 4 M⊙) the hot bottom burning (HBB) process is activated in the core and transforms 12C into 14N (Boothroyd et al. 1993). These massive objects are then expected to present an abundance ratio of C/O < 1, with a particularly high abundance of nitrogen.
The initial mass of the star also has a direct effect on the velocity field of the ejected material around the star. In particular, a high initial mass is directly related to a high luminosity. The ejection of material from the evolved stars in their giant phase is powered by the radiation pressure on the dust grains, which at the same time is directly related to the luminosity (Goldreich & Scoville 1976).
While the processes responsible for the mass ejections of RSGs are not clear (see, e.g., Josselin & Plez 2007); certain works posit that dust-driven winds are also responsible for the mass loss in RSGs (Quintana-Lacaci et al. 2007; Goldman et al. 2017; Vlemmings et al. 2017, see Section 4 for a detailed explanation). Both AGB and RSG velocity fields would result in molecular spectra comprising pure rotational lines with profiles presenting sharp edges, FHWMs of ∼2 × vexp, where vexp is the terminal expansion velocity.
Due to all this, evolved stars presenting C-rich envelopes were thought to be intermediate-mass stars, and were expected to present intermediate expansion velocities (vexp ∼ 10–20 km s−1 with a mean value of  km s−1; see, e.g., Loup et al. 1993).
Contrary to this, in the same catalog from Loup et al. (1993), it can be found that certain C-rich stars present abnormally high expansion velocities when compared with the rest of the C-rich sample. These types of objects were also studied by Zuckerman & Dyck (1986) and Barnbaum et al. (1991) among others, who found that the C-rich evolved stars present a wide range of initial masses, relating those C-rich objects showing higher values of expansion velocities with higher masses (Minit ≳ 3 M⊙). Out of these C-rich stars with high expansion velocities, two of these sources present the strongest CO J = 1−0 emission (∼5–10 Jy) and are the best studied objects of this kind (e.g., Likkel & Miao 1996; Fuente et al. 1998). These objects are AFGL 2233 and IRC+10401. In order to study the properties of these types of objects we have focused on these two objects. From now on we will call these C-rich stars with high expansion velocities HVC stars (high-expansion-velocity carbon stars).
A recent λ 3 mm and 1 mm line survey toward IRC+10401 (G. Quintana-Lacaci et al. 2019, in preparation) clearly showed that these objects present the species that would be expected for a C-rich object (SiC2, HCN, HC3N, C4H, ...) and lack the species typical of O-rich envelopes, such as SO and SO2. Also, the IRAS/LRS spectrum of AFGL 2233 shows a band at 11 μm typical of C-rich stars, which seems to also appear at the IRAS/SWS spectrum of IRC+10401.
Despite these, Fuente et al. (1998) found that these C-rich stars do not only differ from the standard C-rich AGB stars in their kinematics but also in their chemistry. In particular, these authors found that the HVC stars show an abundance of C2H that is five times higher than the average abundance in C-rich evolved stars. In addition, Zuckerman & Dyck (1986) found a large HCN/CO ratio for these objects. Due to the extent of these emissions they suggested that the main source of this large ratio is an N-enrichment and an initial mass above 4 M⊙—i.e., with an active HBB.
Also, these objects present relatively large pulsation periods: 577 days for IRC+10401 (Loup et al. 1993; Likkel & Miao 1996) and 687 days for AFGL 2233 (Kerschbaum et al. 2006). These large periods are usually found in O-rich, and thus more massive, evolved stars. In fact, Whitelock et al. (2008) showed that the period–luminosity relation used to determine the luminosity of the AGBs fails for stars with periods above 400 days. This deviation was suggested to be a consequence of the activation of the HBB, i.e., the sources with periods larger than 400 days are expected to have initial masses above 4 M⊙. In particular these authors found a different slope in the PL relation for objects above 400 days. They argued that the HBB could allow the luminosity to go above the core-mass–luminosity prediction, thus changing the slope as observed (Whitelock et al. 2003).
In this paper we present detailed interferometric CO maps of these HVC stars, in order to characterize the structure and kinematics presented by the ejecta around AFGL 2233 and IRC+10401. These maps would allow us to study the CSE around these objects. In future works, the results from this analysis would be used to study the molecular content of these ejecta, which would allow us to estimate the molecular abundances. These abundances could then compare with chemical models to derive the abundances of parent species (in a similar way to Quintana-Lacaci et al. 2013). Finally, these would allow us to infer the processes taking place in the innermost shells of the star and compare it with the nucleosynthesis models.
2. Observations
We have obtained interferometric 12CO J = 2–1 and J = 1–0 maps with the Plateau de Bure interferometer of IRC+10401 and AFGL 2233. The maps were obtained between 2012 November and 2013 June. Both objects were observed in track-sharing mode. In order to calibrate the receiver bandpass (RF) and the amplitude and phase, six bright quasars were observed. In particular, 3C 279 was used to calibrate the RF band, while 1749+096 and 1827+062 were used to calibrate phase and amplitude.
The accuracy of the flux calibration is within 10% at 3 mm and 20% at 1 mm. The calibration and data analysis were performed in the standard way using the GILDAS7 software package. Imaging and cleaning were performed using natural weights and verifying that the flux contained in the found CLEAN components corresponds to that seen in the uv-tables. Neither halos nor elongations were seen in the continuum maps of the phase calibrators. Therefore, we do not expect to have any spurious contribution from the calibration above the dynamic range.
Comparing the data with single-dish observations we found that part of the CO emission was filtered out. Therefore, the data were merged with on-the-fly (OTF) maps obtained with the IRAM 30 m telescope. The merging was performed in the standard way with the GILDAS software.
3. Description of the Interferometric Maps
The merged interferometric maps obtained for AFGL 2233 for the CO J = 1−0 and J = 2−1 transitions are presented in Figures 1 and 2, respectively, while those corresponding to IRC+10401 are shown in Figures 3 and 4.
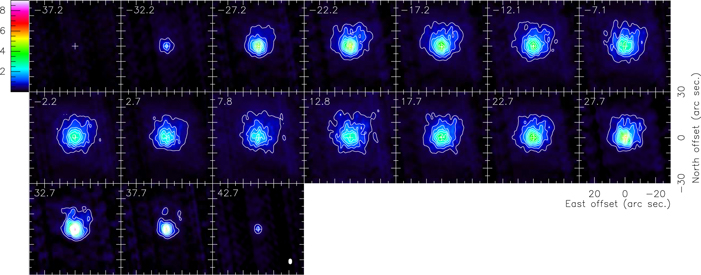
Figure 1. Interferometric map of the CO J = 1−0 emission toward AFGL 2233. The vLSR of the channel (Vsys = 2.8 km s−1) is in the upper left corner of each panel. The contours correspond to steps of 0.5 K (=7.9σ). The rms of the map is σ = 5.9 mJy beam−1. The beam size is drawn in the last panel. The HPBW is 3 6 × 24 with a P.A. of 360°. The flux density scale is in Jy beam−1.
Download figure:
Standard image High-resolution image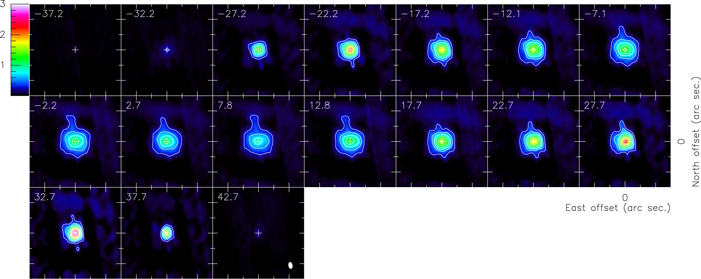
Figure 2. Interferometric map of the CO J = 2−1 emission toward AFGL 2233. The vLSR of the channel (Vsys = 2.8 km s−1) is in the upper left corner of each panel. The contours correspond to steps of 2.2 K (=5σ). The rms of the map is σ = 51 mJy beam−1. The beam size is drawn in the last panel. The HPBW is 22 × 13 with a P.A. of −171°. The flux density scale is in Jy beam−1.
Download figure:
Standard image High-resolution image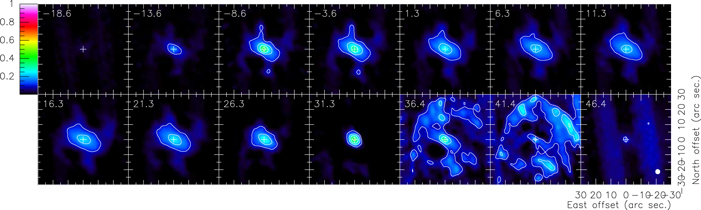
Figure 3. Interferometric map of the CO J = 1−0 emission toward IRC+10401. The contours correspond to steps of 5σ. The vLSR of the channel (Vsys = 16.4 km s−1) is in the upper left corner of each panel. The rms of the map is σ = 31 mJy beam−1. The beam size is drawn in the last panel. The HPBW is 32 × 31 with a P.A. of 19°. The flux density scale is in Jy beam−1.
Download figure:
Standard image High-resolution image
Figure 4. Interferometric map of the CO J = 2−1 emission toward IRC+10401. The first contour corresponds to a 5σ level, and the rest contours correspond to steps of 5.1 K (=10σ). The vLSR of the channel (Vsys = 16.4 km s−1) is in the upper left corner of each panel. The rms of the map is σ = 49 mJy beam−1. The beam size is drawn in the last panel. The HPBW is 18 × 12, with a P.A. of 11°. The flux density scale is in Jy beam−1.
Download figure:
Standard image High-resolution imageThe structure of the molecular gas around AFGL 2233 mainly shows a spherical structure, apart from two blobs appearing on the northern and southern edges of the CO J = 2−1 emission (Figure 2). These blobs are aligned with the dirty beam, therefore these features might be artifacts. The same effect can be seen in the IRC+10401 CO J = 1−0 map. The last three channels of the IRC+10401 maps present some pollution. The origin of this pollution is in the OTF maps. When compared with single-dish profiles, the OTF profiles show an excess between 34 and 38 km s−1 , which most likely is a calibration problem during the OTF observations. While the inner parts of the molecular shell of IRC+10401 are spherical (Figure 4), the outer layers reveal an elongation (Figure 3).
Because, as mentioned, the molecular structure around these objects is mainly spherical, we have adopted a 1D approach in our modeling. This is presented in Section 5.
4. Luminosity of the HVC Stars
4.1. Expansion Velocity as a Luminosity Indicator
The width of the molecular line profiles observed provides a quick indicator of the kinematical properties of the gas. In particular, as mentioned above in the case of the evolved stars it is a direct consequence of the expansion velocity field. The terminal expansion velocity, the presence of fast outflows, and different kinematical components can be identified with a simple line analysis (Bujarrabal et al. 2001; Sánchez Contreras & Sahai 2012).
It is widely accepted that the bulk of the gas ejection is powered by the radiation pressure on grains and the latter coupling of this dust with the gas (Goldreich & Scoville 1976). Therefore, the expansion velocity (vexp) is directly related to the luminosity, the dust properties, and the gas-to-dust ratio. Assuming that, in general, changes in the dust properties and the dust-to-gas ratio are minor compared with an important change in luminosity, vexp can be used to have a first approximation to the real luminosity of an evolved star. It is important to note that the expansion velocities of both O-rich and C-rich AGB stars show similar distributions (Knapp & Morris 1985; Loup et al. 1993). This shows that while the dust composition of these two types of objects might clearly be different from one another, its effect on the expansion velocity is only minor. On the other side, regarding more massive and thus more luminous evolved stars, the larger expansion velocities found by these authors for the RSGs and by Castro-Carrizo et al. (2007) and Quintana-Lacaci et al. (2007) for the yellow hypergiant stars (YHGs) suggest that the luminosity has a major impact on the expansion velocity of the evolved stars. These facts suggest that the assumptions proposed above are reasonable.
Following those assumptions, Quintana-Lacaci (2008) found that the expansion velocity, vexp, of both AGB stars and YHGs can be related with the luminosity(L) by the following relation (see also the Appendix):

If we use vexp = 15 km s−1 and L = 104 L⊙ as average values for AGB stars, we could use the expansion velocity inferred from the IRC+10401 CO profiles (∼28 km s−1) to roughly estimate the luminosity of these objects. The value thus obtained is log(L/L⊙) ∼ 5.1, which falls within the luminosity domain of the RSGs. In the case of AFGL 2233 we could estimate its luminosity in this first approximation to be log(L/L⊙) ∼ 5.3, for an expansion velocity of 32 km s−1.
It is important to note that the mechanisms driving mass loss for AGBs and RSGs can show significant differences. The irregular pulsation of the RSGs and their small amplitude variations suggest that the AGB mass ejection mechanism would not be efficient for these massive stars (see, e.g., Josselin & Plez 2007). However, despite the different physical characteristics of both types of stars, the relation of the expansion velocity with the luminosity has been shown to reasonably fit the observations, as shown by Quintana-Lacaci (2008) or more recently Goldman et al. (2017). In particular, the relation derived by Goldman et al. (2017) to fit the expansion velocities of both AGB and RSG stars, vexp ∝Z × L0.4, does not come from an aprioristic approach, as in the case of Equation (1). It is an empirical relation.
This suggests that the luminosity indeed has an impact on the velocity of the ejection. One of the mechanisms suggested to drive the mass ejection on the RSG VY CMa is the presence of magnetohydrodynamical disturbances that would create cool spots in the photosphere of these objects (O'Gorman et al. 2015; Vlemmings et al. 2017). In these cool spots the dust formation would then be enhanced by driving mass ejections in random directions. These ejections, while being triggered by different mechanisms than those in the AGB stars, would also depend on the radiation pressure on the grains and thus suggest that the expansion velocity of the ejecta would depend on the dust composition and the stellar luminosity.
We have not used the relation from Goldman et al. (2017), as we count with no estimates for the metallicities for either IRC+10401 or AFGL 2233. The only way to estimate it would be using a galactic metallicity gradient such as that from Pedicelli et al. (2009) and estimating galactic radii as done by Lemasle et al. (2007). However, as said in Section 4.2, the distances of these objects are not well established, therefore the estimate of the luminosity would be very weak. Nevertheless, the aim of the present section is to obtain a simple luminosity estimate, keeping in mind the clear limitations of the method used.
4.2. Distance to the Sources
While the vexp–luminosity relation used above suggests that these objects are RSGs instead of AGBs as previously thought, it is important to remember that the possible changes in the dust properties were ignored in Equation (1). In order to accurately estimate the stellar luminosity, as well determine the properties (density and temperature) from the molecular observations of these particular objects, it is mandatory to have accurate distances.
However, the distances derived in the literature are contradictory. In this section, we review the different distances derived so far.
Several distance determinations are already based on assumptions about the nature of the objects, such as, for instance, assuming them to be AGB stars. Loup et al. (1993) derived the distances for IRC+10401 and AFGL 2233 assuming a standard AGB value for the bolometric luminosity of 104 L⊙. The distances thus derived were 670 pc and 910 pc for IRC+10401 and AFGL 2233, respectively. Le Bertre (1997) also estimated a distance for IRC+10401 of 1.1 kpc. This distance was derived from the period and the bolometric luminosity using the period–luminosity relation by Groenewegen & Whitelock (1996). Note that Groenewegen & Whitelock (1996) derived their relation for AGB C-rich stars, therefore it cannot be assumed to work in case these objects are massive stars.
In contrast, Yuasa et al. (1999) derived a distance of 4.16 kpc for AFGL 2233 and 2.49 kpc for IRC+10401. These distances were derived using radial velocities and Oort's galactic rotation model. Therefore, this estimated is not affected by assumptions on the nature of the sources. We note that the systemic velocity for AFGL 2233 used by Yuasa et al. (1999) is 6 km s−1, slightly higher than that obtained in this work (2.8 km s−1, see below). This has an effect on the distance determined; however, the distance would be ≲0.3 kpc larger for the smallest velocity value, i.e., a relative error lower than 10%.
Recently, parallax data for these sources was released with the Gaia Data Release 2 (Gaia Collaboration et al. 2016, 2018). The distances obtained for IRC+10401 and AFGL 2233 are 1.1 ± 0.3 kpc and 4.0 ± 4.7 kpc. However, as mentioned by Chiavassa et al. (2018) the distance determination for pulsating stars presents difficulties and only the accumulation of a large amount of measurements can confirm the parallaxes derived. Due to this we will adopt for AFGL 2233 the distance by Yuasa et al. (1999), which is similar to that obtained by Gaia. For IRC+10401 we assume the distance from Gaia, as its error is relatively low.
4.3. Spectral Energy Distribution
In order to estimate the luminosity of the objects, we integrated the spectral energy distribution (SED) assuming the above cited distances. The data were obtained from the IRAS,8 UKIRT,9 2MASS,10 and CIO11 catalogs and from Whitelock et al. (2006). The SEDs of both objects are presented in Figure 5.
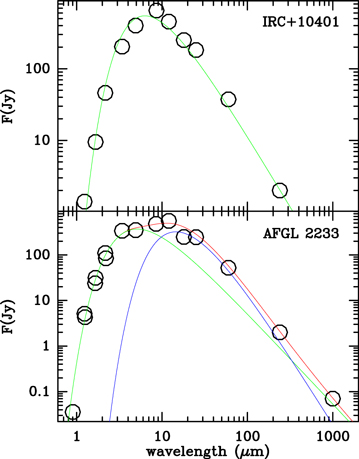
Figure 5. Top: spectral energy distribution of IRC+10401. The open circles represent the data, and the green line represents the fitting with TBB = 800 K and R = 1015 cm. Bottom: spectral energy distribution of AFGL 2233. The open circles represent the data, and the red line corresponds to the fitting consisting of two BBs, a warm one represented by the green line (TBB = 1000 K; R = 1015 cm), and a cold component represented by the blue line (TBB = 330 K; R = 3 × 1015 cm).
Download figure:
Standard image High-resolution imageThe luminosities derived are log(L/L⊙) = 4.1 for IRC+10401 and log(L/L⊙) = 5.4 for AFGL 2233. The former value can be associated both with AGB stars and RSG objects, while the latter value clearly suggests that AFGL 2233 is an RSG star.
Luminosities as log(L/L⊙) = 5.4 could only be reached with initial masses around 20 M⊙ (Meynet & Maeder 2003), while log(L/L⊙) = 4.1 could be reached for AGB stars with Minit ≳ 4 M⊙ (Girardi et al. 2000; Miller Bertolami 2016). It is important to note that the region of the HR diagram with log(L/L⊙) ∼ 4 and log(Teff) ∼ 3.7–3.6 could be populated by both high-mass AGBs and low-mass RSGs (Girardi et al. 2000; Meynet & Maeder 2003; Miller Bertolami 2016). Other data have to be used in these cases to try to disentangle the nature of the objects lying in this particular region.
In addition to obtaining the total luminosity of the object, which allows us to locate the objects in the vertical axis of the H-R diagram, the particular shapes of their SEDs allow us to estimate their evolutionary status. In particular, the SED of the AGB stars appears as a relatively cold blackbody (BB), which results from all the stellar radiation at wavelengths shorter than 1–5 μm being absorbed by the circumstellar dust, and its subsequent reemission. However, as the mass ejection ceases at the end of the AGB/RSG phase, and the circumstellar material dilutes as it expands out into the ISM, the photons from the star are able to escape. The dust component starts to separate from the stellar BB along the post-AGB/RSG phase (see, e.g., Hrivnak et al. 1989), and two different humps become visible in the SED.
The SED of IRC+10401 can be fitted with a single blackbody component, showing that this star is completely embedded in the ejecta it has expelled, i.e., it is in early stages of the late stellar evolution. We obtained a TBB of 800 K and a radius of 1015 cm. The temperature of the BB derived here is compatible with that obtained by Le Bertre (1997). On the contrary, the SED of AFGL 2233 is better fitted if we add a second colder component, which might suggest that the ejecta are less dense, and probably slightly more evolved than IRC+10401, or that these objects have undergone two mass ejection episodes. This SED was fitted with two BBs, a warm component with a TBB of 1000 K and a radius of 1015 cm, and a cold one with TBB = 330 K and a radius of 3 × 1015 cm.
5. Nebula Emission Model
In order to derive the excitation and density conditions of the gas around the two HVC stars we have modeled its CO emission using the radiative transfer code MADEX (Cernicharo 2012).
As mentioned in Section 2, the molecular emission of AFGL 2233 is mainly spherical. IRC+10401 shows an spherical inner structure that is elongated in the outer regions, along the northeast–southwest (NE–SW) direction. In order to fit the data we obtained azimuthally averaged profiles of the emission of the two observed transitions. While the results did not provide realistic physical profiles for the outer (elongated) regions of IRC+10401, they did allow us to estimate the total emitting mass. In order to fit the observations, taking into account both the radial profiles, and the kinematics of the gas, we simultaneously fitted the azimuthally averaged profiles of the central velocity channel, and the single-dish line profiles of both CO J = 1−0 and J = 2−1.
For AFGL 2233 the single-dish profiles correspond to the central spectra of the OTF maps. In the case of IRC+10401, these profiles are part of a λ 3 and 1 mm survey that will be published in a forthcoming paper. The spikes appearing at the CO J = 1–0 appear in all the scans covering this transition along the observation period, and are not visible in other intense lines covered at the same time. The origin could be some pollution from emission arising from the off position.
In order to determine the level population of CO, we adopted the LVG approximation. Under this approximation we solve the statistical equilibrium equations at the different radii independently, as they are assumed to be radiatively isolated. Once the level populations and excitation temperature are obtained we integrate the intensity along the line of sight to obtain a brightness distribution. This brightness distribution is then convolved with the telescope beam to reproduce the observations.
We used as a central source the values of radius and TBB derived in the previous section.
We modeled the emission as arising from a series of different layers characterized by six parameters: inner and outer radius (Rin and Rout), the density given by the mass-loss rate ( ) and the expansion velocity, and the temperature law given by the power law
  , where T16 is the temperature at 1016 cm, αt is the exponent determining the temperature variation, and Tmin is the minimum temperature, which corresponds to that of the CMB.
6. Results
We found that while in order to fit both the CO molecular and dust emission around IRC+10401 only a single shell was needed, AFGL2233 required the presence of different layers. The parameters determined for these layers are shown in Tables 1 and 2, and the best fit found is presented in Figures 6 and 7 for IRC+10401 and AFGL 2233, respectively.
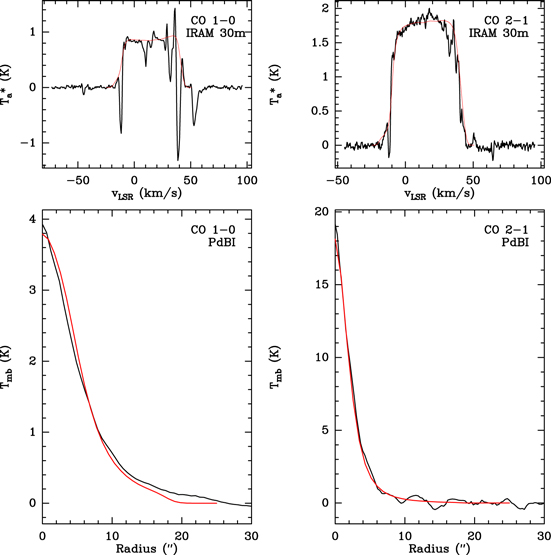
Figure 6. Top left: CO J = 1−0 line profile obtained with the IRAM 30 m telescope for IRC+10401. Top right: CO J = 2−1 line profile obtained with the IRAM 30 m telescope for IRC+10401. Bottom left: azimuthally averaged profile of the CO J = 1−0 molecular emission of the central velocity channel obtained toward IRC+10401. Bottom right: azimuthally averaged profile of the CO J = 2−1 molecular emission of the central velocity channel obtained toward IRC+10401. The black lines correspond to the observations and the red lines correspond to the results of the model.
Download figure:
Standard image High-resolution image
Figure 7. Top left: CO J = 1−0 line profile obtained with the IRAM 30 m telescope for AFGL 2233. Top right: CO J = 2−1 line profile obtained with the IRAM 30 m telescope for AFGL 2233. Bottom left: azimuthally averaged profile of the CO J = 1−0 molecular emission of the central velocity channel obtained toward AFGL 2233. Bottom right: azimuthally averaged profile of the CO J = 2−1 molecular emission of the central velocity channel obtained toward AFGL 2233. The black lines correspond to the observations and the red lines correspond to the results of the model.
Download figure:
Standard image High-resolution imageTable 1. Best-fit Parameters for IRC+10401
| Shell | Rin (cm) | Rout (cm) |
 (M⊙ yr−1) (M⊙ yr−1) |
Vexp (km s−1) | T16 (K) | αt | Tmin (K) |
|---|---|---|---|---|---|---|---|
| 1 | 1 × 10¹⁴ | 3.2 × 10¹⁷ | 1.2 × 10⁻⁵ | 28 | 155 | 0.6 | 2.73 |
Download table as: ASCIITypeset image
Table 2. Best-fit Parameters for AFGL 2233
| Shell | Rin (cm) | Rout (cm) |
 (M⊙ yr−1) (M⊙ yr−1) |
Vexp (km s−1) | T16 (K) | αt | Tmin (K) |
|---|---|---|---|---|---|---|---|
| 1 | 1 × 10¹⁵ | 1.2 × 10¹⁶ | 1.5 × 10⁻³ | 32 | 100 | 0.6 | 2.73 |
| 2 | 5 × 10¹⁶ | 5 × 10¹⁷ | 8 × 10⁻⁵ | 32 | 1000 | 0.6 | 2.73 |
| 3 | 5 × 10¹⁷ | 1 × 10¹⁸ | 9 × 10⁻⁵ | 32 | 6000 | 0.6 | 2.73 |
| 4 | 1 × 10¹⁸ | 5 × 10¹⁸ | 1.5 × 10⁻⁴ | 32 | 6000 | 0.6 | 2.73 |
Download table as: ASCIITypeset image
The formation of the molecular envelope around IRC+10401 can be seen as a single mass-loss episode that lasted ∼3700 yr, with an average rate of 1.5 × 10⁻⁵ M⊙ yr−1.
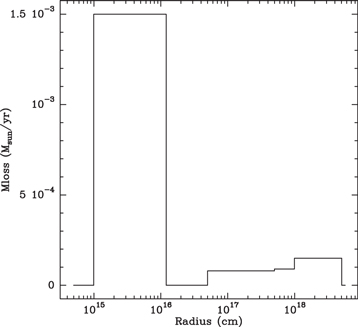
The mass-loss history of AFGL 2233 is presented in Figure 8. This can be seen as two mass-loss episodes, the first one taking place ∼50 × 103 yr ago, and decreasing until being negligible ∼500 yr ago, and a second ejection occurring ∼120 yr ago and ceasing ∼10 yr ago. The mass-loss rate of these episodes has peaks of 1.5 × 10⁻⁴ M⊙ yr−1 and 1.5 × 10⁻³ M⊙ yr−1. The large extent of the molecular gas around AFGL 2233 is compatible with the photodissociation radius given by Groenewegen (2017) for the mass-loss properties derived for this object. The CO extent predicted by Groenewegen (2017) and Mamon et al. (1988) has been extensively confirmed by the observations. In addition, the use of the CO emission for the determination of the mass-loss rates as well as the molecular content of the CSE around evolved stars has been carefully analyzed by different authors (Schöier & Olofsson 2001; Ramstedt et al. 2008; Wallerstein et al. 2011), who found it to be an accurate approach. The high mass-loss rate obtained for this object might suggest that the wind efficiency (η) is too high for dust-driven outflows. In fact, the value of η =  × vexp/(L/c) = 9.4 is high. However, as shown by Bujarrabal et al. (2001), for those objects presenting optically thick envelopes as late AGB stars, the maximum value of η is equal to the efficient opacity governing the multiple photon absorption (τeff; see, e.g., Knapp 1986; Ivezic & Elitzur 1995). This τeff takes into account the fact that a stellar photon can be re-emitted, absorbed, or scattered several times before leaving the envelope. Bujarrabal et al. (2001) estimated a maximum value of τeff ∼ 10 for evolved stars with high mass-loss rates. These objects would be heavily reddened, with their stellar emission intensively absorbed by the circumstellar dust and then re-emitted at 5–20 μm, as in the objects studied (see Figure 5). Therefore, the momentum transferred to the gas is high, but the efficiency is within the possible values.
Figure 8. Mass-loss history found for AFGL 2233.
Download figure:
Standard image High-resolution image
It is important to note that the large values of T16 obtained for the shells of AFGL 2233 do not mean that such high temperatures are reached in these regions. Following the temperature power law presented in the previous section the kinetic temperatures reached in the first shell fall in the range ∼400–100 K, while the second mass ejection presents temperatures in the range ∼550–150 K.
The mass-loss rate obtained for AFGL 2233 is relatively high when compared with standard values found for C-rich AGB stars, which fall in the range 7 × 10⁻⁸–2.7 × 10⁻⁵ M⊙ yr−1 (Olofsson et al. 1988, 1993; Loup et al. 1993; Ramstedt & Olofsson 2014; Guélin et al. 2018). These high mass-loss rates are usually found in massive evolved stars as the YHGs IRC+10420 and AFGL 2343 (Castro-Carrizo et al. 2007). Furthermore, the strong variations in the mass-loss rates found for the HVC star AFGL 2233 are similar to those reported by these same authors for the YHG AFGL 2343. On the contrary, the mass-loss rates obtained for IRC+10401 fall within this range, which might indicate that it is an AGB star rather than an RSG.
It is worth noting that the shells obtained from the modeling of the CO molecular emission correspond well with the dust shells obtained by the SED fitting.
The total masses of the ejecta derived for these two objects are ∼0.044 M⊙ for IRC+10401 and ∼1.7 M⊙ for AFGL 2233.
7. C-rich Massive Star Formation
The different results obtained in this work, together with those cited above, as the overabundance of nitrogen or the large pulsation periods, suggest that the HVC stars are massive evolved stars with a C-rich chemistry. This type of star was in general thought to be prevented by the presence of the HBB (Boothroyd et al. 1993). In this section we explore the ways in which such objects might form.
There are three possible ways in which such stars might form. The first one was that suggested by Marigo (2007), in which the HBB is extinguished in evolved and massive stars with initial masses in the 3–4 M⊙ range and metallicities above Z ≳ 0.001. The models presented by Marigo (2007) predicted that objects with initial masses and metallicities with the aforementioned characteristics would end up presenting a C/O > 1 ratio with enhanced nitrogen abundances. The metallicities of the objects presented here, IRC+10401 and AFGL 2233, are expected to be above this threshold. Due to their fast evolution, metal-poor massive evolved stars are unlikely to be observed, especially because these objects are located in the galactic plane ( ). However, the luminosity obtained for AFGL 2233 cannot be reached by objects in the mass ranged proposed by Marigo (2007), but requires a higher mass, probably Minit ≳ 20 M⊙ (Meynet & Maeder 2003).
The luminosity obtained for IRC+10401 could correspond to an AGB of 4 M⊙ and it could fall into Marigo's proposed range. However, as we have mentioned, the region of the HR diagram where IRC+10401 would be located is populated by RSGs with initial masses of ∼9 M⊙ and AGBs with initial masses above 4 M⊙. The period of this object suggests that its mass is clearly above 4 M⊙ (Whitelock et al. 2008). This scenario thus does not seem plausible, as both IRC+10401 and AFGL 2233 fall beyond the mass range proposed by Marigo (2007)
The second scenario would be a binary system with two similar stars, with masses in the range to become C-rich AGBs—for example, 3 and 4 M⊙—and one of them evolving slightly more rapidly than the other. In this case a former C-rich AGB star would have transferred its C-rich material to the current giant star, the former becoming a white dwarf (WD). The latter star should be able to acquire enough material to become a massive evolved star, which is reasonable for the typical initial masses of C-rich AGBs (∼1–4 M⊙, e.g., Zuckerman & Dyck 1986). While the WD would not be visible due to the high opacity of the circumstellar envelope, the presence of a WD could be investigated in three different ways: by the effect the UV field could have on the chemistry of the molecular gas around these objects; by the presence of a compact H ii region, which would result in recombination lines; and by the disruption produced by its presence in the structure of the ejecta. While the presence of a strong UV field from a WD could be traced by the photochemistry such a field would induce, this would depend on the intensity of the UV field. As shown by Velilla Prieto et al. (2015) the UV field of a 10,000 K main-sequence star might not create a significant impact on the chemistry of an AGB star. However, this scenario could not create an object with the characteristics, in particular the initial mass, as those of AFGL 2233. The initial mass of IRC+10401 might be low enough to be formed within this scenario or high enough to be impossible to produce such a star (Minit ≳5–9 M⊙).
The third scenario was proposed by Lattanzio & Forestini (1999). It would be that of very evolved massive stars. In this case, the HVCs would be evolved stars with initial masses above 5 M⊙ for which most of the mass has already been ejected. Under such circumstances the HBB process is expected to cease, as the weight of the remaining envelope cannot maintain the HBB. Such stars would then be very late evolved stars about to enter in the post-AGB or post-RSG phase. For these cases, the models by Lattanzio & Forestini (1999) predict C/O > 1 and at the same time a high nitrogen abundance. This scenario would be valid for both massive AGB stars and RSGs. Within this scenario, according to our results, IRC+10401 would probably be a massive AGB star and AFGL 2233 would probably be a RSG star, both very evolved.
8. Conclusions
We have modeled the CO emission around two C-rich evolved stars, AFGL 2233 and IRC+10401, which present particularly wide profiles—i.e., high expansion velocities (28–32 km s−1). These wide profiles and the strength of lines of N-bearing molecules as HCN J = 1−0 have suggested that these objects might indeed be massive C-rich stars (Likkel & Miao 1996).
We have derived luminosities of log(L/L⊙) = 4.1 for IRC+10401 and log(L/L⊙) = 5.4 for AFGL 2233. The former value can be associated both with AGB stars and RSG objects, while the latter value clearly suggest that AFGL 2233 is a RSG star. We have also modeled the CO emission from the circumstellar envelopes around these two objects. As we have mentioned, the results derived from these fits show mass-loss rates (1.5 × 10⁻⁵ for IRC+10401 and 6 × 10⁻³ M⊙ yr−1 for AFGL 2233), which again suggest that while IRC+10401 might be an AGB star (7 × 10⁻⁸–2.7 × 10⁻⁵ M⊙ yr−1, 10–15 km s−1, Ramstedt & Olofsson 2014; Guélin et al. 2018), AFGL 2233 is probably an RSG object. In fact, the C-rich stars presented by these authors as showing higher mass-loss rates also have higher expansion velocities than the HVCs studied here.
These results support the statement that these objects are not intermediate-mass AGB stars, but massive evolved stars with a C-rich envelope.
In order to confirm which of the aforementioned scenarios is responsible for the formation of IRC+10401 and AFGL 2233, the next step would be to focus on the chemistry of these objects, to confirm the N-rich C-rich scenario proposed for evolved objects with an inefficient or extinguished HBB as proposed by Lattanzio & Forestini (1999). In a forthcoming paper we will present both interferometric maps of HCN and SiO obtained toward these objects, and a λ 3 mm and 1 mm survey obtained toward IRC+10401. The former data would help to disentangle whether the large intensity of the HCN J = 1−0 line is related to maser emission or an actual abnormal high HCN abundance, while the latter would allow us to study the molecular species present in the ejecta of IRC+10401 and their abundances. The density and temperature profiles obtained from the modeling of CO emission will be essential input for these works.
The research leading to these results has received funding from the European Research Council under the European Union's Seventh Framework Programme (FP/2007-2013)/ERC grant Agreement n. 610256 (NANOCOSMOS). We would also like to thank the Spanish MINECO for funding support from grants CSD2009-00038, AYA2012-32032, AYA2016-75066-C2-1-P and AYA2016-78994-P. M.A. also thanks for funding support from the Ramón y Cajal programme of Spanish MINECO (RyC-2014-16277). This work has made use of data from the European Space Agency (ESA) mission Gaia (https://www.cosmos.esa.int/gaia), processed by the Gaia Data Processing and Analysis Consortium (DPAC, https://www.cosmos.esa.int/web/gaia/dpac/consortium). Funding for the DPAC has been provided by national institutions, in particular the institutions participating in the Gaia Multilateral Agreement.
Appendix: Expansion Velocity–Luminosity Relation
In this Appendix we reproduce the derivation of Equation (1) by Quintana-Lacaci (2008). The terminal expansion velocity (vexp) of an AGB star can be described by the equation

where ro is the radius of the dust formation zone, Q is the efficiency of the momentum transfer from the photons to the dust grains, L* is the stellar luminosity, σd and nd are the geometric cross section and the numeric density of the dust, respectively, and m and n are the equivalent masses of the gas particles and the numeric density.
If we assume that the dust properties are similar in intermediate-mass stars and massive stars, in particular that the product Q × σd does not vary, we can write

On the other side, as massive stars present higher luminosities than intermediate-mass stars, the dust formation zone (Tk ∼ 1000 K) will be farther away. It is possible to find a simple approximation to the variation of the radius of the dust formation zone (ro) if we assume a gray atmosphere—i.e.,  (ν)—and that the grains are in radiative equilibrium. Under such assumptions the product
  is conserved, and the variations in the radius of the dust formation can then be estimated to vary as
  . If we introduce this in Equation (3) we obtain

Footnotes
- ∗
Based on observations carried out with the IRAM NOEMA and 30 m. IRAM is supported by INSU/CNRS (France), MPG (Germany) and IGN (Spain).
- 7
See http://www.iram.fr/IRAMFR/GILDAS for more information about the GILDAS software.
- 8
- 9
- 10
- 11