


Abstract
We present deep near-infrared spectroscopy of six quasars at 6.1 ≤ z ≤ 6.7 with Very Large Telescope/X-Shooter and Gemini-N/GNIRS. Our objects, originally discovered through a wide-field optical survey with the Hyper Suprime-Cam (HSC) Subaru Strategic Program (HSC-SSP), have the lowest luminosities (−25.5 mag ≤ M1450 ≤ −23.1 mag) of the z > 5.8 quasars with measured black hole (BH) masses. From single-epoch mass measurements based on Mg ii λ2798, we find a wide range in BH masses, from MBH = 107.6 to 109.3 M⊙. The Eddington ratios Lbol/LEdd range from 0.16 to 1.1, but the majority of the HSC quasars are powered by MBH ∼ 109 M⊙ supermassive black holes (SMBHs) accreting at sub-Eddington rates. The Eddington ratio distribution of the HSC quasars is inclined to lower accretion rates than those of Willott et al., who measured the BH masses for similarly faint z ∼ 6 quasars. This suggests that the global Eddington ratio distribution is wider than has previously been thought. The presence of MBH ∼ 109 M⊙ SMBHs at z ∼ 6 cannot be explained with constant sub-Eddington accretion from stellar remnant seed BHs. Therefore, we may be witnessing the first buildup of the most massive BHs in the first billion years of the universe, the accretion activity of which is transforming from active growth to a quiescent phase. Measurements of a larger complete sample of z ≳ 6 low-luminosity quasars, as well as deeper observations with future facilities, will enable us to better understand the early SMBH growth in the reionization epoch.
Export citation and abstract BibTeX RIS
1. Introduction
Quasars are among the most luminous objects in the universe and are powered by mass accretion onto supermassive black holes (SMBHs). Since the 2000s, wide-field optical and near-infrared (NIR) surveys have discovered more than 200 quasars at z > 5.7 (e.g., Fan et al. 2001, 2019; Mortlock et al. 2011; Venemans et al. 2013; Reed et al. 2015; Bañados et al. 2016, 2018; Jiang et al. 2016; Mazzucchelli et al. 2017; Wang et al. 2017, 2018). One of the most remarkable aspects of the high-redshift quasars is that they are typically powered by SMBHs more massive than 1 billion solar mass (M⊙; e.g., Mortlock et al. 2011; Wu et al. 2015; Bañados et al. 2018), comparable to the most massive BHs at any redshift. For these gigantic BHs, the growth timescale from their seeds is so short that they would need to have near-constant Eddington-limit accretion from the Big Bang if they originated from the remnants of Population III (Pop III) stars (Mseed ≲ 102–3 M⊙; Heger et al. 2003; Hirano et al. 2014). This fact has put strong constraints on scenarios for SMBH formation and early growth history. The most popular scenarios to explain the mass assembly of several billion solar-mass BHs in the early universe include intense gas accretion in a super-Eddington phase (e.g., Kawaguchi et al. 2004; Inayoshi et al. 2016; Pezzulli et al. 2016) and direct collapse of primordial gas clouds resulting in 105–6 M⊙ seed BHs (e.g., Loeb & Rasio 1994; Latif et al. 2013; Chon et al. 2016). Recent reviews on seed black formation models can be found in Volonteri (2010) and Latif & Ferrara (2016).
Measurements of BH masses of high-redshift quasars allow us to determine their Eddington ratios, gaining insight into their accretion history. As the identification of z ≳ 6 quasars is based on observations of Lyα emission, independent follow-up observations are required to trace other broad emission lines that can be used to estimate the virial BH mass. In particular, Mg ii λ2798 is the line most z ≳ 6 mass measurements rely on, as Balmer lines such as Hα and Hβ fall beyond the NIR coverage of ground-based spectrographs. The C iv λ1549 emission line is another frequently used mass estimator, but it is known to be affected by nuclear-scale outflows (e.g., Shen et al. 2016; Coatman et al. 2017; Shen et al. 2019). At z > 5.8, 60 quasars to date have Mg ii–based mass measurements (Jiang et al. 2007; Kurk et al. 2007; Willott et al. 2010a, hereafter W10; De Rosa et al. 2011, 2014; Mortlock et al. 2011; Wu et al. 2015; Mazzucchelli et al. 2017; Bañados et al. 2018; Eilers et al. 2018; Wang et al. 2018; Fan et al. 2019; Matsuoka et al. 2019; Shen et al. 2019; Tang et al. 2019). Intriguingly, these studies find that, in most cases, the Eddington ratios are close to the Eddington limit (i.e., Lbol/LEdd ∼ 1), which indicates that the SMBHs at this epoch are in their most actively growing phase. Such a high accretion rate seems to be a unique characteristic of the highest-redshift quasars because the observed Eddington ratio of z ≲ 4 quasars is Lbol/LEdd ∼ 0.01–0.1 (e.g., Shen et al. 2008; Schulze et al. 2015). On the other hand, some recent papers have identified less active (i.e., sub-Eddington) SMBHs at z ≳ 6 (Mazzucchelli et al. 2017; Kim et al. 2018; Shen et al. 2019). Shen et al. (2019) derived the Mg ii–based BH mass for 30 luminous quasars and argued that there is no significant difference in the Eddington ratio distribution of z ≳ 6 quasars and lower-redshift quasars at the same luminosity range. Therefore, it still is a matter of debate whether z ≳ 6 quasars are an extremely active population.
Most of the previous studies have focused on the most luminous quasars at the reionization epoch, in other words, the most massive (MBH ≳ 109 M⊙) and active (Lbol/LEdd ∼ 1) BHs. These studies do not include less massive SMBHs whose growth is in its most intense phase or SMBHs with smaller Eddington ratios, perhaps transitioning to a quiescent phase. Therefore, mass measurements of z ≳ 6 low-luminosity quasars have the potential to reveal a less biased view of early SMBH growth. W10 presented the NIR properties of nine quasars found by the Canada–France High-z Quasar Survey (CFHQS; Willott et al. 2007). This is the only study to date to focus on the BH masses of z ≳ 6 low-luminosity quasars down to Lbol ∼ 1046.5 erg s−1.
The SMBH properties of z ≳ 6 low-luminosity quasars are also important in the context of galaxy–SMBH coevolution. Venemans et al. (2016) showed that three SMBHs at z > 6.5 are "overmassive" with respect to the dynamical mass of their host galaxies (as a proxy for stellar mass) when the mass ratio is compared to the bulge-to-BH mass ratio in the local universe (Kormendy & Ho 2013). Wang et al. (2016) and Decarli et al. (2018) found similar results for a sample of luminous quasars at z ≳ 6. However, it is possible that these objects are outliers in the buildup of the tight relation between galaxy bulge mass and central SMBH mass. Moreover, this overmassive trend is likely to be affected by luminosity bias; only the most massive SMBHs accreting at the Eddington limit will be luminous enough to enter the sample (e.g., Schulze & Wisotzki 2011).
The Hyper Suprime-Cam (HSC) Subaru Strategic Program (HSC-SSP; Aihara et al. 2018) covered ∼400 deg2 with five broadband filters (grizy) to full depth (5σ depth zlim,5σ = 25.5 mag) between the spring of 2014 and 2019 March, powered by the wide field of view of the HSC (1 5 in diameter; Miyazaki et al. 2018). With this survey, our team has recently discovered more than 80 low-luminosity quasars at z ∼ 6–7 (Matsuoka et al. 2016, 2018a, 2018b, 2019), with the highest-redshift one at z = 7.07 (HSC J1243+0100; Matsuoka et al. 2019). The number of HSC quasars is already comparable to other major surveys, such as the Sloan Digital Sky Survey (SDSS; York et al. 2000; Jiang et al. 2016) and the Panoramic Survey Telescope and Rapid Response System (Pan-STARRS1, PS1; Kaiser et al. 2010; Bañados et al. 2016), but the luminosity range of the HSC quasars is about an order of magnitude fainter than those luminous quasars, extending down to M1450 ∼ −22 mag. This unique sample of z ∼ 6–7 low-luminosity quasars now enables a study of less massive or active SMBHs in the reionization epoch.
This is our sixth paper of the Subaru High-z Exploration of Low-Luminosity Quasars (SHELLQs) project and the first to present the SMBH properties of our low-luminosity quasars. In addition to the discovery papers, Izumi et al. (2018, Paper III) and Izumi et al. (2019, Paper VIII) presented ALMA follow-up of the four quasars, in which we argue that the star formation activity of their hosts is not as extreme as those of luminous quasars, and the SMBH-to-host mass ratio is comparable to that found in the local universe. Matsuoka et al. (2018c, Paper V) presented the measurement of the quasar luminosity function at z ∼ 6. In this paper, we present NIR spectroscopic observations of six HSC quasars with the Very Large Telescope (VLT)/X-Shooter and Gemini Near-InfraRed Spectrograph (GNIRS), with a focus on virial BH mass measurements. The paper is organized as follows. The sample selection, observation, and data analysis are described in Section 2. The spectral fitting of the quasar continuum and the emission lines is described in Section 3, followed by the mass measurements in Section 4. The implications for early SMBH growth from this work are discussed in Section 5. Finally, Section 6 gives the summary and our future prospects. The magnitudes quoted in this paper are in the AB system. We adopt a standard ΛCDM cosmology with H0 = 70 km s−1 Mpc−1, Ωm = 0.3, and ΩΛ = 0.7.
2. Data
We obtained NIR spectra of six HSC quasars with X-Shooter on the VLT (UT2) and the GNIRS on Gemini-North. Both instruments are medium-resolution echelle spectrographs that enable us to observe various broad emission lines and the underlying continuum over the entire NIR wavelength range. From the parent samples of low-luminosity quasars discovered in Matsuoka et al. (2016, 2018b), we select targets for which Mg ii–based mass measurements would be feasible with ground-based 8 m telescopes. The optical redshift range is limited to zopt ≥ 6.04 to avoid severe atmospheric absorption at the Mg ii line (λobs > 1.97 μm). Also, the targets are limited to those whose absolute 1450 Å magnitudes derived from their discovery spectra are M1450 ≤ −23.8. This magnitude cut is needed to keep the required integration times under 10 hr. Therefore, our objects are at the sensitivity limit of NIR follow-up observations. We did not observe all objects satisfying these criteria but gave highest priority to objects of higher redshift and luminosity.
Table 1 summarizes our targets and observations. Our observations were carried out in queue mode between 2016 December and 2018 March at the VLT (Program ID: 098.A-0527) and between 2016 August and 2017 July at Gemini-North (Program ID: GN-2016B-FT-2, S17A0039N). We observed three quasars at 6.37 ≤ zopt ≲ 6.7 with VLT/X-Shooter (J1205−0000, J0859+0022, and J1152+0055) and three quasars at 6.09 ≤ zopt ≤ 6.26 with Gemini/GNIRS (J2239+0207, J1208−0200, and J2216−0016). The absolute 1450 Å magnitude of these quasars is roughly 2 mag fainter, on average, than the luminous SDSS and PS1 quasars at z > 5.7 (e.g., Bañados et al. 2016; Jiang et al. 2016). The six targets are also as faint as or even fainter than the moderately low-luminosity quasars presented in W10. Five of the six HSC quasars in this paper (all but J1205−0000) were followed up with ALMA to measure their host properties ([C ii] 158 μm emission line and dust continuum). The quasars J0859+0022, J1152+0055, and J2216−0016 were observed in ALMA Cycle 4 (Izumi et al. 2018); J2239+0207 and J1208−0200 were observed in ALMA Cycle 5 and will be presented in a forthcoming paper (Izumi et al. 2019).
Table 1. Our Sample and Observations
| ID | zopt | yAB | M1450,optical | Date | Instrument | Exp. Time |
|---|---|---|---|---|---|---|
| (mag) | (mag) | (hr) | ||||
| HSC J120505.09−000027.9 | 6.7–6.9a | 22.60 ± 0.03 | −24.56 ± 0.04 | 2017 Mar 31 | VLT/X-Shooter | 7.2 (NIR) |
| and 2018 Feb 15, 16, 21 | 6.5 (VIS) | |||||
| HSC J085907.19+002255.9 | 6.39 | 23.63 ± 0.07 | −24.09 ± 0.09 | 2016 Dec 29 | VLT/X-Shooter | 7.2 (NIR) |
| and Mar 23, 24, 30, 31 | 6.5 (VIS) | |||||
| and 2017 Dec 21 | ||||||
| HSC J115221.27+005536.6 | 6.37 | 21.61 ± 0.02 | −25.31 ± 0.04 | 2018 Mar 12, 13, 14, 15 | VLT/X-Shooter | 5.8 (NIR) |
| 5.2 (VIS) | ||||||
| HSC J223947.47+020747.5 | 6.26 | 22.32 ± 0.03 | −24.69 ± 0.04 | 2016 Aug 7, 8, 10 | Gemini-N/GNIRS | 2.7 |
| and Sep 27 | ||||||
| HSC J120859.23−020034.8 | 6.2a | 22.05 ± 0.03 | −24.73 ± 0.02 | 2017 Feb 17, 18, 19 | Gemini-N/GNIRS | 3.7 |
| HSC J221644.47−001650.1 | 6.09 | 22.96 ± 0.04 | −23.82 ± 0.04 | 2017 Jun 25, 26, 28 | Gemini-N/GNIRS | 9.0 |
| and Jul 3, 5 |
Note. The optical redshift zopt and the 1450 Å magnitude quoted in this table are from our discovery papers (Matsuoka et al. 2016, 2018b). The y-band PSF magnitudes are from the latest HSC-SSP internal source catalog (DR S18A). Galactic extinction is corrected (Schlegel et al. 1998). For the X-Shooter targets, we separately show the total exposure times in the NIR and VIS arms.
aThe optical redshifts are uncertain due to an unusual spectrum (J1205−0000; Matsuoka et al. 2016 and Section 3.3.1 in this paper) and due to an unsharp Lyman break (J1208−0200; Matsuoka et al. 2018b).Download table as: ASCIITypeset image
2.1. VLT/X-SHOOTER
The VLT/X-Shooter consists of three echelle spectrographs covering different wavelength ranges: UVB (λobs = 3000–5600 Å), VIS (λobs = 5500–10200 Å), and NIR (λobs = 10200–24800 Å) arms. We only observed with the VIS and NIR arms because z ≳ 6 quasars have no signal in the UV arm due to strong absorption by the intergalactic medium. The slit width was set to 0 9 in both arms. The VIS arm was set to high-gain 2 × 2 pixel-binning slow-readout mode. This configuration results in a moderate spectral resolution of R ∼ 7410 in the VIS arm and R ∼ 5410 in the NIR arm. Blind offsets from nearby bright stars were used for target acquisition. The integration was divided into pairs of ∼200 s single exposures to subtract time-varying sky emission lines with the standard ABBA offset procedure. The VLT targets were observed at an airmass of ∼1.1–1.3, with moderate seeing (∼08). The data were processed with the dedicated ESO X-Shooter pipeline version 2.9.3 (Reflex). The ABBA exposures were stacked. Tracing the dispersion direction gave an averaged spatial profile, which we fit to a Gaussian to use as weights for the extraction. For relative flux calibration, A-type standard stars were observed. Atmospheric absorption was corrected with sky transmission models obtained from SkyCalc version 2.0.1 assuming the seasonal average at the observation dates and airmass.15
Absolute flux calibration for J0859+0022 and J1152+0055 was based on the HSC z-band magnitudes in the internal S18A data release (zAB = 22.79 ± 0.01 and zAB = 21.82 ± 0.01, respectively). For J1205−0000, the Ks magnitude of the VISTA Kilo-Degree Infrared Galaxy Survey (VIKING; Arnaboldi et al. 2007) was used. After stacking the 1D spectra taken on different dates, we smoothed the extracted spectra with a Gaussian kernel of σkernel = 10 pixels (FWHM ∼ 200 km s−1 at the K band) in the NIR arm and σkernel = 15 pixels (FWHM ∼ 200 km s−1 at the z band) in the VIS arm. Figure 1 (top three panels) shows the optical-to-NIR spectra of the three VLT targets.
9 in both arms. The VIS arm was set to high-gain 2 × 2 pixel-binning slow-readout mode. This configuration results in a moderate spectral resolution of R ∼ 7410 in the VIS arm and R ∼ 5410 in the NIR arm. Blind offsets from nearby bright stars were used for target acquisition. The integration was divided into pairs of ∼200 s single exposures to subtract time-varying sky emission lines with the standard ABBA offset procedure. The VLT targets were observed at an airmass of ∼1.1–1.3, with moderate seeing (∼08). The data were processed with the dedicated ESO X-Shooter pipeline version 2.9.3 (Reflex). The ABBA exposures were stacked. Tracing the dispersion direction gave an averaged spatial profile, which we fit to a Gaussian to use as weights for the extraction. For relative flux calibration, A-type standard stars were observed. Atmospheric absorption was corrected with sky transmission models obtained from SkyCalc version 2.0.1 assuming the seasonal average at the observation dates and airmass.15
Absolute flux calibration for J0859+0022 and J1152+0055 was based on the HSC z-band magnitudes in the internal S18A data release (zAB = 22.79 ± 0.01 and zAB = 21.82 ± 0.01, respectively). For J1205−0000, the Ks magnitude of the VISTA Kilo-Degree Infrared Galaxy Survey (VIKING; Arnaboldi et al. 2007) was used. After stacking the 1D spectra taken on different dates, we smoothed the extracted spectra with a Gaussian kernel of σkernel = 10 pixels (FWHM ∼ 200 km s−1 at the K band) in the NIR arm and σkernel = 15 pixels (FWHM ∼ 200 km s−1 at the z band) in the VIS arm. Figure 1 (top three panels) shows the optical-to-NIR spectra of the three VLT targets.

Figure 1. Optical-to-NIR spectra of the six HSC quasars in this paper. The top three panels show the X-Shooter spectra of J1205−0000, J0859+0022, and J1152+0059. The next three show the GNIRS spectra of J2239+0207, J1208−0200, and J2216−0016, while their optical data (λobs ≲ 1 μm) are from the discovery spectra (Matsuoka et al. 2016, 2018b). The bottom panel shows the atmospheric transmission at Maunakea retrieved from the Gemini Observatory (Lord 1992). The vertical lines indicate the central wavelength of broad emission lines expected from the systemic redshift (Mg ii redshift for J1205−0000 and [C ii] redshift from Izumi et al. 2018, 2019 for the others). In each panel, the noise spectra are shown in gray, and the best-fit power-law continuum models are shown in blue.
Download figure:
Standard image High-resolution image2.2. Gemini/GNIRS
The GNIRS observations were carried out in cross-dispersed mode to cover the observed wavelengths of λobs ∼ 0.9–2.5 μm, corresponding to the rest-frame wavelengths of λrest ≈ 0.12–0.35 μm. We used the 31.7 lines mm−1 grating and the short camera (015 pixel−1). The 0675 slit was used for J1208−0200 and J2216−0016, which results in a spectral resolution of R ∼ 760. A slightly wider 10 slit was used for J2239+0207 because the reference star for the blind offset acquisition was relatively far (∼40'') from the quasar. A spectral resolution of R ∼ 510 was achieved in this case. The single exposure time was set to 300 s with the standard ABBA nodding offset. The observation was carried out in moderate weather conditions at airmass ∼1.1–1.2 and a seeing size of ∼05–11. We observed nearby A-type stars at similar airmass every ∼1–2 hr during the observations to use their spectra to correct for atmospheric absorption.
The GNIRS data were reduced with the dedicated Gemini IRAF pipeline version 1.13. Following the standard procedure, we first flat-fielded the 2D spectra and subtracted the sky background using each pair taken at the A and B nod positions. The 2D spectra taken on each night were stacked to maximize the signal-to-noise ratio. Distortion correction was done based on the GNIRS pinhole spectra. After the 2D spectra were straightened in each order, the pixel-to-wavelength calibration was determined with the arc spectra. The 1D extraction was performed in the same way as the X-Shooter spectrum. The A-type star spectra were reduced in the same manner and used for relative flux calibration and atmospheric absorption correction. The spectra observed on different dates were combined at this stage. The absolute flux calibration was done by scaling the derived spectra to the broadband photometry. The HSC y magnitude was used for J2239+0207. As the bluest order of the spectrum is too noisy for J2216−0016 and its average spatial profile cannot be determined, we estimate the J-band magnitude by extrapolating the HSC y magnitude with a power-law continuum derived in the continuum fitting (Section 3). The GNIRS spectrum is scaled to match the expected J-band magnitude. Though J1208−0200 is visible in the VIKING DR3 images, it is not listed in the source catalog. We measured its 2'' aperture photometry in the Ks-band image (Ks = 21.66 ± 0.13) with SExtractor version 2.1.5 (Bertin & Arnouts 1996) and used this to scale the spectrum. Finally, all of the orders were combined into one spectrum, and the obtained spectra were smoothed with a Gaussian kernel with σkernel = 1 pixel (FWHM ≈ 200 km s−1 at the K band). Figure 1 (fourth to sixth panels) shows the NIR spectra of the three GNIRS targets. In this figure, the optical data are from discovery spectra taken by Subaru/FOCAS (Matsuoka et al. 2016, 2018b).
3. Spectral Fitting
The derived NIR spectra are fitted with a multicomponent continuum + emission line model. We first subtract the power-law continuum and the iron emission line forest to measure the broad emission lines. The Balmer continuum is also typically taken into account in similar analyses of the literature (De Rosa et al. 2014; Mazzucchelli et al. 2017), but we ignore this third component due to the relatively low spectrum quality.
3.1. Continuum
The most dominant component of the rest-frame UV spectrum of an unobscured quasar is the power-law continuum. Here we model the observed continuum with a single power law,

where F0 is the scaling factor and αλ is the power-law index. The slope of the quasar continuum is known not to evolve with redshift, with the most commonly used values in the literature of αλ = −1.5. Selsing et al. (2016) found a slope of αλ = −1.70 from their composite X-Shooter spectrum of 1 < z < 2 quasars. At higher redshift, Cristiani et al. (2016) compiled 1669 luminous quasars at 3.6 < z < 4.0, showing a median slope of αλ = −1.36 with a dispersion of 0.36.
The secondary component is the forest of iron emission lines. These lines are observed as a pseudo-continuum because iron has thousands of blended weak emission lines at λrest ≈ 2000–3000 Å, which affects the measurement of the Mg ii line. In this work, we use the empirical template of Vestergaard & Wilkes (2001), which is derived from a high-resolution spectrum of I Zw I, a nearby Seyfert 1 galaxy at z = 0.061 with relatively narrow and strong iron emission lines. While there is no flux at the Mg ii region in the Vestergaard & Wilkes (2001) iron template, we added constant flux in their template at λrest = 2770–2820 Å to include unidentified iron emission underneath Mg ii. We follow Kurk et al. (2007) and add 20% of the mean continuum flux density at λrest = 2930–2970 Å. The narrow iron emission lines are smoothed with a Gaussian kernel in logarithmic wavelength space with

where FWHMI Zw I = 900 km s−1 is the line width of the I Zw I template and FWHMQSO is the line width of the target quasar. Three broadened iron templates with FWHMQSO = 1000, 2500, and 5000 km s−1 are generated and used in the spectral fitting.
We estimate the relative contribution of the power-law and iron components with an iterative process (Vestergaard & Wilkes 2001). First, a power law is fitted to selected regions in the spectra. We avoid the order gaps and regions where emission and absorption lines are visible; thus, the fitted regions vary from target to target. In the initial fitting, only the cleanest range is selected. Second, after subtracting the estimated power-law model, the iron templates are fitted to the residuals by scaling the templates. The fitting windows for the iron templates are λrest = 2200–2750 and 2850–3090 Å, while we manually removed regions where atmospheric absorption is severe and the continuum is not smooth.16 The best iron templates with the smallest residuals are chosen at this stage. After determining the scale of the iron templates, the best-fit iron models are subtracted from the original spectra, and the power-law continuum is fitted again with a larger fitting window. Most of the continuum range is included in this step. Then, the iron template is fitted again after subtracting the newly determined power-law continuum model. This iterative fitting is repeated until achieving convergence of <1%. The result of this continuum measurement for each quasar is summarized in Table 2. The range of the power-law index is −1.58 ≤ αλ ≤ −1.04, except for J1205−0000 (Section 3.3.1). Since this range is consistent with typical values for type I quasars, we assume that the host galaxy contribution to the observed continuum is negligible. The best-fit continuum (power law + iron) models are shown in Figure 1. It is noted that only the NIR spectra (λobs ≳ 1 μm) are used to determine the continuum models, but the best-fit power-law models fit the optical spectra well.
Table 2. Best-fit Continuum Parameters
| J1205−0000a | J0859+0022 | J1152+0055 | J2239+0207 | J1208−0200 | J2216−0016 | |
|---|---|---|---|---|---|---|

|

|

|

|

|

|

|
| M1450 | −25.54 ± 0.28 | −23.10 ± 0.27 | −25.08 ± 0.07 | −24.60 ± 0.15 | −24.36 ± 0.09 | −23.65 ± 0.20 |
Note.
aFor J1205−0000, we use only the H- and K-band spectra for the continuum fitting. See Figure 1 and Section 3.3.1.Download table as: ASCIITypeset image
The uncertainties of the continuum parameters are measured by a Monte Carlo approach (Shen et al. 2011). From each unsmoothed flux-calibrated spectrum, 100 mock spectra are generated by adding random noise to each spectral pixel based on its noise vectors. The mock spectrum is then smoothed by the same Gaussian kernels, and the power law + iron pseudo-continuum is fitted with the same procedure as the original spectrum. The 1σ uncertainty is given by the 16th and 84th percentiles of the distribution of the best-fit values. Finally, we update the rest-frame 1450 Å magnitude with the best-fit power-law continuum models and their uncertainties, as reported in Table 2. Note that the absolute continuum magnitude of J0859+0022 is about 1 mag fainter than the value quoted by Matsuoka et al. (2018b). This discrepancy is at least partly due to the low quality of the spectrum used in that paper (a 30 minute exposure with Subaru/FOCAS) and their different and narrower fitting window (λrest = 1265–1345 Å) than that of this paper (λrest = 1420–3040 Å).
3.2. Emission Lines and Redshifts
We fit the strong UV emission lines (C iv λ1549, C iii] λ1909, and Mg ii λ2798) after subtracting the best-fit continuum (power-law and iron emission lines) models. We detect broad Mg ii and C iv emission lines for all six quasars, while C iii] is also detected in J1208−0200 (and tentatively in J2239+0207 and J2216−0016). There are also other weaker lines visible in the NIR spectra: S iv λ1397 (J1205−0000, J1152+0055, J2239+0207, J1208−0200) and He ii λ1640 (J1152+0055, J1208−0200, J2216−0016). The strong emission lines are fitted with a Gaussian profile with the free parameters of scaling factor, central wavelength, and line width. We use a single Gaussian in most cases but fit a second Gaussian when the emission lines have broad line skirts or asymmetric profiles that cannot be well fitted with a single Gaussian. The central wavelengths of the two Gaussian components are fixed at the same positions in all cases except the C iv emission line of J2216−0016, which shows significant asymmetry. We measure the Mg ii redshift from the best-fit Gaussian profile. For J1205−0000, we shift the iron templates assuming the Mg ii redshift and repeat the continuum+line fitting until the best-fit Gaussian returns the same redshift. We also measure blueshifts with respect to [C ii] redshift for Mg ii, C iv, and C iii]. The uncertainties of the line profiles are measured with the 100 mock spectra that we use in measuring the uncertainties of continuum parameters. For each mock spectrum, we subtract the best-fit continuum model and fit single or double Gaussian profiles to the residuals in order to take into account the effects that the continuum estimate potentially has on the line profile measurements. The derived emission line properties, including the redshift measurements, are shown in Table 3. Figures 2 and 3 show our best-fit continuum+line models around Mg ii and C iv, respectively. The C iii] line of J1208−02000 is also shown in Figure 3.
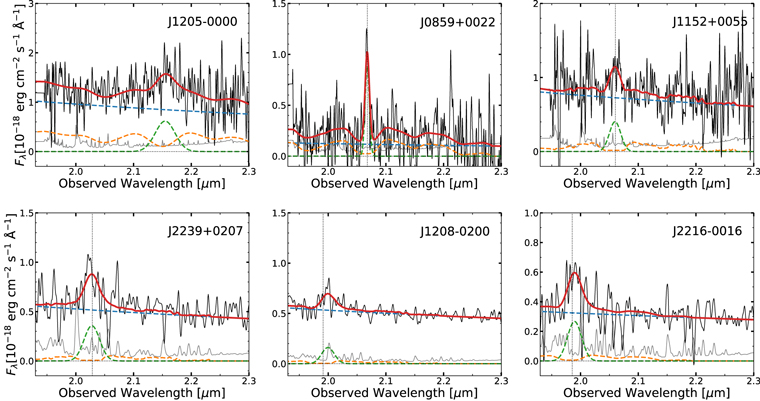
Figure 2. Best-fit continuum+line models around Mg ii. The best-fit models are shown in blue (power law), orange (iron), green (Gaussian), and red (sum of the three models). The vertical lines show the systemic redshift obtained from [C ii] emission lines (Izumi et al. 2018, 2019).
Download figure:
Standard image High-resolution image
Figure 3. Best-fit continuum+line model around C iv (all objects) and C iii] (J1208−0200). Shading shows the masked regions in the emission line fitting.
Download figure:
Standard image High-resolution imageTable 3. Emission Line Parameters and Redshifts
| J1205−0000 | J0859+0022 | J1152+0055 | J2239+0207 | J1208−0200 | J2216−0016 | |
|---|---|---|---|---|---|---|
| FWHMMg ii (km s−1) |

|

|

|

|

|

|
| EWMg ii (Å) |

|

|

|

|

|

|
| FWHMC iii],broad (km s−1) | ⋯ | ⋯ | ⋯ | ⋯ |

|
⋯ |
| FWHMC iii],narrow (km s−1) | ⋯ | ⋯ | ⋯ | ⋯ |

|
⋯ |
| EWC iii],broad (Å) | ⋯ | ⋯ | ⋯ | ⋯ |

|
⋯ |
| EWC iii],narrow (Å) | ⋯ | ⋯ | ⋯ | ⋯ |

|
⋯ |
| FWHMC iv,broad (km s−1) | ⋯ |
 a
a
|
 a
a
|
 a
a
|
 a
a
|
 a
a
|
| FWHMC iv,narrow (km s−1) | ⋯ | ⋯ | ⋯ | ⋯ |
 a
a
|
 a
a
|
| EWC iv,broad (Å) | ⋯ |
 a
a
|
 a
a
|
 a
a
|
 a
a
|
 a
a
|
| EWC iv,narrow (Å) | ⋯ | ⋯ | ⋯ | ⋯ |
 a
a
|
 a
a
|
| ΔvMg ii−[C ii](km s−1) | ⋯ |

|

|

|

|

|
| ΔvC iii]−[C ii] (km s−1) | ⋯ | ⋯ | ⋯ | ⋯ |

|
⋯ |
| ΔvC iv−[C ii] (km s−1) | ⋯ |

|

|

|

|

|
| zMg ii |
 b
b
|

|

|

|

|

|
![${z}_{[{\rm{C}}{\rm{II}}]}$](https://content.cld.iop.org/journals/0004-637X/880/2/77/revision1/apjab29e9ieqn55.gif)
|
⋯ | 6.3903b | 6.3637b | 6.2499b | 6.1165b | 6.0962b |
Notes. The line widths are corrected for instrumental broadening. The equivalent widths are given in the rest-frame values. For the velocity offsets of emission lines, blueshifts are shown in positive values.
aEmission lines affected by absorption lines. bWe use the [C ii] redshift as the systemic redshift for five objects, while we use the Mg ii redshift for J1205−0000.Download table as: ASCIITypeset image
Intriguingly, we found C iv absorption lines either at the line peak (J0859+0022, J1152+0055, J1208−0200, J2216−0016) or in the blue wing (J1205−0000, J2239+0207) in all six of our sources. These absorption regions are masked in the line measurements (Figure 3). This high broad absorption line (BAL) or associated absorption fraction seems to be higher than that of both more luminous z > 5.8 quasars and lower-redshift quasars (≲16% for BALs; Maiolino et al. 2004; Shen et al. 2019). Our sample is small, however; observations of additional low-luminosity z ∼ 6 quasars are needed to see if this trend continues.
We adopt the [C ii] 158 μm redshifts as the systemic redshifts, which were measured in Izumi et al. (2018) for J0859+0022, J1152+0055, and J2216−0016 and Izumi et al. (2019) for J2239+0207 and J1208−0200. We use the Mg ii redshift for J1205−0000 as a proxy for its systemic redshift, because this quasar has not yet been observed with ALMA. It is known that the C iv λ1549 emission line is frequently blueshifted (e.g., Shen et al. 2016; Coatman et al. 2017). Among the HSC quasars in this study, we find a significant C iv blueshift (≈400–600 km s−1) for four quasars (J1152+0055, J2239+0207, J1208−0200, and J2216−0016), while J0859+0022 shows a slightly redshifted C iv. Given that the flux density in the blue wing of C iv is around zero, which we mask in the line fitting, the C iv emission line of J0859+0022 may be affected by the BAL absorption, which would shift the observed peak of the emission line to longer wavelengths, giving a negative blueshift. The C iv velocity offsets from Mg ii are <2000 km s−1, which is broadly consistent with what is found for luminous z ∼ 6 quasars (Meyer et al. 2019; Shen et al. 2019).17
The C iv emission line of J2216−0016 has broad and narrow components with different central wavelengths, while its narrow peak is affected by an absorption line. We determine its C iv blueshift ΔvC iv−[C ii],narrow =  from its best-fit narrow Gaussian (FWHM =
  km s−1), while the central wavelength of its broad component is somewhat redder, corresponding to ΔvC iv−[C ii],broad =
  km s−1(FWHM =
  km s−1).
Wang et al. (2016) found that, at z ∼ 6, even Mg ii is often blueshifted (∼1000 km s−1) with respect to the [C ii] redshift. However, we do not find such large Mg ii blueshifts for any of the HSC quasars (≲200 km s−1). The Mg ii emission line of J1208−0200 is redshifted relative to [C ii] by ![${\rm{\Delta }}{v}_{\mathrm{Mg}{\rm{II}}-[{\rm{C}}{\rm{II}}]}=-{1260}_{-350}^{+430}$](https://content.cld.iop.org/journals/0004-637X/880/2/77/revision1/apjab29e9ieqn60.gif) km s−1. This Mg ii offset may be affected by OH sky emission line residuals around the line peak (λobs ∼ 2.00 μm; Figure 3).
km s−1. This Mg ii offset may be affected by OH sky emission line residuals around the line peak (λobs ∼ 2.00 μm; Figure 3).
3.3. Notes on Individual Objects
Here we look at two quasars that show peculiar spectral properties: J1205−0000 (Section 3.3.1) and J0859+0022 (Section 3.3.2).
3.3.1. J1205−0000
J1205−0000 shows a remarkably flat continuum in its X-Shooter spectrum. It is detected in NIR surveys despite its faintness in the optical (y = 22.61), as was pointed out by Mazzucchelli et al. (2017). The 2'' aperture magnitudes in the VIKING DR318 are J = 21.92 ± 0.21, H = 21.46 ± 0.34, and Ks = 20.72 ± 0.18. The quasar is even detected in ALLWISE19 with W1 = 19.98 ± 0.15 and W2 = 19.65 ± 0.23. Thus, y − W2 is 2.96 ± 0.23.
Those spectral and broadband properties of J1205−0000 can be attributed to its obscured nature. Mazzucchelli et al. (2017) estimated the dust reddening of this object as E(B − V) = 0.3 (or AV = 0.9 mag, assuming the Galactic mean value of RV = 3.1; Cardelli et al. 1989). They fit the composite spectrum of low-redshift quasars derived in Selsing et al. (2016) to the broadband SED (J, H, Ks, W1, W2) with the Calzetti extinction law (Calzetti et al. 2000). However, we noticed that J1205−0000 has two nearby sources visible in the HSC y image. They are close enough that they likely contaminate the WISE flux of J1205−0000. Such contamination would cause one to overestimate the amount of dust extinction. Our WISE flux decomposition and estimate of dust reddening of J1205−0000 will be fully described in a forthcoming paper (N. Kato et al., in preparation).
To measure the Mg ii emission line of J1205−0000 in this paper, we restrict the power-law continuum fitting window to λobs > 1.5 μm. For the iron emission lines, we use the same fitting window as the other HSC quasars. We extrapolate the best-fit power-law continuum ( ) to determine an absolute 1450 Å magnitude, M1450 = −25.54 ± 0.28. The Mg ii line profile is measured after subtracting the best-fit power-law continuum plus iron emission line models determined in this way. Our best-fit Mg ii profile (
 , FWHM =
  km s−1) is significantly different from that of Mazzucchelli et al. (2017; zMg ii = 6.73, FWHM = 8841 km s−1) based on a 4 hr integration with the 6.5 m Magellan FIRE instrument. This difference is likely due to confusion of the true Mg ii emission line with the underlying iron emission in their noisy spectrum.
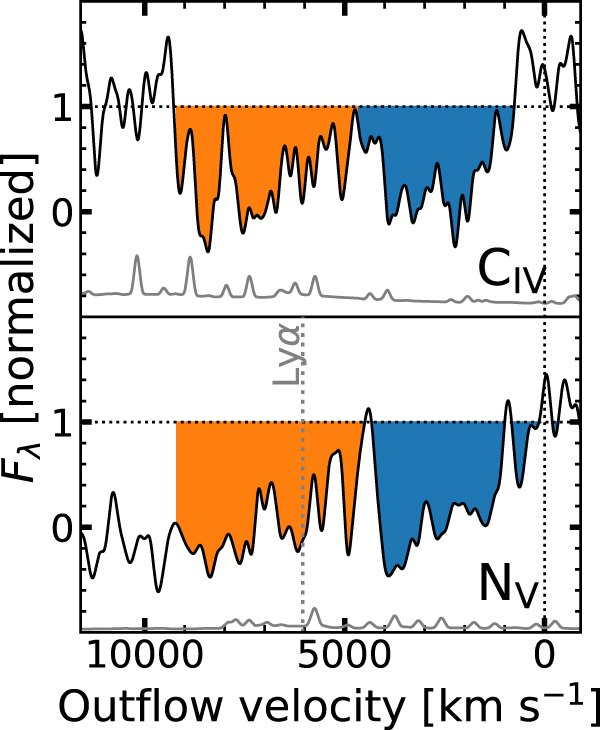
Matsuoka et al. (2016) were unable to determine a reliable optical redshift of J1205−0000 from its Subaru/FOCAS spectrum (zopt = 6.7–6.9) because of its unusual spectral shape around the Lyman break. The Mg ii detection in the deep X-Shooter spectrum gives a more precise measurement of the systemic redshift,  . As seen in Figure 1, this quasar has strong BALs of high-ionization lines (C iv, Si iv, and N v). Dust-reddened quasars seem to have a higher BAL fraction than unobscured quasars (e.g., Richards et al. 2003). The BAL features of J1205−0000 are also visible in the Magellan/FIRE spectrum of Mazzucchelli et al. (2017). The quasar J1205−0000 is one of the highest-redshift BAL quasars known to date, behind DELS J0038–1527 at z = 7.02 (Wang et al. 2018) and also possibly HSC J1243+0100 at z = 7.07 (Matsuoka et al. 2019). Figure 4 shows the outflow velocity of C iv and N v, in which the spectrum is normalized by constant flux. The normalization scale is determined redward of each emission line. There are two strong outflow components of C iv BALs, with the first (system 1) having a velocity of ∼2900 km s−1 and the second (system 2) having ∼7400 km s−1. While not robust, those absorption lines may be further split into two components (∼1000 and ∼4000 km s−1 for system 1 and ∼7000 and ∼8000 km s−1 for system 2). These (at least) two systems absorb Lyα emission, making it invisible (Figure 4). Extreme BAL quasars like J1205−0000 have been found in lower-redshift dust-reddened quasars (Hall et al. 2002; Maiolino et al. 2004; Ross et al. 2015).

Figure 4. The BALs of J1205−0000. The top and bottom panels show the normalized spectrum around C iv from the NIR arm and N v from the VIS arm, respectively, with the wavelength converted to outflow velocity. The NIR arm spectrum is smoothed with a Gaussian kernel with σkernel = 5 pixels (FWHM ∼ 180 km s−1 at C iv), while the VIS arm spectrum is smoothed with σkernel = 15 pixels (FWHM ∼ 220 km s−1 at N v). The two outflow components are shown in blue and orange for each line. The vertical line at 6050 km s−1 in the bottom panel corresponds to the central wavelength of Lyα expected from the Mg ii redshift.
Download figure:
Standard image High-resolution image3.3.2. J0859+0022
The faintest of the six HSC quasars, J0859+0022 has a continuum absolute magnitude of M1450 = −23.10 ± 0.27 mag. This is at the intersection of the luminosity functions of quasars and Lyman break galaxies at z ∼ 6 (Onoue et al. 2017; Matsuoka et al. 2018c). Its NIR X-Shooter spectrum shows a weak continuum with strong and narrow emission lines ( and
and  km s−1). In the optical spectrum of X-Shooter, the red part of the Lyα emission line is well fitted by a double Gaussian with
  and
and  km s−1. The N v emission line is fitted by a single Gaussian with
  km s−1. We measure the Lyα + N v rest-frame equivalent width EWLyα+N v = 252 Å (log EW = 2.40 Å) by integrating the flux above the best-fit power-law continuum at λrest = 1160–1290 Å (Diamond-Stanic et al. 2009). The EW distribution is lognormal, with a mean of
  and dispersion of σ (log EWLyα+N v (Å)) = 0.391 (Bañados et al. 2016). Therefore, the Lyα + N v rest-frame EW of J0859+0022 deviates from the average by 2.2σ.
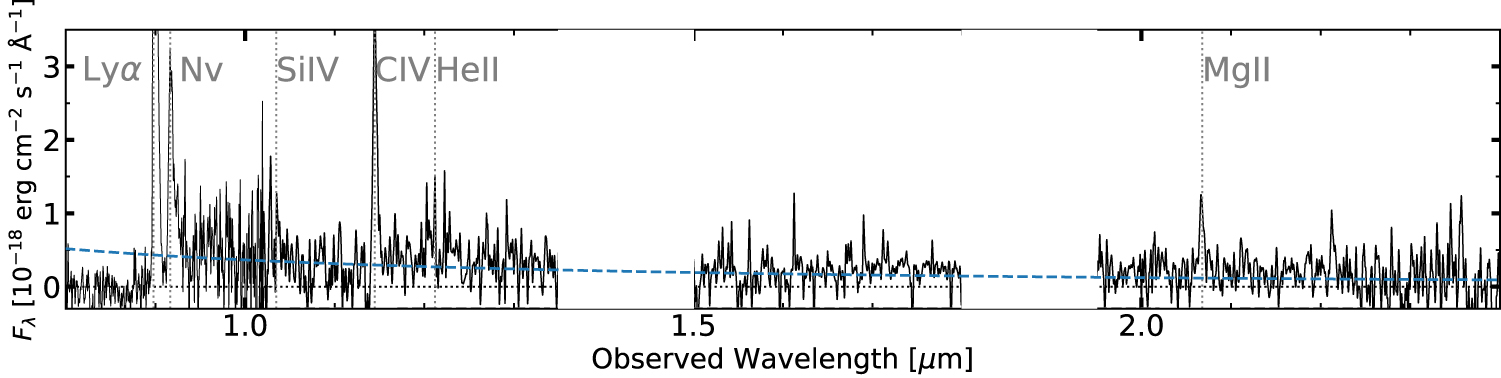
Those emission line properties are reminiscent of type II quasars; however, we assume that J0859+0022 is a low-luminosity type I active galactic nucleus (AGN) for the following reasons. First, the blue continuum slope of J0859+0022 ( ) is typical for an unobscured quasar (Vanden Berk et al. 2001). Figure 5 shows the continuum of J0859+0022 with its best-fit power-law model. Second, the presence of the iron emission line forest further supports the identification of this quasar as a type I quasar (Figure 2). Indeed, if we fit the continuum of J0859+0022 with a power-law model only, the reduced χ2 of the data in the iron fitting window is worse by
  than the best-fit power-law + iron model, though the iron is unambiguously detected. Therefore, J0859+0022 is likely a low-luminosity type I AGN and the high-redshift analog of the local narrow-line Seyfert 1 galaxies (NLS1s; Osterbrock & Pogge 1985; Constantin & Shields 2003). Indeed, J0859+0022 has similar continuum and emission line properties to the 2 < z < 4.3 NLS1s reported in a spectroscopic search of high-redshift type II quasar candidates (Alexandroff et al. 2013).

Figure 5. Continuum of J0859+0022. The NIR spectrum is smoothed with an FWHM = 20 pixel Gaussian kernel.
Download figure:
Standard image High-resolution image4. BH Mass and Eddington Ratio
Emission lines of type I quasars are broad because of the Doppler motion in the broad-line region (BLR) gas. We can use the width of these lines to estimate the central BH mass, with the assumption that the BLR gas is gravitationally bound to the SMBHs. The virial mass is given by

where G is the gravitational constant, vBLR is the velocity of the orbiting BLR gas around the central BH, and RBLR is the distance from the BH to the BLR. The scaling factor f takes into account the geometry.
For the Mg ii–based BH mass estimate of the HSC quasars, we follow the scaling relation (the so-called "single-epoch" method) given in Vestergaard & Osmer (2009),

where FWHM(Mg ii) is the FWHM of the Mg ii line and λLλ (3000 Å) is the monochromatic luminosity at rest frame 3000 Å. This relation is based on reverberation mapping studies that found a tight relation between continuum luminosity and BLR radius at low redshift (e.g., Kaspi et al. 2005). The measurement uncertainties of the virial BH masses are derived by propagating the measurement errors of the Mg ii line widths and the monochromatic luminosity. The systematic uncertainty is usually larger than the errors of the single-epoch masses. We adopt 0.5 dex as a 1σ uncertainty of the virial mass estimate (Shen 2013). It is possible that part of the narrow Mg ii emission line of J0859+0022 originates from the narrow-line region; however, we use the observed width as a "broad" line because the X-Shooter spectrum cannot clearly distinguish the two components. Therefore, our line measurement may overestimate the line flux and underestimate the line width of the BLR gas.
We also measure the C iv–based mass for three objects (J0859+0022, J1152+0055, and J2239+0207) without absorption lines at the C iv line peaks. We use the scaling relation of Vestergaard & Peterson (2006):

We assume the same systematic uncertainty (0.5 dex) for the C iv–based mass as the Mg ii–based mass (Shen 2013).
Once we have measured the BH mass, we can determine the Eddington luminosity of the quasars. The Eddington luminosity LEdd is proportional to the BH mass:

For each quasar, we compute the bolometric luminosity Lbol to determine the Eddington ratios. For this purpose, we apply the bolometric correction given in Richards et al. (2006):

We compile the Mg ii line measurements of z > 5.8 quasars from the literature to compare with the SMBH properties of the HSC quasars. There have been Mg ii line measurements made for 60 quasars in total (Jiang et al. 2007; Kurk et al. 2007; W10; De Rosa et al. 2011, 2014; Mortlock et al. 2011; Wu et al. 2015; Mazzucchelli et al. 2017; Bañados et al. 2018; Eilers et al. 2018; Wang et al. 2018; Fan et al. 2019; Matsuoka et al. 2019; Shen et al. 2019; Tang et al. 2019). We use the most recent measurements when more than one measurement exists for the same objects, while for CFHQS quasars, we use the original measurements by W10.20 Specifically, the five z ∼ 6 quasars in Kurk et al. (2007) are replaced with measurements by Jiang et al. (2007) and De Rosa et al. (2011). The z > 6.5 quasars in Mortlock et al. (2011) and De Rosa et al. (2014) are replaced with measurements by Mazzucchelli et al. (2017). Figure 6 shows the distribution of the measured Mg ii line FWHM and the 3000 Å monochromatic luminosity for this entire sample, including the HSC quasars in this paper and HSC J1243+0100 (Matsuoka et al. 2019).

Figure 6. Distribution of Mg ii FWHM and monochromatic luminosity at rest frame 3000 Å for z > 5.8 quasars. The HSC quasars in this work are shown as filled red diamonds, while HSC J1243+0100 at z = 7.07 (Matsuoka et al. 2019) is shown as a magenta diamond. Other z > 5.8 quasars whose MBH measurements have been derived in the literature are shown as blue dots. The luminosity of the non-HSC quasars is measured with the same cosmology as that of the HSC quasars. The CFHQS quasars from W10 are marked with circles.
Download figure:
Standard image High-resolution imageOur measurements of the virial BH masses and the Mg ii–based Eddington ratios are summarized in Table 4. Figure 7 shows the distribution of the HSC quasars in the SMBH mass–luminosity plane. We include the 0.5 dex systematic uncertainty of the BH mass in the error bars, which dominates the uncertainty of our mass measurements. We measured the BH masses of the non-HSC quasars with the same scaling relation (Equation (4)) and cosmology adopted in this work, rather than just quoting the values in the reference papers. Their bolometric luminosities are also calculated from the 3000 Å monochromatic luminosity in the same way as the HSC quasars (Equation (7)). We find that the Mg ii–based MBH of the six HSC quasars spans a wide range of 3.8 × 10⁷ M⊙ ≤ MBH ≤ 2.2 × 10⁹ M⊙ and, accordingly, a wide range of the Eddington ratio of 0.16 ≤ Lbol/LEdd ≤ 1.1. J0859+0022 hosts a 107 M⊙ SMBH, which is the least massive SMBH known at z > 5.8, and has a similarly high Eddington ratio to the most active quasars at the same epoch. On the other hand, it is remarkable that the other HSC quasars are powered by 109 M⊙ SMBHs with sub-Eddington accretion, as is HSC J1243+0100 (MBH = (3.3 ± 2.0) × 108 M⊙, Lbol/LEdd = 0.34 ± 0.20; Matsuoka et al. 2019). The average Eddington ratio of those six sub-Eddington quasars (i.e., excluding J0859+0022) is  . Their masses and accretion rates overlap with the range of typical z ∼ 2 SDSS DR7 quasars (Shen et al. 2011). Note that the quoted value for J1205−0000, the dust-reddened quasar, is not corrected for extinction; therefore, the quoted mass and accretion rate in Table 4 should be considered to be upper and lower limits, respectively.

Figure 7. The SMBH mass–luminosity plane of z > 5.8 quasars, the BH mass MBH of which have been measured to date with Mg ii. The symbols and colors are the same as in Figure 6. The quoted virial masses are derived using the scaling relation of Vestergaard & Osmer (2009). For non-HSC quasars, we quote their Mg ii line and continuum measurements to calculate MBH and bolometric luminosity with the same relation and cosmology as those applied for the HSC quasars (Equation (4)). The systematic uncertainty of the virial BH mass measurement (0.5 dex; Shen 2013) is included in the error bars. Contours show the distribution of the z ∼ 2 SDSS DR7 quasars (Shen et al. 2011). The diagonal lines show Eddington luminosities of Lbol/LEdd = 1, 0.1, and 0.01 from top left to bottom right.
Download figure:
Standard image High-resolution imageTable 4. Black Hole Mass and Eddington Ratio
| J1205−0000 | J0859+0022 | J1152+0055 | J2239+0207 | J1208−0200 | J2216−0016 | |
|---|---|---|---|---|---|---|
| λL1350 (1045 erg s−1) | ⋯ | 1.63 ± 0.09 | 10.0 ± 0.1 | 6.45 ± 0.20 | ⋯ | ⋯ |
| λL3000 (1045 erg s−1) | 8.96 ± 0.66 | 1.03 ± 0.10 | 6.77 ± 0.11 | 4.44 ± 0.08 | 4.38 ± 0.04 | 2.66 ± 0.05 |
| MBH(C iv) (108 M⊙) | ⋯ |

|

|

|
⋯ | ⋯ |
| MBH(C iv, cor) (108 M⊙) | ⋯ |

|

|

|
⋯ | ⋯ |
| MBH(Mg ii) (108 M⊙) |

|

|

|

|

|

|
| Lbol/LEdd |

|

|

|

|

|

|
Note. The black hole mass errors quoted in this table are measurement errors, while there is an additional systematic uncertainty of 0.5 dex in the single-epoch mass measurement (Shen 2013). The Eddington ratio is based on the Mg ii–based MBH (Vestergaard & Osmer 2009). Two C iv–based MBH measurements are quoted: MBH(C iv) is the virial mass based on Vestergaard & Peterson (2006, Equation (5)), while MBH(C iv, cor) is the virial mass based on Coatman et al. (2017), which takes into account the C iv blueshift with respect to the systemic redshift.
Download table as: ASCIITypeset image
This large range in the SMBH properties of z ≳ 6 quasars has been seen in other recent papers. All known luminous quasars at z > 7.0 have accretion rates around the Eddington limit (i.e., Lbol/LEdd ∼ 1; Mortlock et al. 2011; Bañados et al. 2018; Wang et al. 2018). Lower-luminosity quasars in W10 show similarly high SMBH activity. On the other hand, Mazzucchelli et al. (2017) and Shen et al. (2019) found that a significant fraction of luminous z ≳ 6 quasars host sub-Eddington SMBHs (i.e., Lbol/LEdd ∼ 0.1), and the entire Eddington ratio distribution is not significantly different from that of the lower-redshift quasars at the same luminosity range. The SMBH activity of the HSC quasars agrees somewhat with the conclusion of Mazzucchelli et al. (2017) and Shen et al. (2019), albeit with our small sample size. Note that Kim et al. (2018) identified another sub-Eddington SMBH at z = 5.9 based on a C iv–based mass measurement.
While W10 used the same scaling relation that we used (Vestergaard & Osmer 2009) with a slightly larger bolometric correction factor of 6.0, most of the CFHQS quasars at Lbol < 1047 erg s−1 are still around or above the Eddington limit in Figure 7. Figure 8 shows the histogram of the Eddington ratio for the HSC quasars (including J1243+0100) and the CFHQS quasars from W10. Shen et al. (2019) argued that the apparent difference between the Eddington ratio distribution of their objects and W10 is partly due to the different Mg ii recipe used for the mass estimate and different bolometric correction. However, most of the CFHQS quasars still have luminosities near or over the Eddington limit, even when we recalculate their Mg ii–based MBH using the same calibration as the HSC quasars. This result may suggest that the global Eddington ratio distribution is much broader than measured for the CFHQS and HSC quasars, taking into account the small sample sizes (<10) in both studies. To explore this in detail will require a sample of low-luminosity quasars comparable in size to the high-luminosity sample.

Figure 8. Histogram of the Eddington ratio for z > 5.8 quasars based on the Mg ii–based scaling relation of Vestergaard & Osmer (2009, Equation (4)). The bin step is 0.5 dex, which is the same as the systematic uncertainty (Shen 2013). The HSC and CFHQS quasars at Lbol < 1047 erg s−1 are shown in red and green, respectively. The shaded histogram shows all of the z > 5.8 quasars whose Mg ii lines have been measured.
Download figure:
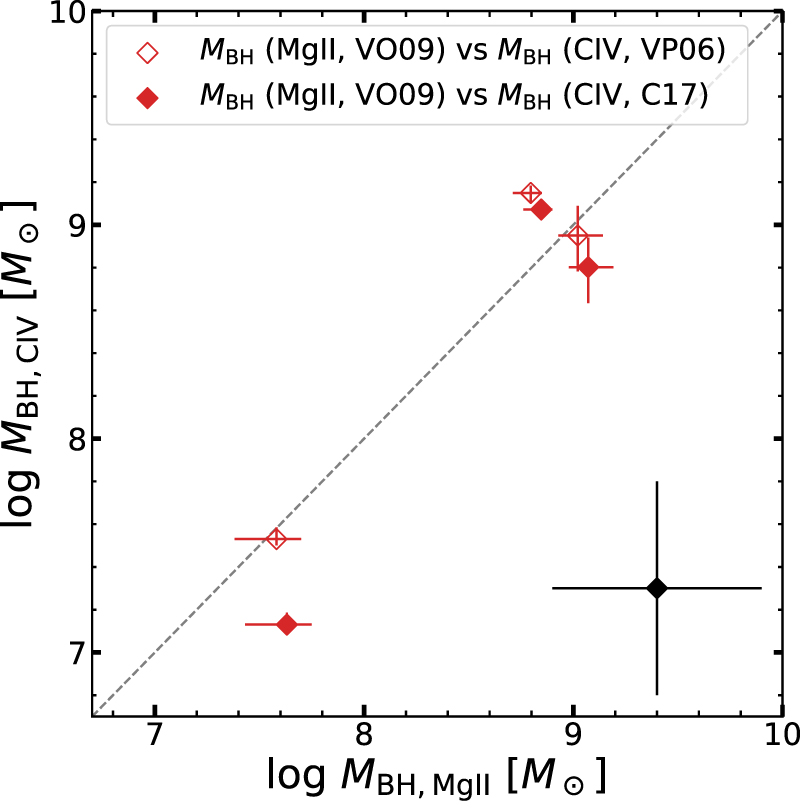
Standard image High-resolution imageWe investigate how the derived virial mass depends on the choice of mass scaling relations and mass estimators. We measure the Mg ii–based SMBH mass for the six HSC quasars in this work with the calibration of Shen et al. (2011). The Mg ii recipe of Shen et al. (2011) gives systematically higher BH masses at the luminous end than Vestergaard & Osmer (2009), which we used in this work. For example, the most luminous z ∼ 6 quasar known, SDSS J1030+0100 (Wu et al. 2015), shifts to higher mass by a factor of 2 (0.3 dex), which accordingly reduces the Eddington ratio by the same factor. However, its effect is tiny (<0.15 dex) at the luminosity range of the HSC quasars (Lbol ≲ 1047 erg s−1) when compared to the 0.5 dex systematic uncertainty of the virial mass measurements. We also measure the C iv–based BH mass for three HSC quasars (J0859+0022, J1152+0055, and J2239+0207), the C iv emission lines of which are not severely affected by self-absorption at the line centers. The results are also reported in Table 4. Figure 9 compares the single-epoch mass measurements based on Mg ii and C iv. The C iv–based BH masses of the three quasars are in agreement with the Mg ii–based mass within 1σ when the measurement and systematic uncertainties are taken into account (Shen 2013). Therefore, the observed SMBH activity of the three HSC quasars is robust to the choice of the mass estimator.

Figure 9. Comparison of the Mg ii– and C iv–based BH masses for the HSC quasars whose masses have been measured with both emission lines (J0859+0022, J1152+0055, and J2239+0207). The Mg ii–based mass shown in this figure is based on the calibration of Vestergaard & Osmer (2009). We show the C iv–based mass based on Vestergaard & Peterson (2006) with open symbols and Coatman et al. (2017) with filled symbols. The latter calibration takes into account the C iv blueshift with respect to the systemic redshift. The systematic uncertainties of the mass measurements (0.5 dex) are shown by the black point in the lower right corner.
Download figure:
Standard image High-resolution imageIn addition, we leverage an empirical correction of the C iv–based mass (Coatman et al. 2017) using C iv blueshifts with respect to systemic redshifts. This correction is calibrated with luminous quasars at 1.5 < z < 4.0, which typically show ≈1000–5000 km s−1 C iv blueshifts. The corrected C iv–based BH mass is also reported in Table 4 and Figure 9. This gives only a slightly better agreement with the Mg ii–based mass for J1152+0055, which has a blueshift of ![${\rm{\Delta }}{v}_{{\rm{C}}{\rm{IV}}-[{\rm{C}}{\rm{II}}]}={590}_{-190}^{+130}$](https://content.cld.iop.org/journals/0004-637X/880/2/77/revision1/apjab29e9ieqn92.gif) km s−1. On the other hand, the deviation from the Mg ii–based mass gets bigger for J0859+0022 (0.39 dex) while still in the 1σ systematic uncertainty. This is likely because the calibration is not sensitive to the small C iv velocity offset of J0859+0022 (60 km s−1 redshift); most quasars in Coatman et al. (2017) have ≳1000 km s−1 C iv blueshifts. It may also be possible that the observed C iv line of J0859+0022 is affected by the BAL absorption in the blue wing (Figure 3), which makes the line width narrower than the intrinsic shape and causes us to underestimate the BH mass.
km s−1. On the other hand, the deviation from the Mg ii–based mass gets bigger for J0859+0022 (0.39 dex) while still in the 1σ systematic uncertainty. This is likely because the calibration is not sensitive to the small C iv velocity offset of J0859+0022 (60 km s−1 redshift); most quasars in Coatman et al. (2017) have ≳1000 km s−1 C iv blueshifts. It may also be possible that the observed C iv line of J0859+0022 is affected by the BAL absorption in the blue wing (Figure 3), which makes the line width narrower than the intrinsic shape and causes us to underestimate the BH mass.
5. Implications on the Early SMBH Growth
The growth of an SMBH is exponential if it keeps a constant Eddington ratio. The timescale for a seed BH (Mseed) to reach a given MBH is

where τ is the e-folding timescale of

The radiation efficiency η is the factor of how efficiently the accreting mass is converted to radiation. Figure 10 shows the estimated growth history of the HSC quasars. We trace back to z = 30 (108 yr after the Big Bang), when the first stars and galaxies were thought to have formed in the universe (Bromm & Larson 2004; Bromm & Yoshida 2011). The radiation efficiency is assumed to be η = 0.1 (i.e., a standard thin accretion disk; Shakura & Sunyaev 1976). Two scenarios are considered here: the first assumes the Eddington ratios we derived from our observations (Section 4), and the second assumes the Eddington limit Lbol/LEdd = 1. For comparison, we also show in Figure 10 the growth paths of J1342+0928 at z = 7.54 (Bañados et al. 2018), the highest-redshift quasar known to date, and J0100+2802 at z = 6.33 (Wu et al. 2015), the most luminous z > 6 quasar to date.

Figure 10. Estimated growth history of the z ≥ 6.1 HSC quasars. The x-axis is given in both redshift (bottom) and time since the Big Bang (top). Solid lines show the case where SMBHs grow at the observed Eddington ratio at all times, while dashed lines show the case where SMBHs grow at the Eddington limit Lbol/LEdd = 1. The six HSC quasars in this work are shown in red, while HSC J1243+0100 is shown in magenta. The observed masses are shown as filled diamonds. For comparison, two luminous z > 6 quasars are also shown in blue: J1342+0928 at z = 7.54 from Bañados et al. (2018) and J0100+2802 at z = 6.33 from Wu et al. (2015). The shaded regions correspond to the mass ranges of Pop III remnant BHs (Mseed ≲ 103 M⊙; green) and direct collapse BHs (Mseed ∼ 105–6 M⊙; orange).
Download figure:
Standard image High-resolution image
Among the seven HSC quasars, J0859+0022 reaches the mass range of the Pop III remnants at z ≳ 10 in both scenarios above (Mseed ≲ 103 M⊙; Hirano et al. 2014) due to its relatively low mass and high Eddington ratio. This is different from the cases of J1342+0928 and J0100+2802, where the seed BHs need to form earlier or be more massive when they form. On the contrary, the initial growth of the other HSC quasars with sub-Eddington ratios requires Mseed ≳ 106 M⊙ seed BHs, if we assume the current growth speeds. This is even more massive than what the direct collapse model predicts (Mseed ∼ 105–6 M⊙; Latif & Ferrara 2016). There is currently no plausible formation model for such an extremely heavy seed BH. Note that there is a large systematic uncertainty of the Eddington ratio for each object (Figure 7); however, our conclusion that the bulk of the HSC quasars indeed host sub-Eddington SMBHs is robust, and thus this challenge to seed BH formation models remains.
Figure 10 also suggests that their seed masses fall into the range of the Pop III remnants if we assume Eddington-limit accretion. Those SMBHs are likely to be in a quiescent phase; the mass accretion must have been longer at earlier epochs but switched to a less active mode by the time we observed them. It is still possible that those sub-Eddington SMBHs will switch to a more active mode again if they accrete a large amount of cold gas through major mergers. However, our ALMA observations of the HSC quasars in this paper (all but J1205−0000 and J1243+0100) have revealed that they do not have [C ii]-bright companion galaxies (Izumi et al. 2018, 2019), as some luminous quasars do (Decarli et al. 2017). Therefore, it is likely that the sub-Eddington SMBHs in this work will not grow much more rapidly, at least over the next 100 Myr (i.e., typical quasar lifetime; Soltan 1982). Such quiescent SMBHs have been found at z ≲ 5 at similar luminosity (Trakhtenbrot et al. 2016; Ikeda et al. 2017). We stress that the importance of the HSC quasars in this study is in showing the quenching of efficient SMBH growth at an earlier epoch than those studies. We may be witnessing the first "downsizing" of the most massive SMBHs in the context of the antihierarchical SMBH evolution (e.g., Ueda et al. 2003, 2014).
The relatively low SMBH activity of the HSC quasars implies that the mass accretion at a constant Eddington ratio (as assumed in Equation (9)) can no longer explain the SMBH growth at z ≳ 6, and that one should consider the time evolution of Eddington ratios from seed BHs. It is relatively easy for heavy seed BHs (Mseed ∼ 105–6 M⊙) to reach 109 M⊙ in the early universe if part of their accretion is at the Eddington limit. However, the formation of such a seed needs critical conditions that would not be met for all SMBHs in the universe (e.g., Chon et al. 2016; Latif & Ferrara 2016; Hirano et al. 2017). Moreover, Shirakata et al. (2016) showed that the local bulge-to-BH mass ratio cannot be reproduced in their semi-analytical model if the seed BHs are all Mseed = 105 M⊙.
In this context, another plausible scenario would be that early SMBHs experience episodic super-Eddington growth. Collin & Kawaguchi (2004) argue that SMBH growth is not capped at the Eddington limit but is regulated by the supply of infalling mass (i.e., the maximum accretion rate is irrespective of the SMBH mass). Theoretical studies suggest that super-Eddington accretion can be preferentially achieved in metal-poor environments (Z < 10−2Z⊙), where the nuclear feedback is less efficient in regulating mass accretion than in the current universe (Inayoshi et al. 2016; Toyouchi et al. 2019). There have been no clear examples of such a super-Eddington SMBH at z ≳ 6 to date; however, the discovery of a mildly obscured quasar at z = 6.699 (J1205−0000; Section 3.3.1) may support this scenario because the mass accretion onto SMBHs would be most efficient during the dusty phase after the starburst of their hosts (Hopkins et al. 2008; Kim et al. 2015). Perhaps J1205−0000 is in the transitional phase from a dusty quasar to a type I quasar just after experiencing intense mass growth associated with dusty major mergers of its host galaxy (Decarli et al. 2017). Observational evidence of high-redshift super-Eddington SMBHs (Lbol/LEdd ≫ 1), perhaps hosted by dusty starburst galaxies, is required to test the episodic SMBH growth scenario.
Finally, the variety seen in the SMBH properties of z > 5.8 quasars requires us to revisit the redshift evolution of the black hole mass function (BHMF). By interpreting the CFHQS quasar luminosity function of Willott et al. (2010b) in the context of their MBH measurements, W10 showed the first constraint on the z ∼ 6 BHMF. On the other hand, Matsuoka et al. (2018c) showed the z ∼ 6 luminosity function with a compilation of 110 quasars spanning a wide luminosity range, showing a flatter power-law slope α at the faint end than Willott et al. (2010b; α = −1.23, where W10 quoted α = −1.5). Taken together with the wider Eddington ratio distribution that we showed in Figure 8, the studies of HSC quasars suggest that the slope of the z ∼ 6 BHMF is flatter than that of W10. The flat low-mass end slope is in line with the scenario in which the seed BHs can easily grow to large masses through a "fast track" from seed BHs. Given that we have MBH measurements of only seven HSC quasars, it is necessary to construct a larger mass sample to better understand the early SMBH growth with better statistics. In addition, our current NIR observations are limited by the sensitivity of the ground-based 8 m telescopes. Future facilities such as the James Webb Space Telescope (Gardner et al. 2006) and next-generation large ground-based telescopes will reveal the SMBH properties of even lower mass or less active SMBHs.
6. Summary
This paper is the sixth paper of the SHELLQs project, a large optical survey of low-luminosity quasars in the reionization epoch (z > 5.7) with the HSC-SSP. We have presented NIR (and some optical) observations of six quasars at 6.1 ≤ z ≤ 6.7 selected from the first two discovery papers (Matsuoka et al. 2016, 2018b). Their absolute continuum magnitudes (M1450) are among the faintest of z > 5.8 quasars whose central BH masses have been measured.
We observed three quasars each with VLT/X-Shooter and Gemini-N/GNIRS to measure their SMBH mass and accretion rate with the single-epoch method. The broad emission lines of Mg ii λ2798 and C iv λ1549 were detected in all targets, as were underlying continuum and other emission lines such as C iii] λ1909 and Si iv λ1397 in some cases. The NIR spectra are fitted with a power-law continuum, iron emission line templates, and Gaussian profiles for emission lines. The velocity shifts of C iv emission lines (≲400–600 km s−1) are broadly in agreement with luminous z ∼ 6 quasars. No large Mg ii blueshifts (≳1000 km s−1) are observed for the five quasars that have atomic [C ii] 158 μm redshifts. We find that one quasar, J1205−0000 at zMg ii =  , is a modestly obscured quasar associated with (at least) two strong BAL troughs in the blue wings of C iv and N v λ1240. Another quasar, J0859+0022 at z[C ii] = 6.3903, has remarkably strong and narrow emission lines (FWHM = 1200–1400 km s−1), which we classify as a high-redshift analog of an NLS1 galaxy rather than a type II quasar from the fact that it has a blue continuum and iron emission line forest.
The Mg ii–based single-epoch mass measurements of the six HSC quasars reveal a variety of SMBH properties, from rapidly growing SMBHs to modestly accreting massive SMBHs, with masses of 3.8 × 10⁷ M⊙ ≤ MBH ≤ 2.2 × 10⁹ M⊙ and Eddington ratios of 0.16 ≤ Lbol/LEdd ≤ 1.1. It is remarkable that the majority hosts MBH ∼ 109 M⊙ SMBHs with sub-Eddington accretion. The observed Eddington ratio distribution of the HSC quasars shifts to lower accretion rates than the CFHQS quasars in W10 at similar luminosity (Lbol < 1047 erg s−1). Although the current sample size is small, the properties of low-luminosity quasars are in line with recent studies of more luminous quasars at z > 5.8 (Mazzucchelli et al. 2017; Shen et al. 2019). As constant sub-Eddington accretion cannot make an MBH ∼ 109 M⊙ SMBH by z ∼ 6 from stellar seed BHs, those sub-Eddington SMBHs are likely in a quiescent phase after intense mass growth, perhaps through intermittent super-Eddington phases.
We will continue to address the global distribution of BH mass and Eddington ratio at z ∼ 6–7 at low luminosities as our sample continues to grow. We are continuing the NIR follow-up observation of the SHELLQs quasars with Subaru/MOIRCS as the HSC-SSP survey proceeds and new quasars are identified. The BH mass measurements are combined with our host galaxy measurements with ALMA, in which we explore a less biased view of the buildup of the SMBH–galaxy coevolution (Izumi et al. 2018, 2019).
We thank the Gemini-North and VLT staffs for executing our programs. We thank the anonymous referees for constructive comments on the draft. We are grateful to Y. Shen and K. Inayoshi for useful discussions on this work and M. Vestergaard for kindly providing us the iron emission line templates.
This work is based on data collected at the Subaru Telescope and retrieved from the HSC data archive system, which is operated by the Subaru Telescope and Astronomy Data Center at the National Astronomical Observatory of Japan.
The Hyper Suprime-Cam (HSC) collaboration includes the astronomical communities of Japan and Taiwan and Princeton University. The HSC instrumentation and software were developed by the National Astronomical Observatory of Japan (NAOJ), the Kavli Institute for the Physics and Mathematics of the Universe (Kavli IPMU), the University of Tokyo, the High Energy Accelerator Research Organization (KEK), the Academia Sinica Institute for Astronomy and Astrophysics in Taiwan (ASIAA), and Princeton University. Funding was contributed by the FIRST program from the Japanese Cabinet Office; the Ministry of Education, Culture, Sports, Science and Technology (MEXT); the Japan Society for the Promotion of Science (JSPS); the Japan Science and Technology Agency (JST); the Toray Science Foundation; and NAOJ, Kavli IPMU, KEK, ASIAA, and Princeton University.
The Pan-STARRS1 surveys (PS1) have been made possible through contributions of the Institute for Astronomy, the University of Hawaii, the Pan-STARRS Project Office, the Max Planck Society and its participating institutes, the Max Planck Institute for Astronomy, Heidelberg, and the Max Planck Institute for Extraterrestrial Physics, Garching, Johns Hopkins University, Durham University, the University of Edinburgh, Queen's University Belfast, the Harvard-Smithsonian Center for Astrophysics, the Las Cumbres Observatory Global Telescope Network Incorporated, the National Central University of Taiwan, the Space Telescope Science Institute, and the National Aeronautics and Space Administration under grant No. NNX08AR22G issued through the Planetary Science Division of the NASA Science Mission Directorate; the National Science Foundation under grant No. AST-1238877; the University of Maryland; and Eotvos Lorand University (ELTE).
This paper makes use of software developed for the Large Synoptic Survey Telescope. We thank the LSST Project for making their code available as free software at http://dm.lsst.org.
This publication has made use of data from the VIKING survey from VISTA at the ESO Paranal Observatory, program ID 179.A-2004. Data processing has been contributed by the VISTA Data Flow System at CASU, Cambridge and WFAU, Edinburgh.
This work was supported by JSPS KAKENHI grant Nos. JP15J02115 (M.O.), JP15H03645 (N.K.), JP17H04830 (Y.M.), JP15K05030 (M.I.), JP16H03958, JP17H01114 (T.N.), and JP18J01050 (Y.T.) and Mitsubishi Foundation grant No. 30140 (Y.M.).
Facilities: Subaru(HSC) - Subaru Telescope, VLT(X-Shooter) - , Gemini(GNIRS). -
Software: astropy (Astropy Collaboration et al. 2013), SExtractor (Bertin & Arnouts 1996).
Footnotes
- 15
- 16
We see a nonsmooth continuum at λobs ≳ 2.3 μm in the VLT/X-Shooter spectra. This region may be affected by thermal noise in the instrument.
- 17
- 18
ESO Catalogue Facility: https://www.eso.org/qi/.
- 19
Data release 2013 November 13.
- 20
Shen et al. (2019) measured Mg ii–based masses for three CFHQS quasars: J0050+3445 (z = 6.25), J0055+0146 (z = 5.95), and J0221–0802 (z = 6.20).