


Abstract
We present Atacama Large Millimeter/submillimeter Array (0.87 mm) and Very Large Array (9 mm) observations toward OMC-2 FIR4 and OMC-2 FIR3 within the Orion integral-shaped filament, thought to be two of the nearest regions of intermediate-mass star formation. We characterize the continuum sources within these regions on ∼40 au (0 1) scales and associated molecular line emission at a factor of ∼30 better resolution than previous observations at similar wavelengths. We identify six compact continuum sources within OMC-2 FIR4, four in OMC-2 FIR3, and one additional source just outside OMC-2 FIR4. This continuum emission is tracing the inner envelope and/or disk emission on less than 100 au scales. HOPS-108 is the only protostar in OMC-2 FIR4 that exhibits emission from high-excitation transitions of complex organic molecules (e.g., methanol and other lines) coincident with the continuum emission. HOPS-370 in OMC-2 FIR3, with L ∼ 360 L⊙, also exhibits emission from high-excitation methanol and other lines. The methanol emission toward these two protostars is indicative of temperatures high enough to thermally evaporate it from icy dust grains; overall, these protostars have characteristics similar to hot corinos. We do not identify a clear outflow from HOPS-108 in 12CO, but we find evidence of interaction between the outflow/jet from HOPS-370 and the OMC-2 FIR4 region. A multitude of observational constraints indicate that HOPS-108 is likely a low- to intermediate-mass protostar in its main mass accretion phase and is the most luminous protostar in OMC-2 FIR4. The high-resolution data presented here are essential for disentangling the embedded protostars from their surrounding dusty environments and characterizing them.
Export citation and abstract BibTeX RIS
1. Introduction
The formation of intermediate- to high-mass protostars has yet to be fully characterized observationally (e.g., Tan et al. 2014). The uncertainty is, in part, because intermediate- and high-mass stars are significantly more rare than low-mass stars. Furthermore, many examples of intermediate- to high-mass protostars are at distances greater than 1 kpc (Cyganowski et al. 2017; Motte et al. 2018), and they are typically more deeply embedded than low-mass protostars, making their characterization challenging (e.g., Orion BN-KL; Gezari et al. 1998; De Buizer et al. 2012; Ginsburg et al. 2018). This typically large distance makes the identification and characterization of intermediate-mass protostars difficult, especially because multiplicity increases with stellar mass (e.g., van Kempen et al. 2012; Duchêne & Kraus 2013; Moe & Di Stefano 2017). For the sake of discussion in this paper, we refer to stars with M* < 2 M⊙ as low-mass, stars with 2 M⊙ ≤ M* < 8 M⊙ as intermediate-mass, and stars with M* > 8 M⊙ as high-mass. And with respect to the protostellar phase, a protostar that is expected to ultimately form a low-, intermediate-, or high-mass star is referred to as a low-, intermediate-, or high-mass protostar.
The integral-shaped filament (ISF) within the Orion A molecular cloud at a distance of ∼400 pc (Kounkel et al. 2017) harbors several attractive intermediate-mass protostar candidates. The ISF comprises Orion molecular clouds OMC-1, OMC-2, and OMC-3, where OMC-1 begins south of the Orion Nebula Cluster (ONC) and OMC-2 and OMC-3 are located north of the ONC; just north of OMC-3 is NGC 1977 (Peterson et al. 2008). In particular, the regions identified by Mezger et al. (1990) as OMC-2 FIR3 and FIR4 are often looked to as candidate intermediate- to high-mass protostars and/or protoclusters (Shimajiri et al. 2008; Ceccarelli et al. 2014; Fontani et al. 2015). The total gas masses of OMC-2 FIR4 and OMC-2 FIR3 have been estimated to be ∼33 and ∼17 M⊙, respectively, from their 850 μm continuum emission maps (Nutter & Ward-Thompson 2007).
The protostars within these regions, however, are expected to be of lower mass than the known high-mass protostars in the BN-KL region, of which source I was recently measured to have a protostar mass of ∼15 M⊙ from its disk rotation (Ginsburg et al. 2018). It has been difficult, however, to accurately measure the multiwavelength emission from individual protostars in the OMC-2 and OMC-3 regions due to the high protostellar density, especially at wavelengths longer than 24 μm, where most of the luminosity of a protostar is emitted (Dunham et al. 2008; Furlan et al. 2016).
The ISF of Orion has been the target of photometric studies with the Herschel Space Observatory as part of the Herschel Orion Protostar Survey (HOPS; Furlan et al. 2016). Within this survey, the protostars associated with OMC-2 FIR3 and FIR4 were resolved in the mid- to far-infrared by Furlan et al. (2014) and Adams et al. (2012) from 3.6 to 100 μm. They found that HOPS-370, associated with FIR3, has a high bolometric luminosity (Lbol ∼ 360 L⊙) indicative of at least an intermediate-mass protostar. However, the nature of FIR4 was less clear, having previously been suggested to be a high-mass protostar, which is in conflict with the observed luminosity of the most closely associated protostar, HOPS-108. The luminosity of HOPS-108 in the mid- to far-infrared (Lbol ∼ 37 L⊙) is lower than HOPS-370 at wavelengths <100 μm. This indicates that the HOPS-108 protostar could be less massive (or accreting less rapidly) than HOPS-370, despite residing within the more massive FIR4 core. Lbol can both over- and underestimate the total internal luminosity of a protostellar system, however, due to inclination, obscuration, and some light escaping through the outflow cavities (Whitney et al. 2003). Furthermore, at wavelengths between 160 microns and 0.87 mm, the emission from HOPS-108 could not be separated from that of the FIR4 core, the peak of which is displaced ∼45 (1800 au) from HOPS-108. Furlan et al. (2014) fit a modified blackbody to the emission from the FIR4 core between 160 μm and 0.87 mm and found a temperature of 22 K and luminosity of 137 L⊙; a substantial fraction of this luminosity may come from external heating.
Furlan et al. (2014) analyzed the spectral energy distribution (SED) of HOPS-108 using radiative transfer models, finding that the protostar could have an internal luminosity as low as 37 L⊙ or as high as 100 L⊙. This estimate is inconsistent with earlier luminosity claims of 700–1000 L⊙ by López-Sepulcre et al. (2013), which was in part motivated by low-resolution (∼6'') centimeter flux densities observed from the Very Large Array (VLA; Reipurth et al. 1999) that were interpreted as an ultracompact H ii region and far-infrared flux densities from the Infrared Astronomy Satellite (IRAS). Osorio et al. (2017) spatially resolved the radio emission of FIR3 and FIR4. With higher-resolution VLA data (∼04) at 5 cm, they found a jet-like feature with knots that have moved away from FIR3 and toward FIR4 when compared with archival data taken ∼15 yr prior. This radio jet corresponds well with the jet mapped by González-García et al. (2016) in [O i] with Herschel, where the strongest [O i] emission was seen to originate near HOPS-108 and at the end of the radio jet, possibly in a terminal shock. The lower luminosity of HOPS-108 from Furlan et al. (2014) and the fact that the centimeter emission reflects a jet driven by FIR3 rather than an ultracompact H ii region make HOPS-108 inconsistent with being a high-mass protostar. The low resolution of Herschel and uncertainty in the absolute positions relative to the much higher-resolution VLA data, however, leave some ambiguity as to the nature of HOPS-108 and the association of the [O i] shock. We show an overview of the region in Figure 1, with the previously known protostar positions (Megeath et al. 2012; Furlan et al. 2014, 2016) and the locations of the compact radio continuum emission, likely tracing protostars, from Osorio et al. (2017) overlaid.
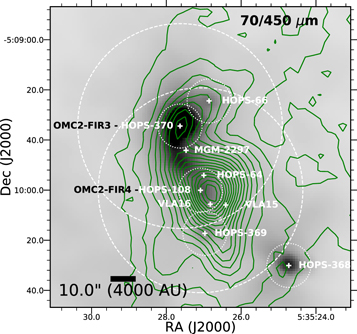
Figure 1. Overview of the OMC-2 FIR3/4 region. The grayscale image is the Herschel 70 μm image, and the green contours are the SCUBA 450 μm emission (Johnstone & Bally 1999). The large dashed circles mark the half-power point of the VLA primary beam at 9 mm, and the smaller dotted circles mark the half-power point of the ALMA primary beam at 0.87 mm. The 450 μm contours start at 15σ and increase on 10σ intervals, where σ = 0.2 Jy beam−1. The positions shown are from Furlan et al. (2014, 2016) and Osorio et al. (2017).
Download figure:
Standard image High-resolution imageIn addition to the photometric, radio, and [O i] studies, FIR4 presents a diverse array of line emission from molecules that may be indicative of chemical processes driven by a source of locally generated energetic particles (i.e., cosmic rays) or photons that are catalysts for chemistry (Ceccarelli et al. 2014; Gaches & Offner 2018). Most studies of this region, however, have been conducted at resolutions ≥3'', which are insufficient to resolve the protostars completely from their environment (Favre et al. 2018). The VLA 5 cm observations from Osorio et al. (2017) do resolve many protostars, but the presence of the radio jet makes positive identification of all sources difficult.
Building on these previous studies, we have conducted Karl G. Jansky VLA and Atacama Large Millimeter/submillimeter Array (ALMA) observations at 9 and 0.87 mm, respectively, both with <01 resolution, detecting and resolving the dust emission from the protostars within the FIR3 and FIR4 regions. Furthermore, the molecular line emission contained within our ALMA bandpass enables us to further characterize the physical conditions of HOPS-108 and HOPS-370 and the associated protostars in the region. This paper is structured as follows: the observations are presented in Section 2, our results are presented in Section 3, we discuss our results in Section 4, and we present our conclusions in Section 5.
2. Observations and Data Reduction
The ALMA and VLA observations presented here are part of the VLA/ALMA Nascent Disk and Multiplicity (VANDAM) Survey of the Orion molecular clouds. Observations were conducted toward 328 protostars (148 for the VLA) in the Orion molecular clouds, all at ∼01 resolution. The sample of 328 protostars is derived from the HOPS sample (Furlan et al. 2016), observing the bona fide protostars from Class 0 to flat spectrum. The full survey results will be presented in an upcoming paper (J. J. Tobin et al. 2019, in preparation).
2.1. ALMA Observations
The ALMA observations of the HOPS-108/OMC-2 FIR4 and HOPS-66 regions were conducted during three executions on 2016 September 4 and 5 and 2017 July 19. The observations of HOPS-370/OMC-2 FIR3, HOPS-368, and HOPS-369 were conducted during three executions, with two executions on 2016 September 6 and the third on 2017 July 19. Between 34 and 42 antennas were operating during a given execution, and the on-source time per field was 0.3 minutes during each execution, totaling ∼0.9 minutes per field. During the 2016 observations, the baselines ranged from ∼16 to 2483 m, and the 2017 observations sampled baselines from ∼18 to 3697 m. The largest angular scale recoverable by the observations is expected to be ∼15. The precipitable water vapor was 0.43 and 0.42 mm during the 2016 September 6 and 2017 July 19 observations, respectively, of HOPS-370/OMC-2 FIR3, HOPS-368, and HOPS-369. Then, for the 2016 September 4 and 5 and 2017 July 19 observations of HOPS-108/OMC-2 FIR4 and HOPS-66 the precipitable water vapor was 0.73, 0.53, and 0.47 mm, respectively. The ALMA observations are summarized in Table 1, and the phase centers, along with the half-power points of the primary beam at 0.87 mm, are shown in Figure 1.
Table 1. ALMA and VLA Observation Summary
| Fields | R.A. | Decl. | Date(s) | Max. Baseline | Antennas | PWVa |
|---|---|---|---|---|---|---|
| (J2000) | (J2000) | (m) | (mm) | |||
| ALMA 0.87 mm | ||||||
| (Band 7) | ||||||
| HOPS-66 | 05:35:26.843 | −05:09:24.58 | 2016 Sep 4, 5; 2017 Jul 19 | 2483, 2483, 3697 | 41, 41, 41 | 0.73, 0.53, 0.47 |
| HOPS-370 | 05:35:27.629 | −05:09:33.47 | 2016 Sep 6a; 2017 Jul 19 | 2483, 2483, 3697 | 41, 41, 41 | 0.73, 0.53, 0.47 |
| HOPS-108 | 05:35:27.073 | −05:10:00.37 | 2016 Sep 4, 5; 2017 Jul 19 | 2483, 2483, 3697 | 39, 34, 42 | 0.42, 0.42, 0.42 |
| HOPS-369 | 05:35:26.972 | −05:10:17.14 | 2016 Sep 6a; 2017 Jul 19 | 2483, 2483, 3697 | 39, 34, 42 | 0.42, 0.42, 0.42 |
| HOPS-368 | 05:35:24.725 | −05:10:30.21 | 2016 Sep 6a; 2017 Jul 19 | 2483, 2483, 3697 | 39, 34, 42 | 0.42, 0.42, 0.42 |
| VLA 9.1 mm | ||||||
| (Ka-band) | ||||||
| HOPS-370 | 05:35:27.629 | −05:09:33.47 | 2016 Oct 26 | 36,400 (A config) | 26 | 8 |
| HOPS-108 | 05:35:27.073 | −05:10:00.37 | 2016 Dec 29 | 36,400 (A config) | 26 | 4 |
Notes. The ALMA observations of HOPS-370, HOPS-368, and HOPS-369 were observed as part of one ALMA scheduling block, while HOPS-66 and HOPS-108 were also observed together in another ALMA scheduling block. The coordinates listed refer to the phase center of the observations.
aTwo executions were carried out on 2016 September 6.Download table as: ASCIITypeset image
The correlator was configured with two basebands set to low spectral resolution continuum mode covering a 1.875 GHz bandwidth each, with 31.25 MHz (∼27 km s−1) channels. These continuum basebands were centered at 333 and 344 GHz. The two remaining basebands were centered on 12CO ( ) at 345.79599 GHz, having a total bandwidth of 937.5 MHz and 0.489 km s−1 channels, and 13CO (
 ) at 330.58797 GHz, with a bandwidth of 234.375 MHz and 0.128 km s−1 channels. The line-free regions of the basebands centered on 12CO and 13CO (
 ) were then used for additional continuum bandwidth. The total aggregate continuum bandwidth was ∼4.75 GHz.
The calibrators used in the 2017 observations were J0423–0120 (flux), J0510+1800 (bandpass), and J0541–0541 (complex gain). During the first execution on 2016 September 6 (HOPS-368, HOPS-369, HOPS-370), the calibrators were J0510+1800 (bandpass and flux) and J0541–0541 (complex gain), and during the second execution, the calibrators were J0522–3627 (flux), J0510+1800 (bandpass), and J0541–0541 (complex gain). The calibrators used in the observations of HOPS-66 and HOPS-108 on 2016 September 4 and 5 were J0510+1800 (bandpass and flux) and J0541–0541 (complex gain).
The data were reduced manually by the Dutch Allegro ALMA Regional Center Node. The manual reduction was necessary to better correct for variation of the quasar J0510+1800 that was used for absolute flux calibration in the observations on 2016 September 4–6. The flux calibration quasars are monitored regularly, but J0510+1800 had a flare and had not been monitored at Band 7 (0.87 mm) between 2016 August 21 and 2016 September 19; however, monitoring had been conducted at Band 3 (3 mm) three times during this period. To extrapolate the Band 7 flux density of J0510+1800, the spectral index of the quasar from Band 3 to Band 7 was used, and the time variability of the spectral index was estimated from the contemporaneous Band 3 and 7 observations on 2016 August 21 and 2016 September 19. The absolute flux calibration accuracy is expected to be ∼10%, and comparisons of the observed flux densities for the science targets in the different executions are consistent with this level of accuracy.
Following the standard calibration, three rounds of phase-only self-calibration were performed on continuum data to increase the signal-to-noise ratio (S/N). For each successive round, we used solution intervals that spanned the entire scan length (first round), 12.08 s (second round), and 3.02 s, which was the length of a single integration (third round). The self-calibration solutions were also applied to the 12CO and 13CO spectral line data. The continuum and spectral line data cubes were imaged using the clean task of the Common Astronomy Software Application (CASA). We used CASA 4.7.2 for all self-calibration and imaging.
The continuum images were produced using the clean task in CASA 4.7.2 using Briggs weighting with a robust parameter of 0.5, yielding a synthesized beam of 011 × 010 (83 au × 58 au) FWHM. The continuum image also only uses visibilities at baselines >25 kλ (21.75 m) to mitigate striping resulting from large-scale emission that is not properly recovered. The 12CO and 13CO spectral line data were imaged using natural weighting for baselines >50 kλ (43.5 m) to mitigate striping, and an outer taper of 500 kλ (435 m) was applied to increase the sensitivity to extended structure. The resulting synthesized beams were 025 × 024. Additional spectral lines were imaged with an outer taper of 2000 kλ (1740 m), resulting in a synthesized beam of 015 × 014. The inner uv-cuts applied to the data typically only removed one or two baselines from the imaging process. The primary beam of the ALMA 0.87 mm observations was ∼17'' in diameter, FWHM. However, we were able to detect sources beyond the FWHM and out to 114 from the field center. The resulting rms of the continuum, 12CO, and 13CO data are ∼0.31 mJy beam−1, ∼17.7 mJy beam−1 (1 km s−1 channels), and ∼33.3 mJy beam−1 (0.44 km s−1 channels), respectively.
2.2. VLA Observations
The observations with the VLA were conducted in the A configuration on 2016 October 26 (HOPS-370) and 2016 December 29 (HOPS-108). During the observations, 26 antennas were operating and the each observation lasted 2.5 hr. The observations used the Ka-band receivers, and the correlator was used in its wide bandwidth mode (3-bit samplers) with one 4 GHz baseband centered at 36.9 GHz (8.1 mm) and the second 4 GHz baseband centered at 29 GHz (1.05 cm). The absolute flux calibrator was 3C 48 (J0137+3309), the bandpass calibrator was 3C 84 (J0319+4130), and the complex gain calibrator was J0541–0541 in all observations. The observations were conducted in fast-switching mode (2.6-minute calibrator-source-calibrator cycle times) to reduce phase decoherence in the high-frequency observations, and the total time on source was ∼64 minutes. We note that the first observation was taken when the VLA was misapplying the tropospheric phase correction, leading to position offsets when sources were at low elevation and/or far from their calibrator. The HOPS-370 data were taken above elevations of 40° (the effect was worst below 35°), and the calibrator distance was only ∼1°, making the effects of this issue negligible in the HOPS-370 data set. The VLA observations are summarized in Table 1, and the phase centers and the half-power points of the primary beam at 9 mm are shown in Figure 1.
The data were reduced using the scripted version of the VLA pipeline in CASA 4.4.0. Phase-only self-calibration was conducted in two rounds with solution intervals of 230 s (first round) and 90 s (second round), which corresponded to one solution for every two scans and one solution for each scan, respectively. The continuum was imaged using the clean task in CASA 4.5.1 using natural weighting and multifrequency synthesis with nterms = 2 across both basebands. The final image has an rms noise of 6.9 μJy beam−1 and a synthesized beam of 008 × 007 (32 au × 28 au), FWHM. The primary beam of the VLA observations was ∼80'', FWHM; however, we were able to image a source 46'' from the field center.
3. Results
3.1. Protostellar Content
The observations of the 0.87 and 9 mm continuum with ALMA and the VLA, respectively, detect the compact dust emission originating from the protostars in the region with sufficiently high dust mass (and temperature). The VLA 9 mm continuum can also have a contribution from free–free emission. We detected the 10 known protostellar and compact radio continuum sources at both 0.87 and 9.1 mm at the 3σ level (or above), and we detect a new source at 0.87 and 9 mm, for a total of 11 sources detected. We fit Gaussians to these sources using the imfit task in CASA to measure their flux densities and positions. The detected sources have their properties listed in Table 2 for ALMA and Table 3 for the VLA. Due to the number of source catalogs already published toward the region at different angular resolutions and sensitivity, there are multiple identifiers available for many of the detected sources. In light of this, we attempt to use the most common identifier possible for the sources detected in the region. Only one source has not been previously cataloged at another wavelength, and we refer to this source as OMC-2 FIR4 ALMA1 (hereafter ALMA1).
Table 2. ALMA 870 μm Source Properties
| Source | R.A. | Decl. | ALMA Field | Δϕ | Fν | Peak Iν | RMS | Decon. Size | Decon. PA |
|---|---|---|---|---|---|---|---|---|---|
| (J2000) | (J2000) | (arcsec) | (mJy) | (mJy bm−1) | (mJy bm−1) | (arcsec) | (deg) | ||
| HOPS-66-B | 05:35:26.927 | −05:09:22.43 | HOPS-66 | 2.5 | 34.62 ± 1.10 | 12.56 | 0.28 (0.28) | 0.17 × 0.12 | 165.8 |
| HOPS-66-A | 05:35:26.857 | −05:09:24.40 | HOPS-66 | 0.3 | 43.31 ± 0.57 | 35.97 | 0.28 (0.28) | 0.05 × 0.04 | 47.0 |
| HOPS-370 | 05:35:27.634 | −05:09:34.42 | HOPS-370 | 1.0 | 533.28 ± 10.05 | 109.89 | 0.39 (0.39) | 0.34 × 0.11 | 109.7 |
| MGM-2297 | 05:35:27.47 | −05:09:44.16 | HOPS-370 | 10.9 | 9.07 ± 1.79 | 6.37 | 1.04 (0.36) | Unresolved | ⋯ |
| HOPS-64 | 05:35:26.998 | −05:09:54.08 | HOPS-108 | 6.4 | 33.47 ± 0.76 | 20.37 | 0.42 (0.28) | 0.10 × 0.07 | 119.3 |
| HOPS-108 | 05:35:27.086 | −05:10:00.06 | HOPS-108 | 0.4 | 62.63 ± 0.98 | 27.67 | 0.31 (0.31) | 0.12 × 0.12 | 105.7 |
| VLA15 | 05:35:26.41 | −05:10:05.94 | HOPS-108 | 11.4 | 122.94 ± 1.65 | 20.48 | 0.84 (0.26) | 0.41 × 0.11 | 87.3 |
| VLA16 | 05:35:26.824 | −05:10:05.62 | HOPS-108 | 6.4 | 6.66 ± 0.81 | 4.24 | 0.37 (0.24) | 0.10 × 0.08 | 164.8 |
| OMC-2 FIR4 ALMA1 | 05:35:26.785 | −05:10:08.83 | HOPS-369 | 8.8 | 5.57 ± 0.73 | 3.30 | 0.59 (0.27) | 0.14 × 0.04 | 110.5 |
| HOPS-369 | 05:35:26.969 | −05:10:17.27 | HOPS-369 | 0.1 | 26.11 ± 0.53 | 22.40 | 0.27 (0.27) | 0.05 × 0.04 | 21.3 |
| HOPS-368 | 05:35:24.725 | −05:10:30.08 | HOPS-368 | 0.1 | 135.91 ± 2.62 | 60.96 | 0.25 (0.25) | 0.19 × 0.08 | 105.2 |
Note. Observed properties of the sources observed by ALMA at 0.87 mm. The "ALMA Field" column corresponds to the main target observed in a particular field and the "Δϕ" column is the angular separation in arcseconds from the phase center of the field. The source names VLA16 and VLA15 refer to sources identified in Osorio et al. (2017), and MGM refers to Megeath et al. (2012). The integrated flux densities and peak intensities are primary beam corrected; the rms noise uncorrected for the primary beam is given in parentheses.
Download table as: ASCIITypeset image
Table 3. VLA 9 mm Source Properties
| Source | R.A. | Decl. | VLA Field | Δϕ | Fν | Peak Iν | RMS | Decon. Size | Decon. PA |
|---|---|---|---|---|---|---|---|---|---|
| (J2000) | (J2000) | (arcsec) | (mJy) | (mJy bm−1) | (μJy bm−1) | (arcsec) | (deg) | ||
| HOPS-66-B | 05:35:26.927 | −05:09:22.41 | HOPS-370 | 15.2 | 0.078 ± 0.013 | 0.070 | 7.5 (6.8) | Unresolved | ⋯ |
| HOPS-66-A | 05:35:26.857 | −05:09:24.40 | HOPS-370 | 14.7 | 0.293 ± 0.014 | 0.254 | 7.5 (6.8) | Unresolved | ⋯ |
| HOPS-370 | 05:35:27.633 | −05:09:34.40 | HOPS-370 | 1.0 | 2.841 ± 0.018 | 1.931 | 6.9 (6.9) | 0.08 × 0.03 | 5.6 |
| MGM-2297 | 05:35:27.474 | −05:09:44.16 | HOPS-370 | 10.9 | 0.146 ± 0.018 | 0.102 | 7.6 (7.3) | 0.09 × 0.03 | 10.9 |
| HOPS-64 | 05:35:26.996 | −05:09:54.08 | HOPS-108 | 6.4 | 0.255 ± 0.018 | 0.170 | 6.9 (6.8) | 0.06 × 0.05 | 158.6 |
| HOPS-108 | 05:35:27.084 | −05:10:00.06 | HOPS-108 | 0.4 | 0.099 ± 0.019 | 0.068 | 6.8 (6.8) | 0.07 × 0.06 | 156.2 |
| VLA16 | 05:35:26.824 | −05:10:05.64 | HOPS-108 | 6.4 | 0.040 ± 0.012 | 0.041 | 6.8 (6.8) | Unresolved | ⋯ |
| VLA15 | 05:35:26.410 | −05:10:05.95 | HOPS-108 | 11.4 | 0.532 ± 0.031 | 0.178 | 7.1 (6.8) | 0.18 × 0.07 | 85.7 |
| OMC-2 FIR4 ALMA1 | 05:35:26.784 | −05:10:08.82 | HOPS-108 | 9.5 | 0.059 ± 0.013 | 0.054 | 7.0 (6.7) | Unresolved | ⋯ |
| HOPS-369 | 05:35:26.970 | −05:10:17.27 | HOPS-108 | 17.0 | 0.051 ± 0.007 | 0.047 | 8.1 (7.2) | Unresolved | ⋯ |
| HOPS-368 | 05:35:24.728 | −05:10:30.09 | HOPS-108 | 46.0 | 1.101 ± 0.020 | 0.965 | 18.5 (7.2) | 0.06 × 0.03 | 72.6 |
Note. Observed properties of the sources observed by the VLA at 9 mm. The "VLA Field" column corresponds to the main target observed in a particular field and the "Δϕ" column is the angular separation in arcseconds from the phase center of the field. The source names VLA16 and VLA15 refer to sources identified in Osorio et al. (2017), and MGM refers to Megeath et al. (2012). The integrated flux densities and peak intensities are primary beam corrected; the rms noise uncorrected for the primary beam is given in parentheses.
Download table as: ASCIITypeset image
OMC-2 FIR3 has four continuum sources associated with it located at the positions of HOPS-370, MGM-2297, and HOPS-66. HOPS-66 contains two continuum sources and is a newly detected binary system separated by 223 (892 au); these two sources are denoted HOPS-66-A and HOPS-66-B. HOPS-370 has a previous detection of an infrared companion ∼3'' south (Nielbock et al. 2003) that is not detected by ALMA or the VLA. This apparent companion is brighter at wavelengths less than 12 μm, but HOPS-370 is dominant at longer wavelengths. OMC-2 FIR4 contains six continuum sources that are associated with HOPS-108, HOPS-64, VLA15, VLA16, HOPS-369, and ALMA1. Note that HOPS-369 is more closely associated with OMC-2 FIR5, which corresponds to the southern extension of dust emission from OMC-2 FIR4 (Figure 1), but we still discuss it in relation to the other protostars in FIR4. The projected separations from HOPS-108 (measured at 0.87 mm) to the other sources associated with FIR4 are as follows: 68 (2720 au, VLA16), 615 (2460 au, HOPS-64), 117 (4680 au, VLA15), 105 (4020 au, ALMA1), and 173 (6920 au, HOPS-369). HOPS-368 does not lie within OMC-2 FIR4, but is just at the edge of the core.
We compare our identification of the continuum emission associated with the protostellar sources to the multiwavelength imaging that has been conducted toward the region. Figure 2 shows the continuum positions overlaid on several images: ground-based 2.13 μm, Spitzer 4.5 μm, Spitzer 24 μm, and Herschel 70 μm, along with SCUBA 450 μm and ALMA 3 mm contours overlaid (Johnstone & Bally 1999; Megeath et al. 2012; Furlan et al. 2014; Kainulainen et al. 2017). The two shorter wavelengths show a combination of emission from the embedded protostars and pre-main-sequence stars with disks; it is clear, however, that HOPS-108, VLA15, VLA16, and ALMA1 exhibit very little emission in these bands. On the other hand, HOPS-370 and HOPS-66 have prominent emission at 2.13 and 4.5 μm, and the Class II source (MGM-2297) south of HOPS-370 (Megeath et al. 2012) is also apparent at these wavelengths. MGM-2297 may be located in the foreground and not be directly associated with OMC-2 FIR3.
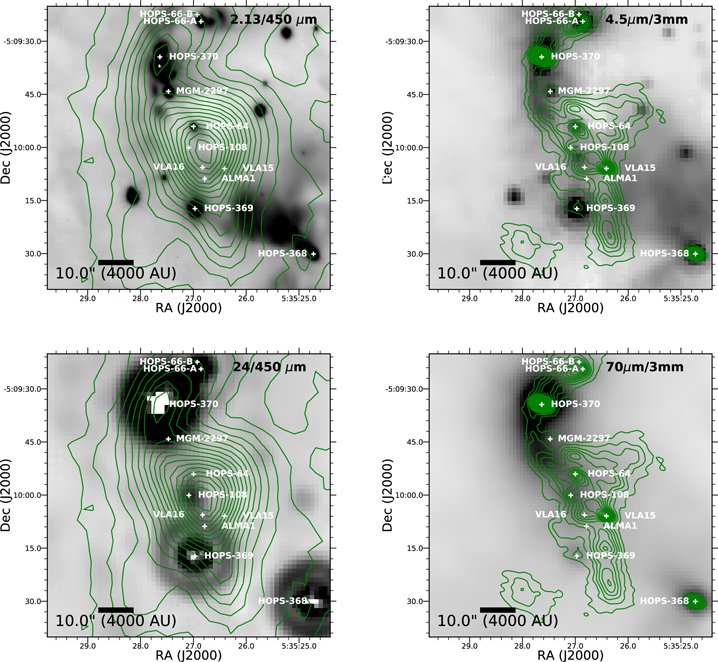
Figure 2. The OMC-2 FIR3/4 region is shown in gray scale at 2.13 μm (top left), 4.5 μm (top right), 24 μm (bottom left), and 70 μm (bottom right). The two left panels show contours of the SCUBA 450 μm emission (Johnstone & Bally 1999), and the two right panels show contours of the ALMA+ACA 3 mm maps (Kainulainen et al. 2017). The source positions detected from the VLA and ALMA surveys are marked with white plus signs in all panels. The 2.13 μm and Spitzer 4.5 μm images show emission from young stars in the region arising from inner disk emission, scattered light, and shocked molecular hydrogen emission. The 24 and 70 μm emission shows where the bulk of the warm dust is radiating owing to the internal heating from the protostars, in addition to evidence for some external heating in the extended emission at 70 μm. The 450 μm and 3 mm primarily show cold dust emission; the prominent peak at the center of the image is classically known as OMC-2 FIR4. Some of the most deeply embedded protostars detected with the VLA and ALMA (VLA16 and VLA15) do not have distinct 4.5 μm emission located at their position. The stars that are detected at 2.13 and 4.5 μm and not detected by ALMA and the VLA are likely more evolved YSOs and not embedded protostars. Several of the most centrally located sources in FIR4 (HOPS-108, VLA16, HOPS-64, and VLA15) have local peaks in 3 mm emission in the ALMA maps.
Download figure:
Standard image High-resolution imageThe nondetections of HOPS-108, VLA16, VLA15, and ALMA1 at 2.13 and 4.5 μm are expected for protostars too deeply embedded for their emission to be detected at short wavelengths. The 2.13 and 4.5 μm images can trace the presence of shock-excited H2 emission, scattered light in outflow cavities, and the continuum emission from the warm inner disks surrounding pre-main-sequence stars. There is some compact infrared emission adjacent to them (within ∼1'') that could be associated with scattered light, but this possibility is difficult to substantiate with the ∼1'' seeing of the 2.13 μm image and the 12 angular resolution of the Spitzer IRAC images. HOPS-64 and HOPS-369 both have the most directly associated, point-like 4.5 μm emission of all detected sources within FIR4, and HOPS-64 has some evidence of a scattered light cone extending southwest in addition to a well-resolved conical scattered light feature in Hubble Space Telescope data (Kounkel et al. 2016). There is also a spot of emission at 4.5 μm located southwest of HOPS-108, between it and VLA16, which may be associated with a shock from the HOPS-370 jet, identified as VLA 12S in Osorio et al. (2017).
It is important to compare the 24 and 70 μm maps in Figure 2 with the ALMA and VLA detections because the peaks in those maps will generally signify the internally generated luminosity from protostars and their accretion disks. HOPS-370 is the brightest source in the field at both 24 and 70 μm, and the 70 μm emission extends southwest of the source.
Toward the peak of FIR4, HOPS-108 is the brightest infrared source at wavelengths between 24 and 70 μm (Adams et al. 2012; Furlan et al. 2014). At longer wavelengths, the emission that can be directly associated with HOPS-108 is blended with the extended emission associated with the surrounding FIR4 core (Furlan et al. 2014). HOPS-369 is brighter than HOPS-108 at 24 μm, but it is located ∼17'' from the peak 450 μm emission, near the FIR5 region (Mezger et al. 1990). HOPS-369 is also fainter than HOPS-108 at 70 μm and longer wavelengths, and it does not appear as deeply embedded in its core, especially given its detection at near-infrared wavelengths (Figure 2). HOPS-368 is the second-brightest source in the field at 24 and 70 μm, but it is located outside the FIR4 core to the southwest by ∼46''. HOPS-64 is detected but blended with HOPS-108. Then, VLA16, VLA15, and ALMA1 are not well detected at 24 μm or 70 μm, possibly due to blending with nearby sources at the ∼7'' resolution of the data at these wavelengths.
The 450 μm intensity is highest near HOPS-108, VLA16, VLA15, and ALMA1, indicating significant column densities of cold dust and large gas masses (Furlan et al. 2014). The emission extends north and has a peak associated with HOPS-370 and further extends toward HOPS-66. Furthermore, the higher-resolution 3 mm map from ALMA (Kainulainen et al. 2017) shows local peaks of emission associated with HOPS-108, HOPS-64, VLA16, and VLA15. To the north there are also 3 mm peaks associated with HOPS-370, HOPS-66, and MGM-2297. Kainulainen et al. (2017) also detect two other potential substructures at 3 mm south of VLA15 associated with the FIR5 region, but they lack ALMA/VLA detections at high resolution. HOPS-369 has a weaker peak associated with its position relative to the others, and ALMA1 does not have a 3 mm peak associated with its position. Thus, HOPS-108, HOPS-64, VLA16, and VLA15 are the most likely sources to be young and embedded within FIR4. Of these protostars, HOPS-64 appears to be the least embedded, with detections even at optical wavelengths (Rodríguez-Ledesma et al. 2009). Furlan et al. (2016) classified HOPS-64 as a Class I protostar because its SED longward of 24 μm is blended with the surrounding sources; the lack of a detection longward of 24 μm by Adams et al. (2012) demonstrates that its SED is not steeply rising with increasing wavelength and may not be embedded within an envelope. The peak at 3 mm at the location of HOPS-64 and its detection at optical and near-infrared wavelengths could mean that it is physically associated with the OMC-2 FIR4 but near the edge in the foreground. Taken together, the correspondence of HOPS-108 with the brightest 24 and 70 μm detections within FIR4, its proximity to the 450 μm peak, and its lack of direct detection shortward of 8 μm make it most likely to be the most luminous protostar within OMC-2 FIR4.
3.2. ALMA and VLA Continuum Images
We show the ALMA (0.87 mm) and VLA (9 mm) continuum images toward the sources within the OMC-2 FIR4 and OMC-2 FIR3 regions in Figure 3. All the sources are detected at both wavelengths, indicating robust detections. This is important given the very high resolution of these observations. The continuum emission at 0.87 mm on these scales is expected to trace mostly emission from the disks surrounding the protostars, but some emission could result from the inner envelope.

Figure 3. Continuum images of the ALMA- and VLA-detected protostars in the vicinity of OMC-2 FIR4 and OMC-2 FIR3. The ALMA 0.87 mm images are shown in color, while the VLA 9 mm images are represented as black contours (white for HOPS-370 to enhance visibility). HOPS-108 is marginally resolved but does not appear disk-like, though this could be due to a low inclination. HOPS-64 is also marginally resolved and appears to show an elongation in the SE-to-NW direction. VLA15 is very well resolved at both 0.87 and 9 mm, possibly tracing an edge-on disk; it is the only source in FIR4 that is well resolved at 9 mm. HOPS-370 is also well resolved at 0.87 and 9 mm with contributions from both its disk and its jet. The 9 mm contours start at and increase by ±3σ until 30σ, where the contours begin to increase on 15σ intervals; σ for each source is listed in Table 3. Note that the images are not primary beam corrected. The beam size of the ALMA images is 011 × 010 (44 au × 40 au) (white ellipse), and the VLA beam size is 008 × 007 (32 au × 28 au) (black ellipse; white for HOPS-370).
Download figure:
Standard image High-resolution imageThe continuum emission of HOPS-108 has flux densities of ∼30 mJy at 0.87 mm and ∼100 μJy at 9 mm. HOPS-108 appears marginally resolved at 0.87 mm, but no elongation or substructure is apparent, and the 9 mm detection is a point source. Furthermore, HOPS-108 has lower flux densities than several of the surrounding protostars in the region at these wavelengths (Tables 2 and 3). The 0.87 mm emission could be tracing a disk at a low inclination (close to face-on), which could explain its near circularly symmetric appearance. VLA15 was identified at 5 cm by Osorio et al. (2017) and exhibits the morphology of an edge-on disk at both 0.87 and 9 mm, but the asymmetry at 9 mm could also indicate that this protostar is a close binary. HOPS-64 has detections in both continuum bands and appears marginally resolved and elongated as expected for a disk, and VLA16 is point-like and faint at both wavelengths.
We stated earlier that HOPS-66 was a binary system separated by 223. HOPS-66-A appears point-like at both 0.87 and 9 mm, while HOPS-66-B appears resolved at 0.87 mm but point-like at 9 mm. HOPS-370 is well resolved at both 9 and 0.87 mm and has a companion at shorter wavelengths that is not detected at 0.87 mm or 9 mm. At 0.87 mm it is clearly disk-like in appearance, while at 9 mm it has a cross-like morphology. The emission in the east–west direction is coincident with the resolved 0.87 mm emission, while the north–south emission is orthogonal to the major axis and corresponds to the jet direction observed at 5 cm Osorio et al. (2017). Thus, at 9 mm we are detecting both dust emission from its disk and free–free emission from the jet.
It is clear that some 9 mm detections appear offset from the 0.87 mm sources. All the FIR4-associated sources were observed within the same field as HOPS-108 at 9 mm, while all the sources associated with FIR3 (HOPS-370, HOPS-66, and MGM-2297) were observed within the same 9 mm field as HOPS-370. Some sources show a marginal offset (HOPS-108, HOPS-64, HOPS-66-B), while HOPS-368 shows a large offset from the center of the bright ∼05 extended feature found toward it. The dust emission from HOPS-368 at 0.87 mm is brighter toward the 9 mm position, possibly indicating that the extended feature might reflect two blended sources at 0.87 mm, with only one being detected at 9 mm. The slight offset toward HOPS-66-B also appears real given that the correspondence of HOPS-66-A is very close. The offsets toward HOPS-108 and HOPS-64, however, may not be real. HOPS-108, HOPS-64, VLA16, and VLA15 were all observed within the same ALMA field, and both HOPS-108 and HOPS-64 are offset in the same direction, and the low S/N of VLA16 at 9 mm and the extended nature of VLA15 are compatible with a systematic offset. Given that a systematic offset appears most likely, this could be the result of a systematic phase offset in the case of the ALMA observations, which might have resulted from the phase transfer from the calibrator to the sources or from self-calibration. This offset is ∼003 and does not substantially affect our analysis.
We also investigated how much flux was recovered in our observations relative to the APEX 0.87 mm observations presented in Furlan et al. (2014). The flux density measured by the APEX observations was 12.3 Jy in a 19'' aperture centered on HOPS-108. We summed the flux densities of all the FIR4-associated sources listed in Table 2, finding a total flux density of 0.257 Jy. Thus, we are only recovering ∼2% of the overall flux density from this region in our observations.
3.3. Dust Continuum Mass and Radius Estimates
We used the integrated flux densities measured with elliptical Gaussian fits to analytically calculate the mass of each continuum source within the FIR3 and FIR4 region. We make the simplifying assumption that the dust emission is isothermal and optically thin, enabling us to use the equation
In this equation, D is the distance (∼400 pc), Fν is the observed flux density, Bν is the Planck function, Tdust is the dust temperature, and κν is the dust opacity at the observed wavelength (0.87 mm for ALMA and 9 mm for the VLA.) We adopt κ0.87 mm = 1.84 cm2 g−1 from Ossenkopf & Henning (1994) column 5 (thin ice mantles, 106 cm−3 density), and we extrapolate the opacity to 9 mm using the 1.3 mm opacity (0.89 cm2 g−1) from Ossenkopf & Henning (1994) and adopting a dust opacity spectral index (β) of 1. Note that our adopted dust opacity at 9 mm is not from a continuous dust model but yields masses in agreement with shorter-wavelength studies (e.g., Tychoniec et al. 2018; Andersen et al. 2019). Otherwise, dust masses from the 9 mm data are unphysically large. We multiply the calculated dust mass by 100, assuming a dust-to-gas mass ratio of 1:100 (Bohlin et al. 1978), to obtain the gas mass. The average dust temperature we adopt for a protostellar system is given by

where T0 = 43 K, derived from a radiative transfer model grid of disks embedded within an envelope that is described in J. J. Tobin et al. (2019, in preparation). The average dust temperature of 43 K is reasonable for a ∼1 L⊙ protostar at a radius of ∼50 au (Whitney et al. 2003; Tobin et al. 2013). The luminosity is the Lbol for each protostellar system measured from the SED (Furlan et al. 2016). If a system does not have a measured Lbol (e.g., VLA16 and VLA15), then 1 L⊙ is assumed.
The masses derived from the continuum sources are listed in Table 4, as well as the radii derived from the Gaussian fits. The continuum emission from the protostars is likely to be partially optically thick; thus, the masses are likely lower limits, especially at 0.87 mm. The half-width at half-maximum (HWHM) of the continuum emission multiplied by the 400 pc distance to Orion is used to estimate the continuum source radius. We note that there is often disagreement between the continuum masses measured at 0.87 and 9 mm. This can be due to the uncertainty in scaling the dust mass opacity to 9 mm, but also there is likely free–free emission contributing to the 9 mm flux density and thus inflating the mass estimates (e.g., Tychoniec et al. 2018). The spectral indices determined from 8.1 to 10.1 mm using the full bandwidth of the VLA observations, also shown in Table 4, are evidence for free–free emission with spectral indices less than 2 found for several sources. A spectral index less than 2 is shallower than optically thick dust emission, thereby requiring an additional emission mechanism.
Table 4. ALMA- and VLA-derived Parameters
| Source | Other Names | Lbol | Tbol | Class | HWHMALMA | HWHMVLA | MALMA | MVLA | Sp. Index | Sp. Index |
|---|---|---|---|---|---|---|---|---|---|---|
| (L⊙) | (K) | (au) | (au) | (M⊙) | (M⊙) | (0.87–9 mm) | (8.1–10 mm) | |||
| HOPS-66-B | ⋯ | 21.0 | 264.9 | Flat | 34.0 ± 10.0 | ≤10.0 | 0.0048 ± 0.0002 | 0.015 ± 0.003 | 2.6 ± 0.09 | 0.5 ± 1.40 |
| HOPS-66-A | ⋯ | 21.0 | 264.9 | Flat | ≤10.0 | ≤10.0 | 0.0060 ± 0.0001 | 0.058 ± 0.003 | 2.1 ± 0.06 | 1.3 ± 0.41 |
| HOPS-370 | OMC-2 FIR3 | 360.9 | 71.5 | I | 67.0 ± 10.0 | 16 ± 10 | 0.0344 ± 0.0006 | 0.276 ± 0.002 | 2.2 ± 0.06 | 0.7 ± 0.05 |
| MGM-2297 | ⋯ | ⋯ | ⋯ | II | ⋯ | 18 ± 10 | 0.0030 ± 0.0006 | 0.063 ± 0.008 | 1.8 ± 0.12 | 0.2 ± 0.99 |
| HOPS-64 | MGM 2293, V2457 Ori | 15.3 | 29.7 | I | 19.0 ± 10.0 | 11 ± 10 | 0.0050 ± 0.0001 | 0.055 ± 0.004 | 2.1 ± 0.07 | 2.5 ± 0.61 |
| HOPS-108 | OMC-2 FIR4 | 38.3 | 38.5 | 0 | 24.0 ± 10.0 | 14 ± 10 | 0.0073 ± 0.0001 | 0.017 ± 0.003 | 2.8 ± 0.1 | 1.5 ± 2.26 |
| VLA16 | ⋯ | ⋯ | ⋯ | ⋯ | 19.0 ± 10.0 | ≤10.0 | 0.0022 ± 0.0003 | 0.017 ± 0.005 | 2.2 ± 0.15 | 2.3 ± 2.36 |
| VLA15 | ⋯ | ⋯ | ⋯ | ⋯ | 81.0 ± 10.0 | 35 ± 10 | 0.0405 ± 0.0005 | 0.228 ± 0.013 | 2.3 ± 0.07 | 1.7 ± 0.5 |
| OMC-2 FIR4 ALMA1 | ⋯ | ⋯ | ⋯ | ⋯ | 28.0 ± 10.0 | ≤17.0 | 0.0018 ± 0.0002 | 0.025 ± 0.006 | 1.9 ± 0.13 | 0.6 ± 1.97 |
| HOPS-369 | MGM 2282 | 35.3 | 379.2 | Flat | ≤10.0 | ≤10.0 | 0.0031 ± 0.0001 | 0.009 ± 0.001 | 2.7 ± 0.08 | 2.2 ± 1.03 |
| HOPS-368 | MGM 2279 | 68.9 | 137.5 | I | 37.0 ± 10.0 | 11 ± 10 | 0.0136 ± 0.0003 | 0.162 ± 0.003 | 2.1 ± 0.06 | 0.0 ± 0.11 |
Note. The columns HWHMALMA and HWHMVLA correspond to the HWHM radii in au, as a measure of the size of the continuum emission. The columns MALMA and MVLA correspond to 100 times the dust mass derived from the continuum flux density. The uncertainties on the masses are statistical only and do not take into account the ∼10% uncertainty in the absolute flux density scale.
Download table as: ASCIITypeset image
3.4. Methanol Emission Toward HOPS-108 and HOPS-370
We detected strong emission from three methanol transitions toward HOPS-108 and HOPS-370 within the spectral window containing 12CO. Methanol (CH3OH) is a complex organic molecule (COM), referring to molecules containing carbon and a total of six or more atoms (Herbst & van Dishoeck 2009) that are typically formed on the surfaces of icy dust grains (e.g., Chuang et al. 2016).
We examined the kinematics of the lines using integrated intensity maps of the blue- and redshifted emission. The blue- and redshifted contours of three methanol transitions are shown in Figure 4. The lowest-excitation methanol line ( ) exhibits an east–west velocity gradient in both HOPS-108 and HOPS-370. The higher-excitation methanol lines toward HOPS-108 (
 and
and  ) have velocity gradients from southeast to northwest. The shift in the position angle is ∼135°, demonstrating that the different transitions may be arising from different physical environments in HOPS-108. However, toward HOPS-370 the higher-excitation lines trace an east–west velocity gradient, appearing to trace a rotation pattern across the disk detected in dust continuum. The methanol emission toward HOPS-370 appears reduced at the regions of brightest continuum emission, and the brightest methanol emission is above and below the continuum disk on the northeast and southwest sides, not unlike HH212 MMS (Lee et al. 2018).
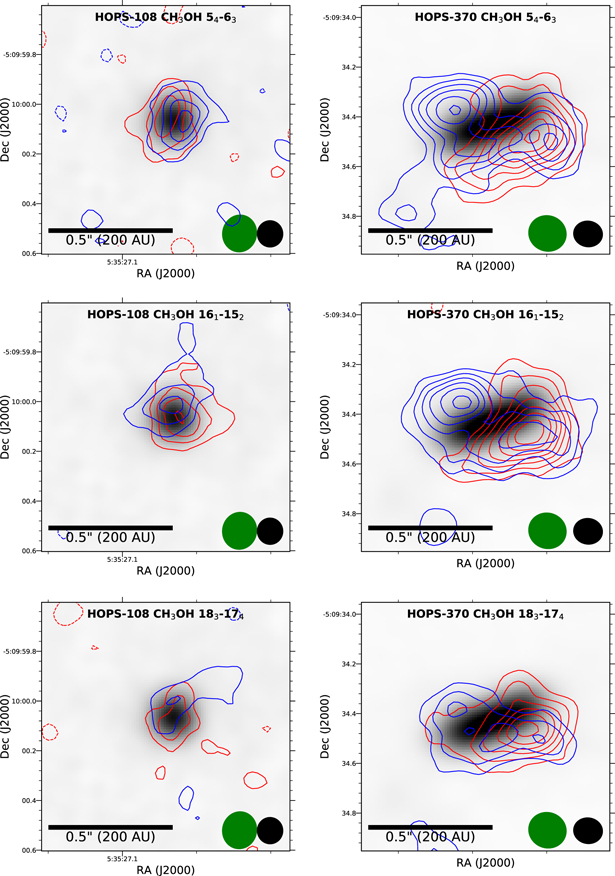
Figure 4. Integrated intensity maps of methanol emission toward HOPS-108 (left) and HOPS-370 (right) overlaid on the 0.87 mm continuum (gray scale). The CH3OH ( ) are shown in the top, middle, and bottom panels, respectively. The integrated intensity maps of CH3OH are separated into blue- and redshifted velocities and plotted with blue and red contours, respectively. The contours start at 3σ and increase on 2σ intervals. See the Appendix for more details of the particular molecular transitions shown. These molecular lines are indicative of a compact, warm object associated with the continuum. The velocity gradient of CH3OH changes from the lowest-energy transition to two higher transitions for HOPS-108, perhaps suggesting the presence of rotation and outflow motion. HOPS-370, in contrast, is consistent with rotational motion across all the transitions. The beams of the continuum and molecular line data are shown in the lower right as black and green ellipses, respectively. The continuum beam is 011 × 010, and the molecular line beams are ∼015 × 014.
Download figure:
Standard image High-resolution imageAdditional molecular line emission was detected toward HOPS-108 and HOPS-370, but not toward the other sources in the field. The molecular line emission toward HOPS-108 and HOPS-370 is analyzed and discussed in more detail in the Appendix.
3.5. Outflows in 12CO
HOPS-370 exhibits a clear high-velocity outflow in 12CO ( ), shown in Figure 5, that is in agreement with the larger-scale CO outflow detected by Shimajiri et al. (2008). The blueshifted outflow is oriented in the northeast direction, while the redshifted outflow is in the southeast direction. There is spatial overlap within the blue- and redshifted lobes in the low- and intermediate-velocity ranges owing to the source being located near-edge-on. Also in the intermediate-velocity panel, the origin of the blue- and redshifted outflows appears to be offset on either side of the disk in continuum emission.

Figure 5. ALMA 12CO blue- and redshifted integrated intensity maps toward HOPS-370 overlaid on ALMA 0.87 mm continuum (gray scale). The three panels (from left to right) correspond to low velocity (−26 to −3 km s−1 and 3 to 12 km s−1), intermediate velocity (−39 to −27 km s−1 and 13 to 45 km s−1), and high velocity (−56 to −40 km s−1 and 46 to 66 km s−1). The velocity ranges are with respect to the system velocity of ∼11.2 km s−1. The low- and intermediate-velocity panels show evidence for spatial offset between the blue- and redshifted emission at the base of the outflow. The contour levels in each panel start at 5σ and increase on 3σ intervals. In the low-velocity, intermediate-velocity, and high-velocity panels, σlow = 0.12 (0.09) Jy beam−1, σmid = 0.053 (0.076) Jy beam−1, and σhigh = 0.056 (0.063) Jy beam−1, respectively, with the redshifted level being given in parentheses. The 12CO beam is 025 × 024.
Download figure:
Standard image High-resolution imageWe examined the 12CO data toward HOPS-108 to see if an outflow is detectable from it. We show integrated intensity maps of the red- and blueshifted 12CO emission toward HOPS-108 in Figure 6. Similar to the HOPS-370 images in Figure 5, we break the 12CO emission into different velocity ranges and overlay them on the VLA 5 cm maps from Osorio et al. (2017). The extended 5 cm emission to the northeast and southwest (VLA 12C and VLA 12S) are knots from the HOPS-370 jet emitting synchrotron emission, while HOPS-108 at the center is emitting thermal free–free emission (Osorio et al. 2017). The 12CO emission has significant complexity; the low-velocity (±3–10 km s−1) emission does not appear very organized, but there is an arc-like feature ∼4'' southwest of HOPS-108 that is coincident with emission detected at 5 cm. Furthermore, in the low-velocity map there is a hint of blue- and redshifted emission extending ∼15 on either side of the continuum source that could trace an outflow at a position angle of ∼45°, but this feature is highly uncertain and perhaps spurious. We examined the 13CO emission, but the emission was not strong enough to detect a clear outflow at low velocities.
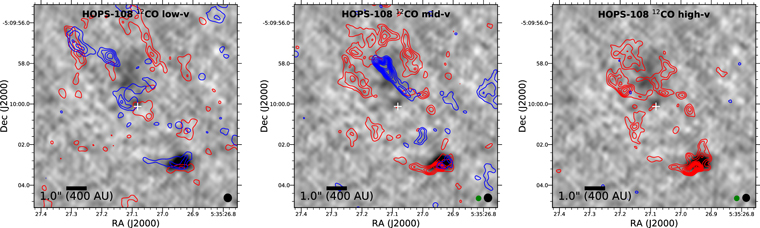
Figure 6. ALMA 12CO blue- and redshifted integrated intensity maps overlaid on VLA 5 cm emission (gray scale). The position of HOPS-108 from the ALMA continuum data is marked with a white plus sign. The three panels (from left to right) correspond to low velocity (±3 to 10 km s−1), intermediate velocity (±10 to 20 km s−1), and high velocity (−20 to −30 km s−1 and 15 to 25 km s−1). The velocity ranges are with respect to the system velocity of ∼12.6 km s−1. The brightest and southernmost 5 cm emission feature (∼4'' southwest of HOPS-108) coincides well with the southernmost blue- and redshifted clump of 12CO emission. At intermediate and high velocities the redshifted 12CO traces an elliptical feature with a position angle from northeast to southwest. Northeast of HOPS-108, diffuse 5 cm emission (∼2'' northeast of HOPS-108) fills in some of the structure that is lower intensity in the 12CO emission. The contour levels in each panel start at 5σ and increase on 3σ intervals. In the low-velocity, intermediate-velocity, and high-velocity panels, σlow = 0.19 (0.19) Jy beam−1, σmid = 0.092 (0.12) Jy beam−1, and σhigh = 0.051 (0.089) Jy beam−1, respectively, with the redshifted level being given in parentheses. The beams at 5 cm and 12CO are shown in the lower right as black and green ellipses, respectively. The 5 cm beam is 039 × 037, and the 12CO beam is 025 × 024.
Download figure:
Standard image High-resolution imageThe intermediate-velocity (±10–20 km s−1) emission remains complex, and the blueshifted emission is dominated by a linear feature northeast of HOPS-108 that does not appear to trace back to HOPS-108. The redshifted emission in this velocity range has a morphology that resembles an elliptical ring or loop, possibly centered on and surrounding HOPS-108. Northeast of the protostar, extended 5 cm emission appears within the loop-shaped feature traced by the redshifted 12CO. There is still blue- and redshifted emission coincident with the bright 5 cm emission to the southwest of HOPS-108, but the blueshifted emission there is fainter.
Lastly, at the highest velocities (−20 to −30 km s−1 and 15 to 25 km s−1) there is no corresponding blueshifted emission near HOPS-108, but redshifted emission is still apparent. The loop seen at intermediate velocities is now smaller and appears pinched toward HOPS-108 along the minor axis of the loop. Also, the higher-velocity redshifted 12CO emission seems to anticorrelate with the spatial distribution of the 5 cm emission within this region.
A clear outflow driven by HOPS-108 cannot be positively identified in the ALMA observations, though there could be a hint of one at low velocities. It is possible that the redshifted 12CO emission observed is tracing an outflow from HOPS-108, but the morphology of the emission only changes northeast of the protostar and not southwest. It is possible that the protostar is oriented face-on, a possibility indicated by the marginally resolved and circularly symmetric continuum emission. In this case, the morphology of the outflow would appear more complex at this resolution if it has a wide opening angle. It is difficult, however, to reconcile the appearance of the loops surrounding HOPS-108 with a typical bipolar outflow. Also, the 12CO emission in the vicinity of HOPS-108 could be complex owing to the outflow from HOPS-370 (FIR3) crossing this region (Shimajiri et al. 2008; González-García et al. 2016). Other searches for outflows in Orion from 13CO emission (Williams et al. 2003), 12CO (Shimajiri et al. 2008; Hull et al. 2014; Kong et al. 2018), and the near-infrared (Stanke et al. 2006; Davis et al. 2009) are also not conclusive for HOPS-108. The highly embedded nature of HOPS-108 and the density of nearby sources reduce the utility of near-infrared outflow indicators and the previous molecular line observations that could have traced the outflow; both had low angular resolution (even in the near-infrared) and were confused with the outflow from HOPS-370.
We also examined the 12CO emission toward VLA16, HOPS-64, VLA15, and ALMA1 and did not find evidence for outflows from any of these sources. The strong CO emission from the molecular cloud and the spatial filtering, however, make these nondetections far from conclusive, and observations with higher S/N and imaging fidelity are required to properly establish the presence or lack of CO outflows from these sources. Finally, the apparent edge-on nature of VLA15 will make its outflow difficult to disentangle from the molecular cloud because any outflow is not expected to have a large velocity separation from the cloud.
4. Discussion
Most previous studies of OMC-2 FIR4 and OMC-2 FIR3 have been limited to modest spatial resolution. The highest-resolution millimeter continuum maps from ALMA and NOEMA had ∼3'' resolution or worse (López-Sepulcre et al. 2013; Kainulainen et al. 2017; Favre et al. 2018). This limitation has resulted in significant ambiguity of the actual content and location of discrete protostellar sources within FIR4. The centimeter-wave maps from the VLA were useful in identifying likely young stellar objects (Osorio et al. 2017), but the presence of the extended jet from HOPS-370 (FIR3) in emission at 5 cm makes it difficult to positively infer a protostellar nature from the 5 cm detections in the region. The observations presented here with <01 (40 au) resolution from both VLA at 9 mm and ALMA at 0.87 mm enable us to more conclusively identify the protostellar content from their compact dust emission at these wavelengths. Hence, these data shed new light on the star formation activity that is taking place within these massive cores.
4.1. A Young Stellar Group in OMC-2 FIR4
The source known as FIR4 has long been known to not simply be a discrete protostar, but possibly a collection of several sources (Shimajiri et al. 2008). The designation of FIR4 refers to the ∼30'' region (12,000 au) centered on the large, massive core (∼30 M⊙) identified at 1.3 mm by Mezger et al. (1990) and followed up by Chini et al. (1997). Further analysis by Furlan et al. (2014) fit a modified blackbody to the emission at wavelengths longer than 160 μm, finding a temperature of 22 K, a mass of 27 M⊙, and a luminosity of 137 L⊙. The observed total integrated luminosity of FIR4 is ∼420 L⊙ (Mezger et al. 1990), but much of this luminosity originates at wavelengths longer than 70 μm and includes contributions from multiple protostars and likely external heating.
Several studies have suggested that FIR4 is a protocluster. Shimajiri et al. (2008) resolved FIR4 into 11 cores at λ = 3 mm, but compared to the ALMA λ = 3 mm maps from Kainulainen et al. (2017) with superior sensitivity and our detected source positions, some of the fragmentation within FIR4 detected by Shimajiri et al. (2008) is in fact spurious owing to interferometric imaging artifacts. The maps from Kainulainen et al. (2017) identify about six fragments within FIR4 at ∼3'' (1200 au) resolution, while López-Sepulcre et al. (2013) identify two main fragments at ∼5'' (2000 au) resolution. These observations, however, were optimized for examining fragmentation of the FIR4 core on larger scales, while the compact dust emission that we are detecting on ∼01 (40 au) scales is likely to be directly associated with forming protostars within FIR4.
HOPS-108, VLA16, HOPS-64, VLA15, and ALMA1 all appear to be associated with the FIR4 core at least in projection. The projected separations of these sources with respect to HOPS-108 are given in Section 3, and they have an average projected separation of 104 (4160 au). HOPS-369 is on the outskirts of FIR4, separated by 173 from HOPS-108. HOPS-369 is classified as a more evolved flat-spectrum protostar, and HOPS-64 might also be a flat-spectrum protostar, despite its classification as a Class I, due to blending at longer wavelengths. Furthermore, the near- to mid-infrared characteristics and detections at short wavelengths toward HOPS-64 and HOPS-369 point to them being more evolved and possibly located toward the edge of the FIR4 core, in the foreground. HOPS-108, VLA16, VLA15, and ALMA1, however, all appear as compact continuum sources and do not have obvious direct detections at wavelengths shorter than 8 μm. Their lack of short-wavelength detections is indicative of their youth and likely physical association with the FIR4 core and embedded within it. We note, however, that we cannot rule out some sources being located in the foreground or background for FIR4. For example, ALMA1 lacks a peak in the ALMA 3 mm map at 3'' resolution, meaning that it does not have a significant amount of dust emission concentrated at its position.
While previous studies of HOPS-108 indicate that it is likely the most luminous source within FIR4, VLA16 and VLA15 also lie close to the center of the core. Numerical studies have shown that even monolithic collapse of a massive core could lead to the formation of a young stellar group, but those fragments are generally formed via disk fragmentation (Krumholz et al. 2009; Rosen et al. 2016). There is, however, no protostar at the exact center of the FIR4 core that would likely have formed via monolithic collapse, and the several widely separated protostars within FIR4 could point to competitive accretion within the core if these protostars are physically associated with FIR4 and actively accreting material (e.g., Zinnecker 1982; Bonnell et al. 2001; Hsu et al. 2010). Indeed, VLA16 and VLA15 could continue to accrete mass and evolve into intermediate-mass stars. However, the only observational data on VLA16 and VLA15 are their millimeter and centimeter flux densities, and there are no current constraints on their luminosities or kinematics.
There has also been debate about what is driving the complex chemistry that is observed on larger scales within FIR4 (López-Sepulcre et al. 2013; Ceccarelli et al. 2014; Favre et al. 2018). In López-Sepulcre et al. (2013), they denote their fragments as main and west, in addition to south, which appears in molecular lines. The region denoted "main" is most closely associated with our detection of the compact continuum toward HOPS-108. Also, there is bright methanol and DCN emission from the location of main/HOPS-108 indicative of a heating source evaporating methanol, especially since an offset between DCN and DCO+ could indicate that DCN is forming via high-temperature chemistry with CH2D+ (e.g., Parise et al. 2009; Öberg et al. 2012).
López-Sepulcre et al. (2013) suggested that FIR4 might contain an embedded B star with ∼1000 L⊙, based on their observations of complex organics and the marginally resolved source detected at 3.6 cm wavelengths with ∼6'' (2400 au) resolution (Reipurth et al. 1999). Thus, they interpreted the detection of 3.6 cm emission as an ultracompact H ii region. With higher-resolution centimeter data, Osorio et al. (2017) showed that the centimeter-wave emission contains contributions from both HOPS-108 and knots in the HOPS-370 outflow. These knots show both proper motion away from HOPS-370 and nonthermal spectral indices. Hence, the data in Osorio et al. (2017) showed conclusively that the emission is not from an ultracompact H ii region (see Section 4.2). An ultracompact H ii region would have a spectral index reflecting thermal free–free emission, and the nonthermal spectral index and proper motions observed by Osorio et al. (2017) are inconsistent with that interpretation.
4.2. Outflow Interaction with HOPS-370 (FIR3)?
It is known that the powerful jet from HOPS-370 is directed toward the east side of the FIR4 core (Figures 5 and 6), and HOPS-108 in particular appears coincident with this jet (at least in projection). Shimajiri et al. (2008) first suggested that the outflow from FIR3 was directly impinging on FIR4 and possibly triggering star formation there. González-García et al. (2016) presented Herschel [O i] maps that show that the brightest emission is located near HOPS-108, but there is also a clear jet seen in [O i] emission extending from HOPS-370 to HOPS-108. Favre et al. (2018) noted, however, that there was not definitive evidence for interaction in the gas temperatures of c-C3H2, but the resolution of these observations was relatively low, ∼9'' × 6'' (3600 au × 2400 au) and ∼5'' × 3'', and the upper-level excitation of the highest-energy transition observed was just 16 K.
The VLA 5 cm maps presented by Osorio et al. (2017) show that the jet from HOPS-370 has strong shocks that are producing centimeter-wave radio emission with a spectral slope indicative of synchrotron emission. One knot has passed the position of HOPS-108 already (VLA 12S) and is located ∼4'' southwest. The other is located ∼2'' northeast from HOPS-108 (VLA 12C; see Figure 6). The VLA 12S is clearly interacting with molecular gas, given that we observe both blue- and redshifted 12CO emission coincident with it, possibly reflecting a terminal shock. Toward the knot located northeast of HOPS-108 (VLA 12C), the diffuse 5 cm emission seems to be surrounded by 12CO emission. Also, the knots show proper motion from northeast to southwest, and the observed 12CO morphology is consistent with the jet moving through and interacting with this medium.
Ceccarelli et al. (2014) have suggested that there is a source of high-energy particles within FIR4 that is helping to drive the observed chemistry, albeit under the assumption that all molecules within the beam are cospatial. The shocks driven by the jet from HOPS-370 are emitting synchrotron emission. Padovani et al. (2016) and Gaches & Offner (2018) suggested that such jet shocks would be a natural source for high-energy particles, without the requirement for a particularly massive protostar within HOPS-108. However, the shocks in the jet may not be strong enough to drive the chemical abundance ratios found by Ceccarelli et al. (2014), but accretion shocks >10−6 M⊙ yr−1 could (Gaches & Offner 2018). It is also important to note that the molecular column densities in Ceccarelli et al. (2014) were derived from low angular resolution Herschel HIFI observations that include the entire core. Thus, it is not clear whether the molecules used to infer the need for high cosmic-ray ionization are spatially coincident and physically associated. Furthermore, Gaches et al. (2019) argued that the ratio of HCO+ to N2H+ may not accurately reflect the cosmic-ray ionization rate, which was the basis of the arguments by Ceccarelli et al. (2014).
Despite the indications of interaction between the HOPS-370 jet and the molecular gas in FIR4, the observed interaction is not necessarily impacting HOPS-108. Indeed, the interaction could be happening in front of or behind HOPS-108 itself. If we consider that the HOPS-370 jet has a full opening angle of 2°, equivalent to the jet subtending 400 au at the physical distance to HOPS-108 of 11,000 au, the approximate size of the shocks from the HOPS-370 jet is ∼400 au (Osorio et al. 2017). Then, the ratio of this angle to 180° corresponds to the random probability of the HOPS-370 jet crossing HOPS-108 in projection. The probability of the HOPS-370 jet overlapping HOPS-108 in projection by chance is only 0.011. A similar calculation is possible for a direct interaction in three dimensions. Since we know that the jet already crosses HOPS-108, we can reduce the dimensionality to two and only consider the jet width and the depth of the cloud. If we assume that the cloud has a depth equivalent to its projected size (22,000 au), then the probability of a direct interaction is ∼0.02. Thus, it is possible, but perhaps not likely, that the HOPS-370 jet is directly impacting HOPS-108. Osorio et al. (2017) suggested that perhaps the jet impact triggered the formation of HOPS-108, similar to the scenario proposed by Shimajiri et al. (2008). A direct impact by a jet or outflow generally tends to disperse material rather than collect it (Arce & Sargent 2006; Offner & Arce 2014; Tafalla et al. 2017), but an oblique impact could lead to further gas compression. Given that the probability of the jet directly impacting HOPS-108 is low, an oblique impact near HOPS-108 could be feasible.
4.3. Origin and Implications of the Compact Methanol Emission
HOPS-108 in FIR4 and HOPS-370 within FIR3 are the only sources with compact, high-excitation methanol emission that we detect, as well as compact emission in other molecules and COMs (see Section 3.4 and the Appendix). This result does not mean that other sources in FIR4/FIR3 do not also emit methanol, but they are below our sensitivity limit on <200 au spatial scales. The methanol emission that we detect is very compact, centered on the continuum sources of HOPS-108 and HOPS-370 (Figures 4). The methanol lines that we detect have Eup ≥ 115 K and rotation temperatures of 140 and 129 K for HOPS-108 and HOPS-370, respectively (see the Appendix, Table 5). Therefore, warm conditions are required to excite these transitions. This points to a source of moderate to high luminosity both to evaporate methanol out to several tens of au from the protostar and to excite these particular transitions, unless it is heated by interaction with its own outflow (as opposed to its luminosity from the protostar and accretion; e.g., Lee et al. 2018). The methanol emission, however, is known to extend out to large radii in lower-excitation lines, encompassing much of the core (López-Sepulcre et al. 2013). Thus, we are very much detecting the "tip of the iceberg" in our high-resolution observations. Detections of high-excitation methanol emission centered on HOPS-108 and HOPS-370, while not elsewhere in the core, indicate that the presence of gas-phase methanol is the direct result of the internal heating from the protostars. The more extended methanol emission could be due to the ambient heating in the cluster environment. Indeed, there are several cases of extended methanol emission from prestellar cores in the absence of a direct internal heating source (Bacmann et al. 2012; Jiménez-Serra et al. 2016).
The presence of these high-excitation methanol lines and the other transitions detailed in the Appendix are all typical tracers of hot molecular cores (e.g., Schilke et al. 1997; Hatchell et al. 1998), usually associated with high-mass protostars. These hot cores, however, typically have luminosities of ∼103–104 L⊙; HOPS-108 has a luminosity that is constrained from its SED to be ≤100 L⊙, and HOPS-370 has a luminosity of 360 L⊙.
The presence of compact COM emission, coupled with the relatively low luminosities of HOPS-108 and HOPS-370 (compared to hot cores), is consistent with hot corinos, lower-luminosity protostars that have rich molecular spectra, similar to hot cores. Some examples of hot corinos are NGC 1333 IRAS 2A, NGC 1333 IRAS 4A2, L483, HH212 MMS, and IRAS 16293–2422 (Ceccarelli 2004; Taquet et al. 2015; Drozdovskaya et al. 2016; Jacobsen et al. 2019; Lee et al. 2018).
HOPS-370 is clearly the most luminous protostar within FIR3 and has strong continuum emission in the submillimeter and centimeter. On the other hand, HOPS-108 has compact and not particularly strong continuum emission at high resolution (and submillimeter/centimeter wavelengths), but HOPS-108 appears to harbor the most luminous protostar within FIR4. It is consistent with having a luminosity that is at least high enough to evaporate methanol off dust grains in its immediate vicinity and excite the observed high-excitation transitions. The radius of the methanol-emitting region around HOPS-108 from the HWHM of methanol integrated intensity maps is ∼50 au (0125). Assuming that methanol has an evaporation temperature of 120 K (Collings et al. 2004), the luminosity required to heat dust to this temperature at a radius of 50 au is ∼86 L⊙, calculated assuming thermal equilibrium. This is consistent with the range of luminosities favored by Furlan et al. (2014). Ice mixtures, however, can increase the evaporation temperature to ∼160 K, which would then require a luminosity of ∼270 L⊙, higher than the most likely luminosity range defined by Furlan et al. (2014). However, the luminosity of protostars is known to be variable (Hartmann et al. 1996; Safron et al. 2015; Fischer et al. 2019), and outbursts from low-mass stars have been shown to release complex organics out to relatively large radii (van't Hoff et al. 2018). The release of molecules from the ice happens nearly instantaneously (Collings et al. 2004). Then, when the outburst fades, the molecules can take 100–10,000 yr to freeze out again (depending on the density), leaving an imprint of outburst in the chemical richness of submillimeter and millimeter spectra (Jørgensen et al. 2015; Visser et al. 2015; Frimann et al. 2016). Hence, the inconsistency in the luminosities inferred from the SED and the evaporation temperature may be explained by such luminosity variations.
4.4. The Luminosity and Ultimate Mass of HOPS-108
Based on the analysis from Furlan et al. (2014), our high-resolution continuum maps, and the compact methanol emission, it is clear that HOPS-108 is the most luminous protostar within FIR4. Several studies of the near- to far-infrared observations (Adams et al. 2012; Furlan et al. 2014) used SED modeling to determine that the internal luminosity of HOPS-108 was between 37 and 100 L⊙. Much of the ambiguity in the luminosity results from the emission being blended in the mid- to far-infrared and the heating from multiple protostars illuminating the clump at wavelengths longer than 70 μm, in addition to the unknown inclination of the source. The constraints on the luminosity of the protostar from both the SED and the extent of the compact methanol emission, taken with the lack of a clear and powerful outflow, suggest that HOPS-108 is not currently a high-mass protostar but more likely a low- to intermediate-mass protostar. Indeed, much of the luminosity from HOPS-108 could result from accretion luminosity, and the observed radius of the COMs could reflect past luminosity bursts of the protostar and possibly not the current luminosity. However, assuming that the luminosity necessary to liberate the COMs out to the observed radii was the luminosity during a burst, we can calculate the estimated accretion rate necessary using protostellar structure models (Palla & Stahler 1993; Hartmann et al. 1997).
Accretion luminosity from gas in freefall onto the protostellar surface can be estimated from the equation Lacc ≃ GMps /Rps, where G is the gravitational constant, Mps is the protostellar mass,
  is the accretion rate on to the protostar, and Rps is the protostellar radius. We first adopt the case of a 1 M⊙ protostar. Hartmann et al. (1997) find that the radius of the protostar at a given mass depends on its accretion rate. A 1 M⊙ protostar that has been accreting at 2.0 × 10⁻⁶ M⊙ yr−1 would have a radius of ∼2.1 R⊙, and a protostar accreting at ∼1 × 10⁻⁵ M⊙ yr−1 would have a radius of ∼4.5 R⊙. For these protostellar radii, the luminosity from the protostellar photosphere is expected to be ∼3 and ∼10 L⊙, respectively. With the above stellar radii and a mass of 1 M⊙, accretion rates of ∼1.8 × 10⁻⁵ M⊙ yr−1 to ∼3.7 × 10⁻⁵ M⊙ yr−1 are necessary to reach a total luminosity of 270 L⊙.
If the protostar mass is currently 2 M⊙, the stellar radius is expected to be ∼4.5 R⊙ (Palla & Stahler 1993), and the luminosity from the protostellar photosphere would be ∼10 L⊙. These stellar parameters also require ∼1.9 × 10⁻⁵ M⊙ yr−1 to reach a total luminosity of 270 L⊙. These inferred mass accretion rates could also explain the luminosity of HOPS-370 if scaled upward by a factor of 1.33.
It is difficult to estimate the mass of a protostar from its current luminosity, meaning that both HOPS-108 and HOPS-370 could be low- to intermediate-mass protostars, with their current luminosities being set by their accretion rates. Once a protostar is much more massive than ∼3 M⊙, its luminosity becomes dominated by the stellar photosphere rather than accretion (Palla & Stahler 1993; Offner & McKee 2011). The inferred accretion rates are sufficiently high to produce significant cosmic-ray ionization, as predicted by Padovani et al. (2016) and Gaches & Offner (2018), even if the current luminosity of HOPS-108 is as low as 37 L⊙. Thus, it remains possible that the protostellar accretion, even though not from a high-mass star, could be driving the chemistry through local production of energetic particles or photons as suggested by Ceccarelli et al. (2014).
The FIR4 core has ∼30 M⊙ surrounding HOPS-108, while the FIR3 core is substantially less massive at ∼17 M⊙ (Nutter & Ward-Thompson 2007). Therefore, both HOPS-108 and HOPS-370 could potentially grow into at least an intermediate-mass star given its apparent central location, at least in projection. With the inferred accretion rate of HOPS-108 required to generate a total luminosity of 272 L⊙ it would take ∼1 Myr to accrete all this mass (assuming a 33% star formation efficiency; Machida & Hosokawa 2013; Offner & Arce 2014; Offner & Chaban 2017). A timescale of 1 Myr is very long relative to the estimated length of the protostellar phase (Dunham et al. 2014). The current low accretion rate (long accretion time) and its lack of strong mid-infrared emission could indicate that HOPS-108 is in an "IR-quiet" phase of high-mass star formation (e.g., Motte et al. 2018), a short-lived phase prior to becoming extremely luminous with a high accretion rate. Furthermore, the other embedded protostars in the region (VLA15 and VLA16) could also gain enough mass via accretion to become intermediate-mass stars.
4.5. Remaining Questions
There remain several inconsistencies between our results and other observations of HOPS-108. For example, no clear outflow has been detected from HOPS-108 itself in 12CO molecular line emission, and the free–free continuum source associated with HOPS-108 is very weak in comparison with HOPS-370. There is a known correlation between Lbol and free–free continuum emission (Anglada 1995; Shirley et al. 2007; Anglada et al. 2018; Tychoniec et al. 2018). If HOPS-108 is consistent with the correlation derived by Tychoniec et al. (2018), then a 100 L⊙ source is expected to have a 4.1 cm flux density of ∼1.5 mJy at the distance to Orion. HOPS-108 is ∼30× fainter at 4.1 cm than expected from its measured bolometric luminosity (Osorio et al. 2017). Thus, if outflow activity is correlated with accretion, the lack of such activity from HOPS-108 may be at odds with the high accretion rate needed to explain its high luminosity. There is significant scatter in the correlation between Lbol and free–free continuum, and the low 4.1 cm flux density does not rule out HOPS-108 having a luminosity of ∼100 L⊙.
The lack of an obvious outflow from HOPS-108 has implications for the interpretation of its far-infrared CO emission. HOPS-108 is among the strongest far-infrared CO emitters, significantly above the relationship found by Manoj et al. (2016). Thus, HOPS-108 may not actually be responsible for generating the CO emission, and instead it is dominated by the terminal shock from the nearby HOPS-370 outflow as suggested by González-García et al. (2016). This scenario would make HOPS-108 much more consistent with the Lbol versus LCO relationship derived for the majority of protostars (Manoj et al. 2016).
There are also alternative explanations for the rich molecular line spectrum observed toward HOPS-108. Shock heating could explain their presence toward HOPS-108 and enable it to have a low luminosity. For example, HH212 MMS is found to be exhibiting COM emission from the surface of its disk, presumably from mechanical heating by the outflow (Lee et al. 2018). Furthermore, the kinematics of the higher-excitation methanol transitions have different velocity gradient directions with respect to the lowest-excitation transition. Thus, we cannot rule out that some COM emission could result from shock heating by a nascent outflow that is not obvious in 12CO. It is very unlikely that the COM emission results from the HOPS-370 jet directly impacting HOPS-108 on a 100 au scale where the COMs are detected. If that were the case, we would expect the COM emission to be more extended and associated with the outflow knots observed (VLA 12S and VLA 12C). Instead, the observed emission is concentrated on the compact continuum of HOPS-108. Although it is difficult to rule out all mechanical or shock heating, the COM emission generated as a result of thermal evaporation from the luminosity of HOPS-108 is the simplest explanation.
5. Conclusions
We have used ALMA and the VLA, in conjunction with previous near- to far-infrared, single-dish submillimeter data, and interferometric mapping at millimeter wavelengths to identify and characterize the protostellar content of OMC-2 FIR3 and FIR4. Furthermore, serendipitous detections of compact methanol emission toward HOPS-108 and HOPS-370 enable us to better characterize the nature of the protostellar sources. Our main results are as follows:
- 1.We detect six distinct continuum sources at 0.87 and 9 mm that are spatially coincident with the OMC-2 FIR4 core: HOPS-108, VLA16, HOPS-64, VLA15, ALMA1, and HOPS-369. HOPS-108 is the most centrally located object in OMC-2 FIR4 and is deeply embedded. HOPS-108 is marginally resolved at 0.87 mm, but it does not show significant structure at the observed angular resolution. HOPS-108 has faint 9 mm emission, fainter than expected for a protostar with a luminosity of potentially 100 L⊙. HOPS-64 is also coincident with the FIR4 core but is more evolved and likely viewed in projection in the foreground given its detectability at optical/near-IR wavelengths. VLA15 also appears to have an edge-on disk, given its continuum morphology at 0.87 and 9 mm.
- 2.We detect four continuum sources associated with OMC-2 FIR3. HOPS-370 is at the position of FIR3 and accounts for the bulk of the luminosity from the region, and we also detect a binary system, HOPS-66-A and HOPS-66-B, separated by 223 (∼892 au). HOPS-370 is also an apparent binary with ∼3'' separation, but its companion is only detected at wavelengths shorter than 24 μm. A more evolved source MGM-2297 is also detected at both wavelengths further south from HOPS-370.
- 3.We detect compact methanol emission from three transitions toward HOPS-108 and HOPS-370, in addition to emission from other molecules. This indicates that HOPS-108 and HOPS-370 could be hot corinos. The molecular line emission originates from ∼100 au scales coincident with the HOPS-108 and HOPS-370 continuum sources. This is consistent with the protostars generating at least enough luminosity to desorb a significant amount of methanol out to ∼50 au radii. The only efficient route to forming methanol, however, is within ices, so the observed methanol emission must result from ice evaporation. We argue that thermal evaporation due to the luminosity of HOPS-108 is the simplest explanation for the methanol emission, but we cannot rule out shock heating from a nascent outflow from HOPS-108. The methanol emission in HOPS-370 has a clear velocity gradient along the major axis of the disk, likely tracing rotation.
- 4.We detect spatially and kinematically complex 12CO emission in the vicinity of HOPS-108 and do not positively detect an outflow from HOPS-108. We do, however, tentatively detect a candidate outflow at low velocities that is in a similar direction to the two higher-excitation methanol emission lines. The 12CO emission also appears to trace the interaction of the outflow/jet from nearby HOPS-370 (OMC-2 FIR3) within the region surrounding HOPS-108. VLA 5 cm emission is coincident with structures observed in 12CO, and the proper motion of the northern 5 cm feature is inconsistent with it coming from HOPS-108.
We conclude that HOPS-108 is the most luminous protostar within OMC-2 FIR4. It is likely a low- to intermediate-mass protostar but could potentially grow into a high-mass star with continued accretion. Higher-resolution and higher-sensitivity mapping from the far-infrared to millimeter wavelengths in both continuum and molecular lines will shed further light on the nature of the protostellar sources within OMC-2 FIR4 and their relationship to the OMC-2 FIR4 core.
We thank the anonymous referee for useful feedback that improved the quality of the manuscript and acknowledge useful discussions of this work with F. van der Tak, P. Schilke, and H. Beuther. We are grateful for the support from L. Maud at the Dutch Allegro ALMA Regional Center Node for his efforts in reducing the data. J.J.T. acknowledges support from the Homer L. Dodge Endowed Chair, grant 639.041.439 from the Netherlands Organisation for Scientific Research (NWO), and from the National Science Foundation AST-1814762. Z.-Y.L. is supported in part by NASA 80NSSC18K1095 and NSF AST-1716259. S.O. acknowledges support from NSF AAG grant AST-1510021. G.A., M.O., and A.K.D.-R. acknowledge financial support from the State Agency for Research of the Spanish MCIU through the AYA2017-84390-C2-1-R grant (co-funded by FEDER) and through the "Center of Excellence Severo Ochoa" award for the Instituto de Astrofísica de Andalucía (SEV-2017-0709). A.S. gratefully acknowledges funding through Fondecyt regular (project code 1180350) and Chilean Centro de Excelencia en Astrofísica y Tecnologías Afines (CATA) BASAL grant AFB-170002. Astrochemistry in Leiden is supported by the Netherlands Research School for Astronomy (NOVA), by a Royal Netherlands Academy of Arts and Sciences (KNAW) professor prize, and by the European Union A-ERC grant 291141 CHEMPLAN. M.L.R.H. acknowledges support from a Huygens fellowship from Leiden University. This paper makes use of the following ALMA data: ADS/JAO.ALMA#2015.1.00041.S. ALMA is a partnership of ESO (representing its member states), NSF (USA) and NINS (Japan), together with NRC (Canada), NSC and ASIAA (Taiwan), and KASI (Republic of Korea), in cooperation with the Republic of Chile. The Joint ALMA Observatory is operated by ESO, AUI/NRAO, and NAOJ. The National Radio Astronomy Observatory is a facility of the National Science Foundation operated under cooperative agreement by Associated Universities, Inc. This research made use of APLpy, an open-source plotting package for Python hosted at http://aplpy.github.com. This research made use of Astropy, a community-developed core Python package for Astronomy (Astropy Collaboration et al. 2018) http://www.astropy.org.
Facilities: ALMA - Atacama Large Millimeter Array, VLA - Very Large Array, Spitzer - Spitzer Space Telescope satellite, Herschel - European Space Agency's Herschel space observatory, Mayall - Kitt Peak National Observatory's 4 meter Mayall Telescope.
Software: Astropy (http://www.astropy.org; Astropy Collaboration et al. 2018; Greenfield et al. 2013), APLpy (http://aplpy.github.com; Robitaille & Bressert 2012), scipy (http://www.scipy.org; Jones et al. 2001), CASA (http://casa.nrao.edu; McMullin et al. 2007).
Appendix: Molecular Line Emission
We detected numerous molecular lines associated with HOPS-108 and HOPS-370 in our ALMA data (Table 5). We observed two bands with high spectral resolution centered on the 12CO and 13CO ( ) transitions. In addition to these two targeted lines, a number of other molecular lines are present within the 12CO and 13CO bands (Figures 7 and 8). Several of these lines originate from COMs (molecules containing carbon and a total of six or more atoms; Herbst & van Dishoeck 2009).
Table 5. Overview of the Molecular LinDetections toward HOPS-108 and HOPS-370
| Species | Transition | Frequency | Vlsr (H108) | Δv (H108) | Vlsr (H370) | Δv (H370) | Aul | Eup/k | gup | Fpeak (H108) | Finta (H108) | Fpeak (H370) | Fintb (H370) |
|---|---|---|---|---|---|---|---|---|---|---|---|---|---|
| (GHz) | (km s−1) | (km s−1) | (km s−1) | (km s−1) | (s−1) | (K) | (mJy beam−1) | (Jy km s−1) | (mJy beam−1) | (Jy km s−1) | |||
| 13CH3OH (A−) | 7−2,6 − 6−2,5 | 330.535890 | 13.3 ± 0.2) | 1.2 ± 0.2 | 11.2 ± 0.9 | 5.4 ± 1.0 | 1.46 × 10⁻⁴ | 89 | 15 | 46 ± 14.6 | 0.2 ± 0.13 | 103 ± 17 | 1.0 ± 0.25 |
| 13CO | J = 3 − 2 | 345.795990 | 13.2 ± 0.6 | 1.1 ± 0.6 | ⋯ | ⋯ | 2.19 × 10⁻⁶ | 32 | 7 | 75 ± 14.6 | 0.99 ± 0.16 | ⋯c | ⋯c |
| CH3CN | 188 − 178 | 330.665206 | 11.8 ± 0.8 | 0.5 ± 1.5 | 11.3 ± 1.2 | 3.5 ± 1.2 | 1.74 × 10⁻³ | 608 | 37 | 67 ± 14.6 | 0.2 ± 0.11 | 78 ± 17 | 0.5 ± 0.2 |
| H13CN | J = 4−3 | 345.339760 | 12.9 ± 0.4d | 3.3 ± 0.4d | 12.5 ± 0.5d | 5.4 ± 0.6d | 1.74 × 10⁻¹ | 41 | 9 | 117.5 ± 18.8e | 1.7 ± 0.12e | 223 ± 13d | 8.9 ± 0.3d |
| SO2 | 132,12 − 121,11 | 345.338539 | 12.9 ± 0.4d | 3.3 ± 0.4d | 12.5 ± 0.5d | 5.4 ± 0.6d | 2.38 × 10⁻⁴ | 93 | 27 | 117.5 ± 18.8e | 1.7 ± 0.12e | 223 ± 13d | 8.9 ± 0.3d |
| CH3OCHO(A) | 2813,16−2712,15 | 345.466962 | 12.4 ± 0.3d | 0.9 ± 0.3d | ⋯ | ⋯ | 4.94 × 10⁻⁴ | 352 | 57 | 70.2 ± 18.8d | 0.34 ± 0.1d | 61 ± 15 | < |
| CH3OCHO (A) | 2813,15−2712,14 | 345.466962 | 12.4 ± 0.3d | 0.9 ± 0.3d | ⋯ | ⋯ | 4.94 × 10⁻⁴ | 352 | 57 | 70.2 ± 18.8d | 0.34 ± 0.1d | < | < |
| CH3OCHO (E) | 2813,16−2712,15 | 345.466962 | 12.4 ± 0.3d | 0.9 ± 0.3d | ⋯ | ⋯ | 4.94 × 10⁻⁴ | 352 | 57 | 70.2 ± 18.8d | 0.34 ± 0.1d | < | < |
| HC3Nf | J = 38 − 37 | 345.609010 | ⋯ | ⋯ | 11.6 ± 0.4g | 4.2 ± 0.5g | 3.29 × 10⁻³ | 323 | 77 | 66 ± 18.8 | 0.24 ± 0.1 | 158 ± 14g | 3.0 ± 0.2g |
| CH3OCHOf (E) | 1413,2−1412,3 | 345.613535 | ⋯ | ⋯ | 11.6 ± 0.4g | 4.2 ± 0.5g | 1.5 × 10⁻⁵ | 174 | 29 | 66 ± 18.8g | 0.24 ± 0.1g | 158 ± 14g | 3.0 ± 0.2g |
| CO | J = 3 − 2 | 345.795990 | ⋯ | ⋯ | ⋯ | ⋯ | 2.5 × 10⁻⁶ | 33 | 7 | ⋯ | ⋯c | ⋯ | ⋯c |
| CH3OH (A−) | 161 − 152 | 345.903916 | 12.7 ± 0.3 | 1.7 ± 0.3 | 10.7 ± 0.3 | 4.0 ± 0.3 | 8.8 × 10⁻⁵ | 333 | 33 | 133.4 ± 18.8 | 0.69 ± 0.10 | 171 ± 15 | 4.7 ± 0.23 |
| CH3OH (E2) | 183 − 174 | 345.919260 | 12.6 ± 0.4 | 1.5 ± 0.4 | 11.4 ± 0.5 | 4.8 ± 0.5 | 7.1 × 10⁻⁵ | 459 | 37 | 99.1 ± 18.8 | 0.52 ± 0.10 | 138 ± 14 | 2.7 ± 0.23 |
| CH3OCHO (E) | 2812,16−2712,15 | 345.974664 | 13.7 ± 0.7 | 1.3 ± 0.7 | ⋯ | ⋯ | 5.16 × 10⁻⁴ | 335 | 57 | 73.6 ± 18.8d | 1.1 ± 0.2d | 84 ± 15d | < |
| CH3OCHO (A) | 2812,17−2712,16 | 345.985381 | 13.1 ± 0.8d | 2.1 ± 0.8d | ⋯ | ⋯ | 5.16 × 10⁻⁴ | 335 | 57 | 73.6 ± 18.8d | 0.95 ± 0.2d | 84 ± 15d | < |
| CH3OCHO (A) | 2812,16−2712,15 | 345.985381 | 13.1 ± 0.8d | 2.1 ± 0.8d | ⋯ | ⋯ | 5.16 × 10⁻⁴ | 335 | 57 | 73.6 ± 18.8d | 0.95 ± 0.2d | 84 ± 15d | < |
| CH3OCHO (E) | 2812,17−2712,16 | 346.001616 | 12.1 ± 0.4 | 1.0 ± 0.4 | ⋯ | ⋯ | 5.16 × 10⁻⁴ | 335 | 57 | 73.6 ± 18.8d | 0.95 ± 0.2d | < | < |
| CH3OH (A−) | 54 − 63 | 346.202719 | 12.0 ± 0.4d | 2.3 ± 0.4d | 10.5 ± 0.4d | 5.0 ± 0.5d | 2.1 × 10⁻⁵ | 115 | 11 | 113.3 ± 18.8d | 0.78 ± 0.11d | 182 ± 15d | 5.2 ± 0.25d |
| CH3OH (A+) | 54 − 63 | 346.204271 | 12.0 ± 0.4d | 2.3 ± 0.4d | 10.5 ± 0.4d | 5.0 ± 0.5d | 2.1 × 10⁻⁵ | 115 | 11 | 113.3 ± 18.8d | 0.78 ± 0.11d | 182 ± 15d | 5.2 ± 0.25d |
| NS | J =  , F = , F = 
|
346.220137 | 12.6 ± 0.3d | 1.2 ± 0.3d | 10.3 ± 0.6d | 5.7 ± 0.9d | 7.38 × 10⁻⁴ | 71 | 31 | 79.6 ± 18.8d | 0.36 ± 0.1d | 102 ± 14d | 1.9 ± 0.2d |
| NS | J =  , F = , F = 
|
346.221163 | 12.6 ± 0.3d | 1.2 ± 0.3d | 10.3 ± 0.6d | 5.7 ± 0.9d | 7.38 × 10⁻⁴ | 71 | 31 | 79.6 ± 18.8d | 0.36 ± 0.1d | 102 ± 14d | 1.9 ± 0.2d |
| NS | J =  , F = , F = 
|
346.221163 | 12.6 ± 0.3d | 1.2 ± 0.3d | 10.3 ± 0.6d | 5.7 ± 0.9d | 7.38 × 10⁻⁴ | 71 | 31 | 79.6 ± 18.8d | 0.36 ± 0.1d | 102 ± 14d | 1.9 ± 0.2d |
Notes.
aWithin a 05 diameter aperture.
bWithin a 075 diameter aperture.
cMeasurements not performed for CO/13CO due to significant spatial filtering.
dBoth/all lines combined.
eH13CN and SO2 combined.
fCH3COOH (acetic acid) and other methyl formate (CH3OCHO) transitions could also contribute to the total line flux.
gHC3N and CH3OCHO combined.
Download table as: ASCIITypeset image
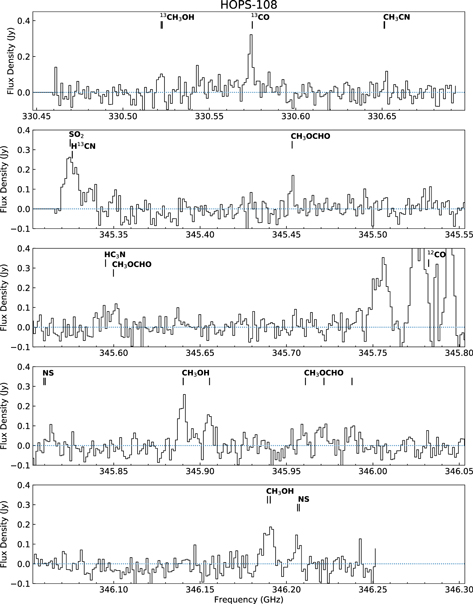
Figure 7. Spectra of HOPS-108 centered at 330.575 GHz (top) and 345.8 GHz (lower four panels), showing the presence of various molecules in emission toward the compact continuum source. The spectra were extracted from a 05-diameter circle centered on the continuum source. The major identified features are labeled, and the horizontal dashed line marks the zero flux level in the spectra. Note that the structure around the 12CO ( ) transition (345.735–345.80 GHz) is complex owing to spatial filtering and not the result of additional molecular features.
Download figure:
Standard image High-resolution image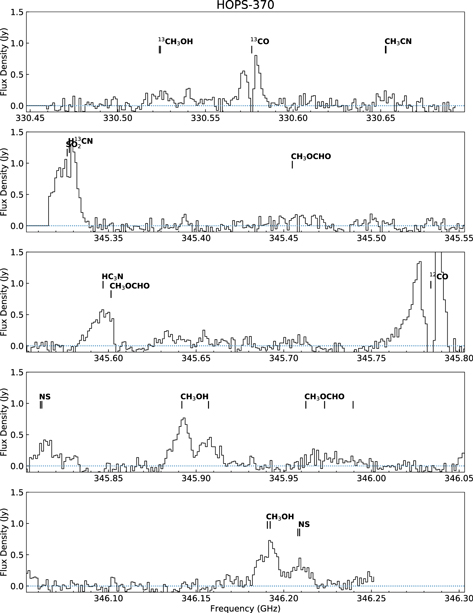
Figure 8. Same as Figure 7, but for toward HOPS-370.
Download figure:
Standard image High-resolution imageWe examined the spectra toward all continuum sources in the FIR4 region, and HOPS-108 is the only one to exhibit emission from COMs and molecules other than 12CO. The spectrum of HOPS-108, centered on 12CO and 13CO, is shown in Figure 7. We detect several molecules that are typically detected in hot cores or hot corinos, such as methanol (CH3OH), methyl formate (CH3OCHO), and NS (nitrogen sulfide) (e.g., Schilke et al. 1997; Hatchell et al. 1998), as well as a strong H13CN/SO2 line toward HOPS-108. There are also tentative detections of HC3N blended with another methyl formate line, as well as possible detections of emission from 13CH3OH and CH3CN. Details of the detected molecular transitions are provided in Table 5. The velocity center and line width of each line are fit with a Gaussian function using the curve_fit function of scipy. The system velocity of HOPS-108 is found to be 12.6 km s−1, which is redshifted by about ∼1–2 km s−1 with respect to molecules observed on larger scales by López-Sepulcre et al. (2013). The average line width from Table 5 (using unblended lines and a single value from the blended lines) is ∼1.5 km s−1.
We also examined the spectra of protostars in the FIR3 region, and toward HOPS-370 we detect methanol, NS, H13CN/SO2, and HC3N blended with methyl formate, and we show the spectrum in Figure 8 and list the line properties in Table 5. The detected lines toward HOPS-370 have higher flux densities and larger line widths compared to HOPS-108; these features are evident from a comparison of the spectra in Figures 7 and 8. The system velocity of HOPS-370 is ∼11.2 km s−1, with an average line width of ∼4.8 km s−1. The larger line width may explain the lack of a clear detection for the three methyl formate lines between 345.95 and 346.0 GHz. We also tentatively detect an additional NS feature at 345.81 GHz, and this feature may also be present in HOPS-108. This feature is contaminated by the high-velocity wings of the HOPS-370 outflow, so the line flux density is uncertain. Also, there is a methyl formate transition at a similar frequency that could also potentially contaminate the NS emission.
The nondetections of emission from molecules other than 12CO toward other sources could in part be due to primary beam attenuation. HOPS-64 is situated at the ∼72% power point in our data, making it unlikely that the nondetection toward HOPS-64 is due to the primary beam attenuation if the emission were comparable in strength to HOPS-108. VLA15, however, is at the ∼32% power point, making detections much more difficult. The typical peak line flux densities are 0.25 toward HOPS-108, and dividing this by a factor of 3 would result in a peak line flux density of 0.08 Jy, which would be difficult to distinguish from noise. Hence, we would not expect to detect emission from VLA15 even if it was at the same level as HOPS-108.
We show the integrated intensity maps of the NS and methyl formate emission summed over the entire line(s) for HOPS-108 in Figure 9, and we show the blue- and redshifted integrated intensity maps for HOPS-370 in Figure 9 as well. The H13CN/SO2 emission toward HOPS-108 appears to trace an east–west velocity gradient, similar to the low-excitation methanol (Figure 4), and the H13CN/SO2 toward HOPS-370 also shows a rotation pattern across its disk similar to methanol. The NS emission also appears to trace rotation toward HOPS-370, similar to the methanol emission. However, toward HOPS-108 the NS total integrated intensity emission is offset from the continuum source to the northwest, while the other molecular lines appear centered on the continuum source. However, the line widths and velocity centroids of all the lines detected are consistent within the uncertainties of the measurements, meaning that the lines could all be emitted from the same region.
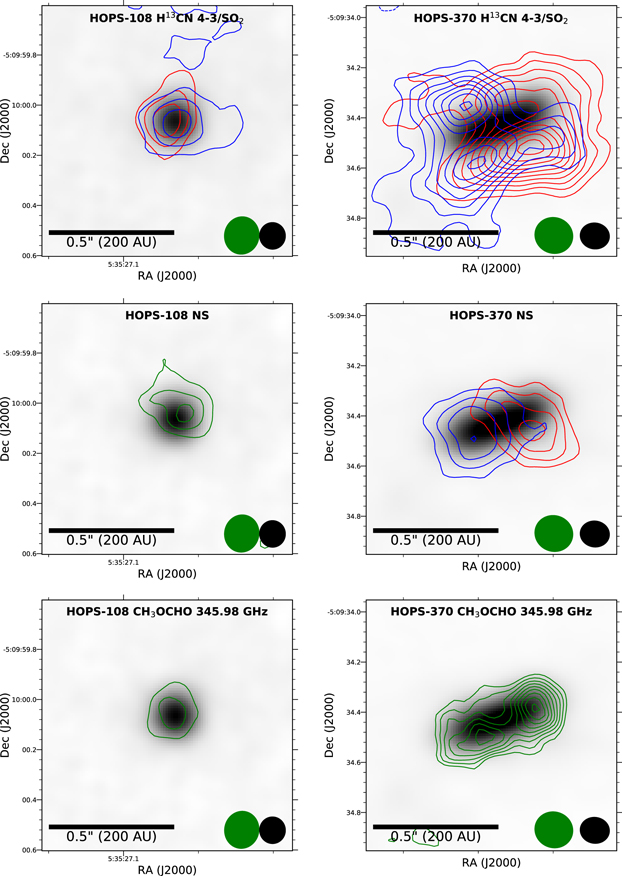
Figure 9. Integrated intensity maps toward HOPS-108 (left) and HOPS-370 (right) overlaid on the 0.87 mm continuum (gray scale) of the molecular lines H13CN ( ) blended with SO2 (
 ), NS (
 ), and methyl formate (CH3OCHO) (282,16-2712,15 E, 2812,17-2712,16 A, and 2812,17-2712,16 E). The integrated intensity maps of H13CN/SO2 are separated into blue- and redshifted velocities and plotted with blue and red contours, respectively. CH3OCHO and NS are too low in intensity and are integrated over the entire line profile and plotted with green contours. The contours start at 3σ and increase on 2σ intervals. See Table 5 for more details of the particular molecular transitions shown. The beams of the continuum and molecular line data are shown in the lower right as black and green ellipses, respectively. The continuum beams are ∼011 × 010, and the molecular line beams are ∼015 × 014.
Download figure:
Standard image High-resolution imageTo characterize the excitation conditions of the methanol emission further in HOPS-370 and HOPS-108, we used the four observed lines and their flux densities extracted from 05 (HOPS-108) and 075 (HOPS-370) diameter apertures to derive their rotation temperatures. Table 5 lists the measured line flux densities, and the uncertainties on the flux densities are determined from the rms flux density in regions devoid of emission. We utilize the methodology outlined in Goldsmith & Langer (1999) to construct a rotation diagram from the three methanol transitions shown in Figure 10. The lowest-excitation line, the ( ) transition at ∼346.203 GHz, is a blended transition of two lines, having the same upper-level excitation and Einstein A-coefficient. Thus, we divide the observed flux density by 2 and plot it as a single transition. From this analysis, we derive rotation temperatures of 140 and 129 K for HOPS-108 and HOPS-370, respectively. These temperatures are consistent with the conditions for thermal evaporation of methanol from the dust grain surfaces. We note, however, that the rotation diagram analysis assumes that the line emission is arising from the same physical structure and that the lines are optically thin. Thus, if the line emission for the different transitions originates from different physical components of the system (e.g., a rotating disk/inner envelope and/or the outflow), the derived rotation temperature may not reflect the physical temperature of the gas around the protostar. Furthermore, if any of the transitions are optically thick, then the column densities will be inaccurate, making the rotation temperatures inaccurate as well.

Figure 10. Rotation diagrams of the three methanol transitions for HOPS-108 (left) and HOPS-370 (right) listed in Table 5 and shown in Figures 7 and 8. The rotation temperatures of 140 and 129 K for HOPS-108 and HOPS-370, respectively, are indicative of the physical conditions required to thermally evaporate methanol from the dust grains. The highest-excitation transition appears to lie above the rotation temperature fit and could indicate a separate temperature component that is exciting the higher-energy transitions. It is difficult, however, to be certain with a rotation diagram defined by only three transitions.
Download figure:
Standard image High-resolution image
The column density of methanol emission derived using the rotation diagram indicates a methanol column density of 4.3 × 1016 cm−2 and 1.4 × 1017 cm−2 for HOPS-108 and HOPS-370, respectively. With these measurements of the methanol column density and the disk masses from the dust continuum, we can estimate the fractional abundance of methanol. We first convert the gas mass derived from the dust continuum into a column density by dividing the mass by the area defined by twice the ALMA disk radius from Table 4 and adopting a mean molecular weight of 2.8, finding 2.74 × 1024 cm−2 and 1.64 × 1024 cm−2 for HOPS-108 and HOPS-370, respectively. We use 2× the HWHM disk radius from Table 4 because it is determined from the HWHM and twice this value is a better representation of the full extent of dust emission. Figure 4 shows that the methanol emission is quite coincident with the continuum emission, and this is a reasonable assumption for the total H2 column density. We then find fractional abundances of methanol relative to H2 to be ∼1.6 × 10⁻⁸ and ∼8.5 × 10⁻⁸ for HOPS-108 and HOPS-370, respectively. These values are lower than the observed methanol ice abundances toward low-mass protostars (Boogert et al. 2015; ∼10−6–10−5), but significantly higher than the gas-phase methanol abundance of ∼10−11–10−12 found within the disk of TW Hya. The disk of TW Hya is too cold to thermally evaporate methanol throughout most of the disk and requires nonthermal desorption of methanol to explain this low abundance (Walsh et al. 2016). Furthermore, other studies of the fractional abundance of methanol toward high-mass star-forming regions from single-dish and interferometric studies employing different methodologies also find fractional abundances of gas-phase methanol similar to our values (e.g., Gerner et al. 2014; Feng et al. 2016). Furthermore, we are calculating the fractional abundances relative to the total gas mass derived from the dust continuum, which may overestimate the total mass from the methanol-emitting gas in the disk.
Kama et al. (2010) also observed a large number of methanol lines using Herschel HIFI toward OMC-2 FIR4. They found that many of these lines originated from a hot component with Tkin = 145 ± 12 K, comparable to our rotation temperature. From the methanol fit alone they found a column density of 2.2 × 1014 cm−2, and an LTE fit including an envelope and a hot component with a size smaller than 760 au indicates that the column density was ∼6 × 1016 cm−2. Thus, the column density inferred from the lower angular resolution observations is also in agreement with our methanol column densities.
In Section 4.3, we argued that HOPS-108 and HOPS-370 are consistent with being hot corinos. However, a possible difference between HOPS-108 and HOPS-370 and the hot corinos is the presence of NS emission. IRAS 16293–2422 is not known to have NS emission within its spectrum despite a sensitive spectral survey and detections of other sulfur-bearing species (Drozdovskaya et al. 2016), and it is not clear whether the others exhibit NS emission either owing to lack of spectral coverage. It was suggested by Viti et al. (2001) that NS arises in shocked emission and that the ratio of NS to CS emission could be indicative of the strength of that shock. However, the spatial location of NS toward HOPS-108 and HOPS-370 being associated with the continuum source and not the 12CO that overlaps with other shock tracers indicates that the NS is not likely tracing shock-heated gas. The other molecules detected do not differentiate between a hot corino and a hot core, but methanol must be formed on dust grains through hydrogenation (Chuang et al. 2016) and must be released via thermal evaporation to explain the quantities observed. Other molecules, however, such as HC3N and CH3CN, could be formed in the gas phase and may have their formation catalyzed by high cosmic-ray flux (Fontani et al. 2017; Offner et al. 2019).