


Abstract
The tight correlations between supermassive black hole (SMBH) mass (MBH) and the properties of the host galaxy have useful implications for our understanding of the growth of SMBHs and of the evolution of galaxies. Here, we present newly observed correlations between MBH and the host galaxy total UV−[3.6] color ( , Pearson's r = 0.6–0.7) for a sample of 67 galaxies (20 early-type galaxies and 47 late-type galaxies) with directly measured MBH in the Galaxy Evolution Explorer/S4G survey. The colors are carefully measured in a homogeneous manner using the far-UV, near-UV, and 3.6 μm magnitudes of the galaxies and their multicomponent structural decompositions in the literature. We find that more massive SMBHs are hosted by (early- and late-type) galaxies with redder colors, but the
  relations for the two morphological types have slopes that differ at ∼2σ level. Early-type galaxies define a red sequence in the
  diagrams, while late-type galaxies trace a blue sequence. Within the assumption that the specific star formation rate of a galaxy (sSFR) is well traced by LUV/L3.6, it follows that the SMBH masses for late-type galaxies exhibit a steeper dependence on sSFR than those for early-type galaxies. The
  and MBH − L3.6,tot relations for the sample galaxies reveal a comparable level of vertical scatter in the log MBH direction, approximately 5%–27% more than the vertical scatter of the MBH − σ relation. Our
  relations suggest different channels of SMBH growth for early- and late-type galaxies, consistent with their distinct formation and evolution scenarios. These new relations offer the prospect of estimating SMBH masses reliably using the galaxy color alone. Furthermore, we show that they are capable of estimating intermediate black hole masses in low-mass early- and late-type galaxies.
Export citation and abstract BibTeX RIS
1. Introduction
Almost all local galaxies are believed to harbor a supermassive black hole (SMBH, MBH ∼ 105–109M⊙) at their center (Magorrian et al. 1998; Richstone et al. 1998; Ferrarese & Ford 2005). The connection between SMBHs and their host galaxies has been a subject of interest since Kormendy & Richstone (1995, see also Dressler 1989) first reported a linear correlation between SMBH mass (MBH) and the luminosity of the host bulge (i.e., the entire galaxy in case of elliptical galaxies), see Kormendy & Ho (2013) and Graham (2016) for recent reviews. SMBH masses scale with a number of host galaxy properties, including stellar velocity dispersion (σ, Ferrarese & Merritt 2000; Gebhardt et al. 2000), bulge luminosity (Lbulge) and bulge mass (Mbulge, Kormendy & Richstone 1995; Magorrian et al. 1998), a depleted stellar core (e.g., Dullo 2019), and stellar concentration (Graham et al. 2001). Not only did these scaling relations allow us to predict MBH in galaxies, but they also led to a suggestion that the fueling and growth rate of the central SMBH are intimately coupled to the star formation rate and stellar mass build-up of the host galaxy. However, the exact nature of the physical mechanism driving this connection remains unclear.
Accretion of gas onto SMBHs triggers active galactic nucleus (AGN) feedback, which is critical for the regulation of the star formation and growth of the host galaxy (e.g., Silk & Rees 1998; Fabian 1999; Di Matteo et al. 2005; Springel et al. 2005; Croton et al. 2006; Hopkins et al. 2006). The distinct formation histories, colors, and structural properties of early- and late-type galaxies may therefore reflect two different channels of gas accretion and SMBH growth for the two morphological types (see Hopkins & Hernquist 2009; Shankar et al. 2009; Schawinski et al. 2010, 2014; Krajnović et al. 2018). Observations show that early-type (i.e., lenticular and elliptical) galaxies do not correlate with SMBHs in the same manner as late-type (i.e., spiral) galaxies do (e.g., McConnell & Ma 2013; Saglia et al. 2016; Savorgnan & Graham 2016; Krajnović et al. 2018; Sahu et al. 2019a, 2019b). Early-type galaxies are typically red with a low level of star formation rate, while late-type galaxies have blue colors and are actively star-forming. This dichotomy gives rise to a bimodal distribution of galaxies in the color–magnitude diagram—early-type galaxies define a red sequence that is separate from late-type galaxies, which reside in a blue cloud (e.g., Chester & Roberts 1964; Visvanathan & Griersmith 1977; Baldry et al. 2004; Brammer et al. 2009).
In the hierarchical galaxy formation scenario, early-type galaxies are built through mergers of smaller systems and accretion events (e.g., White & Rees 1978; Naab et al. 2006b; Hopkins et al. 2009a, 2009b; Rodriguez-Gomez et al. 2016; Mundy et al. 2017). Major-merger-driven inflow of gas into the nuclear regions of the newly formed merger remnant can produce rapid bursts of star formation and fuel the SMBH (Barnes & Hernquist 1991, 1996; Naab et al. 2006a; Hopkins & Quataert 2010). For late-type (i.e., spiral) galaxies, one of the most frequently advocated formation scenarios is secular evolution involving nonaxisymmetric stellar structures, such as bars and spiral arms, which can drive an inflow of gas from the disk into the nuclear region and onto the central SMBH (Kormendy 1982; Courteau et al. 1996; Carollo et al. 1997; Kormendy & Kennicutt 2004; Athanassoula 2005; Laurikainen et al. 2007; Fisher & Drory 2008; Graham & Worley 2008; Gadotti 2009; Dullo et al. 2016, 2019; Tonini et al. 2016).
A related issue is the observed departures from single power-law relations (e.g., bends and offsets) in SMBH scaling diagrams at the low-mass and high-mass ends or when the galaxy sample contains Sérsic and core-Sérsic galaxies. In particular, Graham (2012, see also Graham & Scott 2013) reported two separate MBH − Lbulge relations with distinct slopes for Sérsic and core-Sérsic galaxies. Core-Sérsic galaxies are luminous (MB ≲ −20.5 ± 0.5 mag) galaxies that exhibit a flattening in their inner stellar light distribution due to a central deficit of light relative to the inward extrapolation of their outer Sérsic (1968) light profile (Faber et al. 1997; Graham et al. 2003; Hopkins et al. 2009b; Dullo & Graham 2012, 2013, 2014, 2015; Dullo et al. 2017, 2018; Dullo 2019). They are thought to have formed from a few gas-poor major merger events,4 but a small fraction of them can host molecular gas reservoirs that feed an ongoing low level of star formation (Davis et al. 2019). In contrast, the low- and intermediate luminosity (MB ≳ −20.5 mag) Sérsic galaxies, with no depleted cores, are the product of gas-rich mergers (Hopkins et al. 2009a; Dullo & Graham 2012, 2014; Dullo et al. 2016, 2019). Departures from the best-fitting single power-law relation in a black hole scaling diagram may hold implications for SMBH and galaxy coevolution, but because the majority of SMBH scaling relations to date are based on host galaxy properties that solely trace the old stellar populations and disregard the young and intermediate-age stars, the exact mechanism to establish the assumed coupling between the growth of the SMBHs and the build-up of their host galaxies is unclear.
Here, we explore a scenario in which the complex interplay between the details of the SMBH growth, efficiency of AGN feedback, regulated star formation histories and major merger histories of the host galaxy establish a relation between the SMBH and color of the host galaxy (see also Schawinski et al. 2010, 2014). Emerging evidence has shown a link between MBH and the star formation rate (SFR) in nearby galaxies. Terrazas et al. (2017) reported an inverse correlation between the specific star formation rate (sSFR) and specific SMBH mass. Martín-Navarro et al. (2018) observed a trend between SMBH mass and host galaxy star formation histories, where the star formation in galaxies hosting more massive SMBHs was quenched early and more efficiently than in those with less massive SMBHs (see also van Son et al. 2019). Because the UV−[3.6] color ( ) is a good proxy for the sSFR (e.g., Bouquin et al. 2018), a correlation between MBH and UV−[3.6] color is expected. The UV flux is a proxy for the current SFR because it traces massive young stars. The emission at 3.6 μm, which is less affected by dust extinction, is a good proxy for stellar mass because it primarily traces older stellar populations. However, a small fraction (5%–15%) of the 3.6 μm flux can be due to contributions from intermediate-age stars, polycyclic aromatic hydrocarbons, and hot dust (Meidt et al. 2012). The MBH − color relation has so far been overlooked, in part owing to the narrow wavelength baselines that are commonly used to determine colors.
In this paper, we present for the first time correlations between MBH and  colors for 67 Galaxy Evolution Explorer (GALEX)/S4G galaxies with directly measured SMBH masses (van den Bosch 2016) and homogeneously determined GALEX far-UV (FUV), near-UV (NUV), and Spitzer 3.6 μm magnitudes (Bouquin et al. 2018). By dividing the sample galaxies by morphology, we fit two different
  relations with distinct slopes for early- and late-type galaxies.
The  relation has multiple important applications. It allows the SMBHs in early- and late-type galaxies to be predicted free from uncertainties due to distances and mass-to-light ratios, although there are uncertainties due to K-corrections for more distant galaxies. Furthermore, using the
  relation, we hope to properly understand the poorly constrained low-mass end of the SMBH scaling relations. In so doing, we can predict SMBHs or intermediate-mass black holes (IMBHs) with masses ∼100–105M⊙ in low-mass systems and bulgeless spiral galaxies. In addition, because colors are easy to measure even for high-redshift galaxies, studying the galaxy color and black hole mass evolution at different epochs may provide further clues on the different channels of black hole growth.
The paper is organized as follows. Section 2.1 describes the sample selection. Sections 2.2 and 2.3 describe the SMBH data, and the UV and 3.6 μm apparent asymptotic magnitudes. The derivation of bulge, disk, and total magnitudes for the sample galaxies along with the corresponding dust corrections and error measurements are discussed in Sections 3.1 and 3.2, respectively. We proceed to discuss the regression techniques we employed to fit the black hole scaling relations in Section 3.3 and present the results from our regression analyses in Sections 3.4 and 3.5. Section 4 provides a discussion of our results, including the origin and implications of the  relations. Section 5 summarizes our main conclusions.
There are four appendices at the end of this paper (Appendices A–D). Appendix A discusses our implementation of the Markov chain Monte Carlo (MCMC) Bayesian statistical method. Notes on five notable outliers in the  relations are given in Appendix B. Appendix C includes a table that lists apparent total magnitudes, flux ratios, dust corrections, and direct SMBH masses for our sample galaxies. We tentatively predict black hole masses in a sample of 1382 GALEX/S4G galaxies with no measured black hole masses using our
  relations and tabulate them in Appendix D.
2. Sample and Data
2.1. Sample Selection
Our investigation of correlations between the SMBH mass (MBH) and (UV−[3.6]) galaxy color uses UV and 3.6 μm magnitudes that are determined in a homogeneous manner for a large sample of galaxies with measured SMBH masses. Henceforth, we refer to the (UV−[3.6]) color as  . Bouquin et al. (2015, 2018) provided FUV (λeff ∼ 1526 Å), NUV (λeff ∼ 2267 Å), and 3.6 μm asymptotic magnitudes for a sample of 1931 nearby galaxies taken from the Spitzer Survey of Stellar Structure in Galaxies (S4G) sample (Sheth et al. 2010). They used UV and near-infrared (3.6 μm) imaging data obtained with the GALEX, (Martin et al. 2005; Gil de Paz et al. 2007) and the Infrared Array Camera on the Spitzer Space Telescope, respectively. We use the SMBH sample presented in van den Bosch (2016, his Table 2). They publish a compilation of directly measured SMBH masses (MBH), half-light radii (Re), and total Ks-band luminosities (Lk) for a large sample of 245 galaxies. We selected all galaxies that were in common with Bouquin et al. (2018) and van den Bosch (2016), resulting in a sample of 67 galaxies studied in this paper. Homogenized mean central velocity dispersions (σ) and morphological classifications (elliptical E, elliptical-lenticular E-S0, lenticular S0, lenticular-spiral S0-a, and spiral S) of the sample galaxies were obtained from Hyperleda5
(Paturel et al. 2003; Makarov et al. 2014). In the analysis of the scaling relations (Tables 1–4), the galaxies are divided into two broad morphological classes, early-type galaxies (9 Es, 2 E-S0s, 2 S0s, and 7 S0-a) and late-type galaxies (47 Ss). Most of our late-type galaxies are disk dominated. The full list of galaxies and their properties are presented in Appendix C.
. Bouquin et al. (2015, 2018) provided FUV (λeff ∼ 1526 Å), NUV (λeff ∼ 2267 Å), and 3.6 μm asymptotic magnitudes for a sample of 1931 nearby galaxies taken from the Spitzer Survey of Stellar Structure in Galaxies (S4G) sample (Sheth et al. 2010). They used UV and near-infrared (3.6 μm) imaging data obtained with the GALEX, (Martin et al. 2005; Gil de Paz et al. 2007) and the Infrared Array Camera on the Spitzer Space Telescope, respectively. We use the SMBH sample presented in van den Bosch (2016, his Table 2). They publish a compilation of directly measured SMBH masses (MBH), half-light radii (Re), and total Ks-band luminosities (Lk) for a large sample of 245 galaxies. We selected all galaxies that were in common with Bouquin et al. (2018) and van den Bosch (2016), resulting in a sample of 67 galaxies studied in this paper. Homogenized mean central velocity dispersions (σ) and morphological classifications (elliptical E, elliptical-lenticular E-S0, lenticular S0, lenticular-spiral S0-a, and spiral S) of the sample galaxies were obtained from Hyperleda5
(Paturel et al. 2003; Makarov et al. 2014). In the analysis of the scaling relations (Tables 1–4), the galaxies are divided into two broad morphological classes, early-type galaxies (9 Es, 2 E-S0s, 2 S0s, and 7 S0-a) and late-type galaxies (47 Ss). Most of our late-type galaxies are disk dominated. The full list of galaxies and their properties are presented in Appendix C.
In Figure 1 we determine potential sample selection biases by comparing MBH, Re, and Lk of our sample and those of another 178 known galaxies with measured black hole masses using data from van den Bosch (2016, his Table 2). Both the early- and late-type galaxies in our sample probe a wide range in MBH, Re, and Lk to allow a robust investigation of the  relations. We also find that our early- and late-type galaxies span a wide range in stellar mass (M*,k), Figure 1(c). We compute the galaxy stellar masses using Lk and assuming the Ks-band mass-to-light ratio M*/Lk = 0.10σ0.45 (van den Bosch 2016). Late-type galaxies in our sample have M*,k that range from 109M⊙ to 2 × 10¹¹M⊙, and for 75% of them, M*,k/M⊙ ≳ 2 × 10¹⁰. For the early-type galaxies, 1010 ≲ M*,k/M⊙ ≲ 1012, and 90% of these galaxies have M*,k/M⊙ ≳ 2 × 10¹⁰. It worth noting that the GALEX/S4G sample galaxies (Bouquin et al. 2018) were chosen to have radio-derived radial velocities of Vradio < 3000 Km s−1 in HyperLEDA. The sample therefore lacks H i-poor extremely massive galaxies, including brightest cluster galaxies (BCGs).
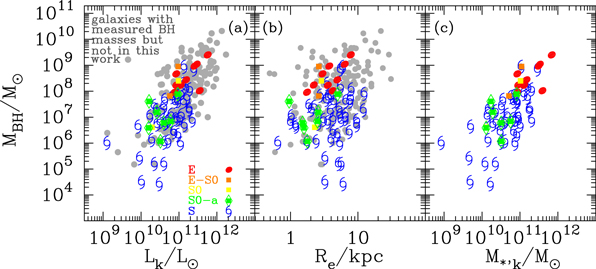
Figure 1. Galaxies with measured SMBH masses (MBH). MBH plotted as a function of (a) total Ks-band luminosity and (b) the half-light radius (Re) for a sample of 245 galaxies with measured MBH (van den Bosch 2016, his Table 2). Colored symbols denote our sample of 67 galaxies, whereas filled gray circles show the remaining 178 galaxies with measured MBH in van den Bosch (2016, his Table 2). Panel (c): MBH vs. total Ks-band stellar mass (M*,k) for our sample derived from the total Ks-band luminosities assuming the Ks-band mass-to-light ratio M*/Lk = 0.10σ0.45 (van den Bosch 2016). Morphological classifications are from HyperLeda.
Download figure:
Standard image High-resolution image2.2. Black Hole Masses
Our selected sample of 67 galaxies includes 64 galaxies with SMBH masses (MBH) that are determined from stellar, gas, or maser kinematic measurements. For the remaining 3 galaxies (NGC 4051, NGC 4593, and NGC 5273), MBH measurements were based on reverberation mapping (Bahcall et al. 1972; Peterson 1993). Of the 67 galaxies, 62 harbor black holes that are supermassive (i.e., MBH ≳ 106M⊙); see Appendix C. While the remaining 5 sample galaxies have 2 × 10⁴M⊙ ≲ (MBH) ≲ 3 × 10⁵M⊙, we also refer to these black holes as SMBHs. The sample includes 25 galaxies with MBH upper limits, comprised of 23 late-type galaxies and 2 early-type galaxies. We discuss the effect of including upper limits on the black hole scaling relations in Section 3. The uncertainties on MBH were taken from van den Bosch (2016).
2.3. UV and 3.6 μm Apparent Asymptotic Magnitudes
Bouquin et al. (2015, 2018) used the 3.6 μm surface brightness profiles from Muñoz-Mateos et al. (2015) to determine the 3.6 μm magnitudes for their galaxies. They extracted the UV surface brightness profiles of the galaxies following the prescription of Muñoz-Mateos et al. (2015). Briefly, the sky levels in galaxy images were first determined, then the images were masked to avoid bright foreground and background objects (Bouquin et al. 2018, their Section 3.1). The FUV, NUV, and 3.6 μm radial surface brightness profiles were then extracted using a series of elliptical annuli with fixed ellipticity and position angle, after the innermost regions, R < 3'', were excluded (Bouquin et al. 2015, 2018; Muñoz-Mateos et al. 2015). Each annulus has a width of 6'', and measurements were taken up to 3× the major axis of the galaxy D25 elliptical isophote. To derive the FUV, NUV, and 3.6 μm asymptotic magnitudes from the corresponding surface brightness profiles, Bouquin et al. (2018) extrapolated the growth curves. The UV and 3.6 μm data reach depths of ∼27 mag arcsec−2 and ∼26.5 mag arcsec−2, respectively, allowing the growth curves to flatten out for most galaxies. The method yielded robust asymptotic magnitudes with errors that are within the FUV and NUV zero-point uncertainties of 0.05 and 0.03 AB mag (Morrissey et al. 2007).
3. Results
3.1. Calculating Dust-corrected Total Magnitudes
The FUV, NUV, and 3.6 μm (total) asymptotic magnitudes of our sample were corrected for Galactic extinction by Bouquin et al. (2015, 2018) using the E(B − V) reddening values taken from Schlegel et al. (1998). For the analyses in the paper, we define the total galaxy luminosity as the sum of the luminosities of the bulge and disk, excluding additional galaxy structural components such as bars and rings. The bulk of the galaxies in our sample are multicomponent systems. Fractional luminosities of the individual structural components are needed to obtain accurate bulge and disk magnitudes from the total asymptotic magnitudes. We note that from here on, the term "bulge" is used when we refer to the spheroids of elliptical galaxies and to the bulges of disk galaxies. Fortunately, Salo et al. (2015) performed detailed 2D multicomponent decompositions of 3.6 μm images of all our galaxies into nuclear sources, bulges, disks, and bars, and they presented fractional bulge and disk luminosities that we use to calculate the 3.6 μm bulge and disk magnitudes. For two galaxies (NGC 3368 and NGC 4258) with poor fits in Salo et al. (2015), the 3.6 μm fractional luminosities were taken from Savorgnan & Graham (2016). The bulge-to-disk flux ratio (B/D) of a galaxy depends on the observed wavelength and galaxy morphological type (e.g., Möllenhoff 2004; Möllenhoff et al. 2006; Graham & Worley 2008; Kennedy et al. 2016). The UV B/T and D/T tabulated in Appendix C were derived using the 3.6 μm B/D together with the (extrapolation of the) B/D passband-morphological type diagram from Möllenhoff (2004, his Figure 5).
For the disk galaxies, we additionally applied the inclination-dependent (i) internal dust attenuation corrections from Driver et al. (2008, their Equations (1) and (2) and Table 1) to determine dust-corrected bulge and disk magnitudes. Because Driver et al. (2008) did not provide 3.6 μm dust corrections, we rely on the prescription for their reddest bandpass (i.e., K) to correct the 3.6 μm magnitudes. These corrections are given by


where cos(i) = b/a, i.e., the minor-to-major axis ratios, which were computed for our galaxies from the minor and major galaxy diameters given in the NED database.
For each sample galaxy, we derived the dust-corrected total galaxy magnitude as

3.2. Uncertainties on Magnitudes
Analyses of the black hole–color relations can be affected by uncertainties on the bulge, disk, and total magnitudes (Section 3.1 and Appendix C), which are dominated by systematic errors. We account for four potential sources of systematic uncertainty. Uncertainties on the UV and 3.6 μm asymptotic magnitudes are introduced by dust contamination, imperfect sky background determination, and poor masking of bright sources (Bouquin et al. 2018). The disk galaxies have uncertainties due to our dust correction. There is also a need to account for uncertainties on the 3.6 μm B/T and D/T (Salo et al. 2015) used to covert the asymptotic magnitudes into disk, bulge, and total magnitudes. For the UV magnitudes, an additional source of systematic uncertainty is the derivation of the B/T and D/T (Section 3.1). The total uncertainties associated with the UV and 3.6 μm magnitudes were calculated by adding the individual contributions to the error budget in quadrature. Appendix C lists total magnitudes and associated errors for our sample galaxies. The quoted magnitudes are in the AB system unless noted otherwise.
3.3. Regression Analysis
Inherent differences in the employed statistical methods may systematically affect the derived black hole scaling relations, and it is therefore vital to explore this issue. We performed linear regression fits to  ), MBH − L3.6, and MBH − σ data using three traditional regression techniques: the bivariate correlated errors and intrinsic scatter (bces) code (Akritas & Bershady 1996), the Bayesian linear regression routine (linmix_err, Kelly 2007), and the ordinary least-squares (ols) code (Feigelson & Babu 1992); see Figures 2 and 3. The bces routine (Akritas & Bershady 1996) was implemented in our work using the python module by Nemmen et al. (2012). While the bces and linmix_err methods take into account the intrinsic scatter and uncertainties in MBH and the host galaxy properties, only the latter can process "censored" data, e.g., black hole mass upper limits. The ols routine does not account for errors; we use this method to provide
  relations independent of measurement errors.
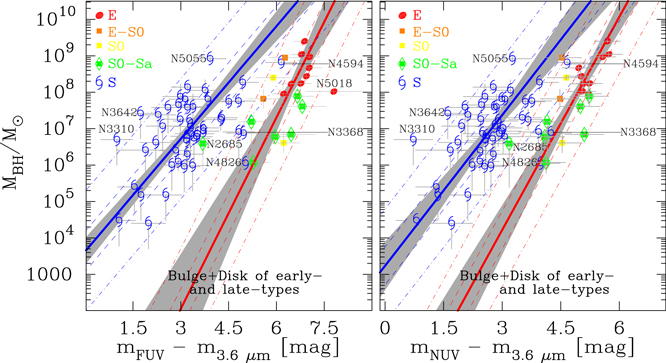
Figure 2. Correlations of directly measured SMBH masses (MBH) with the total (i.e., bulge+disk) UV−3.6 μm colors ( ) of their host galaxies.
  relations (left) and
  relations (right) for early- and late-type galaxies. Our early-type morphological bin comprises E, E-S0, S0, and S0-a. Late-type galaxies (i.e., Sa, Sb, Sc, Sd, Sm, and Irr) are plotted in blue. Early- and late-type galaxies, which are fit separately, define two distinct red and blue sequences with significantly different slopes (see Table 1). The solid red and solid blue lines are the symmetric bces bisector fits to our early- and late-type data, respectively. The shaded regions cover the associated 1σ uncertainties on these fits (Table 1). The dashed and dash–dotted lines delineate one and three times the intrinsic scatter, respectively. Errors on MBH and
  are shown, and for galaxies with black hole upper limits, we only show the lower uncertainty on MBH (see the text for further detail).
Download figure:
Standard image High-resolution image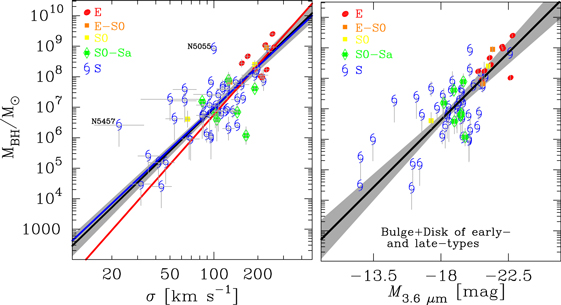
Figure 3. Similar to Figure 2, but we show here the correlations between MBH and (left panel) velocity dispersion (σ, van den Bosch 2016, his Table 2) and (right panel) total 3.6 μm absolute magnitude of our sample galaxies (M3.6μm). M3.6μm is computed using the total 3.6 μm apparent magnitudes (m3.6μm, Table C1) and distances for the galaxies from van den Bosch (2016, his Table 2). We did not fit separate linear regressions to our early- and late-type (MBH, M3.6μm) data or to the core-Sérsic and Sérsic (MBH, M3.6μm) data, see the text for more details.
Download figure:
Standard image High-resolution imageIn an effort to assess the robustness of the above linear regression fits, we additionally performed symmetric MCMC Bayesian linear regression fits for our ( ) data, which account for black hole mass upper limits (see Appendix A).
Fitting the Y = βX + α line with the bces, linmix_err, and ols codes, we present the results from the  ,
,  , and bisector regression analyses (Tables 1–3). We also present the results from our symmetric MCMC Bayesian regressions (Table 1). The
  and
and  regressions minimize the residuals around the fitted regression lines in the Y and X directions, respectively. The symmetrical bisector line bisects the
  and
and  lines. The linmix_err code does not return bisector regressions, thus we computed the the slope of the line that bisects the
  and
and  lines. Throughout this work, we focus on the relations from the symmetrical bces bisector regressions (Figures 2 and 3).
Table 1.
 Scaling Relations for Early- and Late-type Galaxies
Y = βX+α, X =  −6.5, Y = log MBH −6.5, Y = log MBH |
||||||||||
|---|---|---|---|---|---|---|---|---|---|---|
| early-type galaxies, Figure 2, left | ||||||||||
| Regression method |

|

|
Bisector | r | Δ (dex) |  (dex) (dex) |
N | |||
| α | β | α | β | α | β | |||||
| (1) | (2) | (3) | (4) | (5) | (6) | (7) | (8) | (9) | (10) | (11) |
| BCES | 8.12 ± 0.18 | 1.28 ± 0.40 | 8.30 ± 0.31 | 2.65 ± 0.82 | 8.18 ± 0.20 | 1.75 ± 0.41 | 0.61 | 0.86 | ⋯ | 18 |
| linmix_err | 8.15 ± 0.22 | 1.25 ± 0.44 | 8.34 ± 0.23 | 2.47 ± 0.84 | ⋯ | 1.71 ± 0.51 | ⋯ | ⋯ | 0.69 ± 0.20 | 18 |
| OLS | 8.10 ± 0.17 | 1.04 ± 0.30 | 8.32 ± 0.27 | 2.59 ± 0.77 | 8.17 ± 0.18 | 1.57 ± 0.27 | ⋯ | 0.87 | ⋯ | 18 |
| Symmetric | ||||||||||
| MCMC | ⋯ | ⋯ | ⋯ | ⋯ | 8.27 ± 0.25 | 2.06 ± 0.63 | ⋯ | 0.85 | ⋯ | 18 |
Y = βX+α, X =  3.3, Y = log MBH 3.3, Y = log MBH |
||||||||||
| late-type galaxies, Figure 2, left | ||||||||||

|

|
Bisector | r | Δ (dex) | (dex) |
N | ||||
| α | β | α | β | α | β | |||||
| BCES | 7.01 ± 0.13 | 0.82 ± 0.20 | 7.06 ± 0.19 | 1.35 ± 0.36 | 7.03 ± 0.14 | 1.03 ± 0.13 | 0.60 | 0.87 | ⋯ | 45 |
| linmix_err | 7.07 ± 0.13 | 0.87 ± 0.26 | 7.09 ± 0.13 | 1.59 ± 0.38 | ⋯ | 1.17 ± 0.27 | ⋯ | ⋯ | 0.69 ± 0.22 | 45 |
| OLS | 6.97 ± 0.12 | 0.62 ± 0.16 | 7.10 ± 0.22 | 1.82 ± 0.36 | 7.02 ± 0.14 | 1.05 ± 0.12 | ⋯ | 0.87 | ⋯ | 45 |
| Symmetric | ||||||||||
| MCMC | ⋯ | ⋯ | ⋯ | ⋯ | 6.95 ± 0.11 | 0.87 ± 0.17 | ⋯ | 0.81 | ⋯ | 45 |
Y = βX+α, X =  5.0, Y = log MBH 5.0, Y = log MBH |
||||||||||
| early-type galaxies, Figure 2, right | ||||||||||

|

|
Bisector | r | Δ (dex) | (dex) |
N | ||||
| α | β | α | β | α | β | |||||
| BCES | 8.07 ± 0.15 | 1.57 ± 0.36 | 8.21 ± 0.29 | 2.74 ± 0.99 | 8.12 ± 0.17 | 1.95 ± 0.28 | 0.70 | 0.72 | ⋯ | 19 |
| linmix_err | 8.10 ± 0.20 | 1.66 ± 0.55 | 8.19 ± 0.20 | 2.63 ± 0.79 | ⋯ | 2.04 ± 0.60 | ⋯ | ⋯ | 0.66 ± 0.18 | 19 |
| OLS | 8.06 ± 0.15 | 1.27 ± 0.28 | 8.18 ± 0.24 | 2.65 ± 0.68 | 8.11 ± 0.16 | 1.76 ± 0.20 | ⋯ | 0.68 | ⋯ | 19 |
| Symmetric | ||||||||||
| MCMC | ⋯ | ⋯ | ⋯ | ⋯ | 8.06 ± 0.26 | 2.33 ± 0.74 | ⋯ | 0.82 | ⋯ | 19 |
Y = βX+α, X =  2.7, Y = log MBH 2.7, Y = log MBH |
||||||||||
| late-type galaxies, Figure 2, right | ||||||||||

|

|
Bisector | r | Δ (dex) | (dex) |
N | ||||
| α | β | α | β | α | β | |||||
| BCES | 6.96 ± 0.15 | 1.24 ± 0.35 | 6.96 ± 0.17 | 1.61 ± 0.33 | 6.96 ± 0.15 | 1.38 ± 0.23 | 0.65 | 0.86 | ⋯ | 45 |
| linmix_err | 7.02 ± 0.12 | 1.08 ± 0.30 | 8.32 ± 0.27 | 1.86 ± 0.41 | ⋯ | ⋯ | ⋯ | ⋯ | 0.66 ± 0.18 | 45 |
| OLS | 6.94 ± 0.12 | 0.82 ± 0.17 | 6.94 ± 0.18 | 1.94 ± 0.35 | 6.94 ± 0.13 | 1.24 ± 0.13 | ⋯ | 0.83 | ⋯ | 45 |
| Symmetric | ||||||||||
| MCMC | ⋯ | ⋯ | ⋯ | ⋯ | 6.90 ± 0.13 | 1.35 ± 0.26 | ⋯ | 0.85 | ⋯ | 45 |
Note. Correlation between SMBH mass (MBH) and total UV−[3.6] color ( for our early- and late-type galaxies with directly measured MBH.
  = mFUV − m3.6μm,
  = mNUV − m3.6μm, where mFUV, mNUV and m3.6μm are the FUV, NUV, and m3.6μm total apparent magnitudes of the galaxies (Table C1). Column (1) lists the regression method. Columns (2) and (3) are the intercepts (α) and slopes (β) from the (
 ) regressions. Columns (4) and (5) are α and β obtained from the
  regression fits, while Columns (6) and (7) show α and β from the symmetrical bisector regressions. The preferred slopes and intercepts are highlighted in bold. Column (8) lists the Pearson correlation coefficient (r). Column (9) lists the rms scatter around the fitted bces bisector relation in the log MBH direction (Δ). Column (10) lists the intrinsic scatter (), see the text for details. Column (11) lists the number of data points contributing to the regression fits.
Download table as: ASCIITypeset image
3.4. The MBH −  Relations

In this section, we investigate the correlations between MBH and total (i.e., bulge+disk) colors  (
( ) and
) and  (=
(= ) for our sample of 67 galaxies that is comprised of 20 early-type galaxies and 47 late-type galaxies (Appendix C). In Figure 2 we plot these correlations (Table C1) with data points that are color-coded based on morphological type. The regression analyses reveal that early- and late-type galaxies define two distinct red and blue sequences with markedly different slopes in the
  diagrams, regardless of the applied regression methods (Table 1). We find that the slopes for early- and late-type galaxies are different at the ∼2σ level (Appendix A), and the significance levels for rejecting the null hypothesis that these two morphological types have the same slope are 1.7%–6.7%. We note in passing that this trend of different slopes for early- and late-type galaxies holds for the correlations between MBH and the bulge colors of the two Hubble types (
 , Dullo et al. 2020). For both early- and late-type galaxies, the
  and MBH data correlate with a Pearson correlation coefficient r ∼ 0.60 (Table 1). The
  and MBH data have Pearson correlation coefficients r ∼ 0.70 and 0.65 for early- and late-type galaxies, respectively. In the
  regression analyses, we have excluded one early-type galaxy (NGC 2685) and 2 late-type galaxies (NGC 3310 and NGC 4826) that are offset from the relations by more than three times the intrinsic scatter (Figure 2). The early-type galaxy NGC 5018 was also excluded from the
  relations, resulting in 18 early-type galaxies. These four outliers have peculiar characteristics that are discussed in Appendix B.1.
Symmetrical bces bisector fits to the ( ) and (
 ) data yield relations for early-type galaxies with slopes of 1.75 ± 0.41 and 1.95 ± 0.28, respectively (Table 1), such that MBH ∝ (LFUV,tot/L3.6,tot)−4.38±1.03 and MBH ∝ (LNUV,tot/L3.6,tot)−4.88±0.70. This is to be compared with the derived bces bisector
  and
and  relations for the late-type galaxies having shallower slopes of 1.03 ± 0.13 and 1.38 ± 0.23, such that MBH ∝ (LFUV,tot/L3.6,tot)−2.58±0.33 and MBH ∝ (LNUV,tot/L3.6,tot)−3.45±0.58.
With the assumption that the UV-to-3.6 μm luminosity ratio (LUV/L3.6) is a proxy for the sSFR, (e.g., Bouquin et al. 2018), this implies that the growth of black holes in late-type galaxies has a steeper dependence on sSFR (i.e.,  ) than early-type galaxies (
 ). That is, at a given value of the sSFR, late-type galaxies tend to have more massive black holes than early-type galaxies. The caveat of using FUV magnitudes as a proxy for the current SFR is that a significant fraction of the FUV light in ∼5% of massive early-type galaxies may come from extreme horizontal branch stars and not from young upper main-sequence stars. This phenomenon is called the "UV upturn" (e.g., Code & Welch 1979; O'Connell 1999; Yi et al. 2011). This is likely due to the rarity of very massive early-type galaxies in our sample. Nonetheless, we found that none of our early-type galaxies are UV upturns when we used the criteria given by Yi et al. (2011, their Table 1). Because the FUV band is more sensitive to the galaxy SFR than the NUV band, the
  relations are systematically shallower than the corresponding
  relations, although they are consistent with overlapping 1σ uncertainties (Table 1).
The root-mean-square (rms) scatter (Δ) around the fitted bces bisector relations in the log MBH direction is ΔFUV,early ∼ 0.86 dex, ΔFUV,late ∼ 0.87 dex, ΔNUV,early ∼ 0.72 dex, and ΔNUV,late ∼ 0.86 dex. We report intrinsic scatters () for our  relations as derived by linmix_err to be FUV,early ∼ 0.69 ± 0.20, FUV,late ∼ 0.69 ± 0.22, NUV,early ∼ 0.66 ± 018, and NUV,late ∼ 0.66 ± 0.18.
As noted previously, the linmix_err code and MCMC Bayesian analysis—which account for the 24 galaxies (22 late-type galaxies and 2 early-type galaxies) with MBH upper limits—yield  relations consistent with the bces regression analyses (Table 1). Nonetheless, we checked for a potential bias for the late-type galaxies due to the inclusion of MBH upper limits by rerunning the bces bisector regression analysis on the 23 (=45–22) late-type galaxies with more securely measured MBH. We find that the slopes, intercepts, and Δ of the
  relations are only weakly affected by the exclusion of MBH upper limits.6
Including the upper limits in the black hole scaling relations is useful (Gültekin et al. 2009) because they also follow the M − σ relation that is traced by galaxies with more securely measured MBH (Figure 3).
relations are only weakly affected by the exclusion of MBH upper limits.6
Including the upper limits in the black hole scaling relations is useful (Gültekin et al. 2009) because they also follow the M − σ relation that is traced by galaxies with more securely measured MBH (Figure 3).
We can compare our work to that of Terrazas et al. (2017, their Figures 1 and 2), who used SFRs determined based on IRAS far-infrared imaging and reported an inverse correlation between sSFR and SMBH mass for 91 galaxies with measured black hole masses. Although they did not separate the galaxies into late- and early-types, their full sample seems to follow a single MBH − sSFR relation with no break. This contradicts our results. To explain this discrepancy, we split the galaxies in Terrazas et al. (2017) by morphology and find that their late-type galaxies (which constitute one-third of the full sample) reside at the low-mass end of their MBH−sSFR relation and span very small ranges in SMBH mass (4 × 10⁶ ≲ MBH/M⊙ ≲ 108) and in sSFR (10−11 ≲ sSFR/yr−1 ≲ 8 × 10⁻⁹). This is inadequate to establish the blue  sequence (Figure 2). Furthermore, we note that the far-IR (FIR) flux may underestimate the actual SFR for low-mass late-type galaxies because most of the UV photons of these galaxies are unobscured by dust and are thus not reprocessed to FIR wavelengths (Catalán-Torrecilla et al. 2015). We also find that the Terrazas et al. (2017) early-type MBH − sSFR relation has more scatter than ours. We suspect that this may be due to a variable contamination of the IRAS FIR emissions in massive galaxies by the AGN7
that heats the surrounding dust. While the dusty AGN in some massive galaxies might led to an increase in the SFR values based on FIR luminosities (e.g., Catalán-Torrecilla et al. 2015; Toba et al. 2017), star formation activities are likely the dominant contributor to the SFR values reported by Terrazas et al. (2017) because AGN contamination is mainly responsible for the larger scatter observed in their MBH − sSFR relation.
sequence (Figure 2). Furthermore, we note that the far-IR (FIR) flux may underestimate the actual SFR for low-mass late-type galaxies because most of the UV photons of these galaxies are unobscured by dust and are thus not reprocessed to FIR wavelengths (Catalán-Torrecilla et al. 2015). We also find that the Terrazas et al. (2017) early-type MBH − sSFR relation has more scatter than ours. We suspect that this may be due to a variable contamination of the IRAS FIR emissions in massive galaxies by the AGN7
that heats the surrounding dust. While the dusty AGN in some massive galaxies might led to an increase in the SFR values based on FIR luminosities (e.g., Catalán-Torrecilla et al. 2015; Toba et al. 2017), star formation activities are likely the dominant contributor to the SFR values reported by Terrazas et al. (2017) because AGN contamination is mainly responsible for the larger scatter observed in their MBH − sSFR relation.
3.5. MBH − σ and MBH − L Relations
In Figure 2 we have shown for the first time, to our knowledge, a correlation between SMBH mass and total (i.e., bulge+disk) colors for early- and late-type galaxies. For this correlation to be evident, it is important that the color is determined using a wide wavelength baseline. In this section, we present correlations between MBH and velocity dispersion (σ) and 3.6 μm total luminosity (L3.6,tot) for the same galaxy sample to allow a direct statistical comparison with the  relations (Figure 3 and Table 2). Assuming a 10% uncertainty8
on σ, the bces bisector regression yields MBH − σ relations with slopes 5.42 ± 0.90, 4.49 ± 0.48, and 4.65 ± 0.35 for the early-type galaxies and late-type galaxies, and for the full ensemble. These relations are in good agreement with each other within their 1σ uncertainties. The late-type galaxies NGC 5055 and NGC 5457, which are the most deviant outliers in the MBH − σ diagram, were excluded. The unification of early- and late-type galaxies in the MBH − σ diagram has been reported before (e.g., Beifiori et al. 2012; Graham & Scott 2013; van den Bosch 2016; Dullo et al. 2020, submitted). The MBH − σ relations (Table 2) are consistent with those from Gültekin et al. (2009), Beifiori et al. (2012), McConnell & Ma (2013), Kormendy & Ho (2013), and Graham & Scott (2013).9
relations (Figure 3 and Table 2). Assuming a 10% uncertainty8
on σ, the bces bisector regression yields MBH − σ relations with slopes 5.42 ± 0.90, 4.49 ± 0.48, and 4.65 ± 0.35 for the early-type galaxies and late-type galaxies, and for the full ensemble. These relations are in good agreement with each other within their 1σ uncertainties. The late-type galaxies NGC 5055 and NGC 5457, which are the most deviant outliers in the MBH − σ diagram, were excluded. The unification of early- and late-type galaxies in the MBH − σ diagram has been reported before (e.g., Beifiori et al. 2012; Graham & Scott 2013; van den Bosch 2016; Dullo et al. 2020, submitted). The MBH − σ relations (Table 2) are consistent with those from Gültekin et al. (2009), Beifiori et al. (2012), McConnell & Ma (2013), Kormendy & Ho (2013), and Graham & Scott (2013).9
Table 2. MBH − σ Relation
| Y = βX+α, X = log σ−2.2, Y = log MBH (early-type, Figure 3, left) | ||||||||||
|---|---|---|---|---|---|---|---|---|---|---|
| Regression method |

|

|
Bisector | r | Δ (dex) | (dex) |
N | |||
| α | β | α | β | α | β | |||||
| (1) | (2) | (3) | (4) | (5) | (6) | (7) | (8) | (9) | (10) | (11) |
| bces | 7.84 ± 0.14 | 4.33 ± 0.80 | 7.81 ± 0.23 | 7.10 ± 1.58 | 7.84 ± 0.16 | 5.42 ± 0.90 | 0.72 | 0.67 | 0.70 ± 0.16 | 20 |
| Y = βX+α, X = log σ−2.0, Y = log MBH (late-type, Figure 3, left) | ||||||||||

|

|
Bisector | r | Δ (dex) | (dex) |
N | ||||
| α | β | α | β | α | β | |||||
| bces | 6.98 ± 0.10 | 4.00 ± 0.53 | 7.00 ± 0.11 | 5.00 ± 0.99 | 6.98 ± 0.10 | 4.49 ± 0.48 | 0.75 | 0.70 | 0.63 ± 0.10 | 45 |
| Y = βX+α, X = log σ−2.0, Y = log MBH (all galaxies, Figure 3, left) | ||||||||||

|

|
Bisector | r | Δ (dex) | (dex) |
N | ||||
| α | β | α | β | α | β | |||||
| bces | 6.99 ± 0.09 | 4.23 ± 0.40 | 6.92 ± 0.10 | 5.39 ± 0.72 | 6.96 ± 0.09 | 4.65 ± 0.35 | 0.78 | 0.68 | 0.62 ± 0.07 | 65 |
Note. Similar to Table 1, but here showing linear regression analyses of the correlation between SMBH mass (MBH) and velocity dispersion (σ).
Download table as: ASCIITypeset image
To determine the MBH − L3.6,tot relation, we converted the inclination and dust-corrected 3.6 μm total apparent magnitudes into absolute magnitudes (M3.6,tot, Appendix C) using distances given in van den Bosch (2016). The bces bisector MBH − L3.6,tot relation for the full sample of 67 galaxies was performed without accounting for the error on M3.6,tot, yielding  (Figure 3 and Table 3). Graham & Scott (2013) reported two distinct MBH − L relations for the bulges of Sérsic galaxies (
 ) and core-Sérsic galaxies (
 ). Because only 7 galaxies were identified as core-Sérsic galaxies (see Figure 4), we refrained from separating the galaxies into Sérsic and core-Sérsic galaxies in the MBH − L3.6,tot diagram.
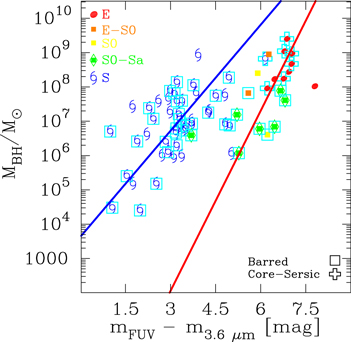
Figure 4. Similar to Figure 2(a), but here we also show the host galaxy properties. Barred galaxies are enclosed in boxes. Seven core-Sérsic galaxies (6 Es + 1 S) with partially depleted cores published in the literature are enclosed in crosses (see Section 4.2).
Download figure:
Standard image High-resolution imageTable 3. MBH − L3.6,tot Relation
| Y = βX+α, X = M3.6,tot +18.5, Y = log MBH (all galaxies, Figure 3, right) | ||||||||||
|---|---|---|---|---|---|---|---|---|---|---|
| Regression method |

|

|
Bisector | r | Δ (dex) | (dex) |
N | |||
| α | β | α | β | α | β | |||||
| (1) | (2) | (3) | (4) | (5) | (6) | (7) | (8) | (9) | (10) | (11) |
| bces | 6.96 ± 0.11 | −0.37 ± 0.06 | 6.80 ± 0.17 | −0.65 ± 0.12 | 6.88 ± 0.12 | −0.49 ± 0.06 | −0.66 | 0.84 | 0.69 ± 0.09 | 67 |
Note. Similar to Table 1, but here showing linear regression analyses of the correlation between the SMBH masses (MBH) and the 3.6 μm total absolute magnitude of the galaxies (M3.6,tot), see the text for details.
Download table as: ASCIITypeset image
4. Discussion
4.1. Comparison Between the , MBH − σ and MBH − L Relations

Because a different number of galaxies was used to define the  , MBH − σ and MBH − L relations, a direct comparison of the strength and scatter of the relations is difficult. Nonetheless, the correlation between the color
  and black hole mass MBH (r ∼ 0.60–0.70, see Table 1) is slightly weaker than that between the stellar velocity dispersion σ and MBH (r ∼ 0.72–0.78, Table 2). These two relations have comparable intrinsic scatter (see Tables 1 and 2). In terms of scatter in the log MBH direction, the
  relations typically have 5%–27% more scatter (i.e., Δ ∼ 0.72–0.87 dex) than the MBH − σ relations (Δ ∼ 0.68–0.70 dex). The MBH − σ relation appears to be the most fundamental SMBH scaling relation. However, the MBH − σ relations for late- and early-type galaxies are not notably offset from each other. This contrasts with the formation models of galaxies, which predict that the SMBH growth in the two Hubble types is completely different (see Section 4.5). Furthermore, Dullo et al. (2020, submitted) showed that the MBH − σ relation tends to underpredict the actual black hole masses for the most massive galaxies with M* ≳ 1012M⊙. In contrast, the
  relations are in accordance with galaxy formation models (Section 4.5).
In the comparison between the  and MBH − L relations, these two relations display a similar level of strength and vertical scatter (Table 3, r ∼ 0.60–0.70 and Δ ∼ 0.72–0.87 dex for
  and r ∼ −0.66, and Δ ∼ 0.84 dex for MBH − L3.6,tot). In passing we note that the existence of the MBH − L relation coupled with the red sequence and blue cloud traced by early- and late-type galaxies in the color–magnitude diagram does not necessitate a correlation between the black hole mass and galaxy color.
For comparison, our  relation for the 47 late-type galaxies is stronger (r ∼ 0.60–0.65, and Δ ∼ 0.87 dex) than the MBH − M*,tot relation based on 3.6 μm data by Davis et al. (2018) for their sample of 40 late-type galaxies (r ∼ 0.47 and Δ ∼ 0.79 dex).
4.2. Core-Sérsic versus Sérsic
As noted in the Introduction, the SMBH scaling relations may differ depending on the galaxy core structure (i.e., core-Sérsic versus Sérsic type). We identify seven core-Sérsic galaxies (6 Es + 1 S) in our sample with partially depleted cores published in the literature: NGC 1052 (Lauer et al. 2007), NGC 3608, NGC 4278, and NGC 4472 (Dullo & Graham 2012, 2014), and NGC 4374, NGC 4594, and NGC 5846 (Graham & Scott 2013). They are among the reddest ( ) galaxies in our sample with massive SMBHs (MBH ≳ 108M⊙), Figure 4. While structural analyses of high-resolution Hubble Space Telescope images are needed to identify a partially depleted core (or lack thereof) in the remaining sample galaxies (e.g., Dullo & Graham 2013, 2014; Dullo et al. 2016, 2017, 2018, the majority (∼80%) of our spiral galaxies have σ ≲ 140 km s−1, and they are likely Sérsic galaxies with no partially depleted cores (e.g., Dullo & Graham 2012, 2013, 2014; Dullo et al. 2017). For early-type galaxies, we did not find bends or offsets from the
  relations because of core-Sérsic or Sérsic galaxies (Figure 4).
4.3. Red, Intermediate, and Blue Sequences
To locate our galaxies in color–color diagrams, we used the classification by Bouquin et al. (2018, their Section 4.4). These authors compared the FUV−NUV and NUV–[3.6] colors to separate their galaxies into red, intermediate, and blue sequences. Figure 5 shows excellent coincidence between the red and blue  early- and late-type morphological sequences (Sections 3.4) and the canonical color–color relation (red/intermediate) and blue sequences, respectively, with only three exceptions (NGC 2685, NGC 4245, and NGC 4594). The case of NGC 2685 was discussed in Appendix B.1.4. NGC 4245 is a barred S0-Sa galaxy with a prominent ring (Treuthardt et al. 2007). The spiral Sa NGC 4594 (also referred to as the Sombrero Galaxy) exhibits properties similar to massive early-type galaxies. Spitler et al. (2008) found that the number of blue globular clusters in NGC 4594 is comparable to massive early-type galaxies. Moreover, Jardel et al. (2011) noted that the galaxy dark matter density and core radius resemble those expected for early-type galaxies with massive bulges. It is the only red-sequence spiral in our sample (Bouquin et al. 2018), which is also unique in being the only core-Sérsic late-type galaxy in the sample. Interestingly, Figure 5 reveals that all the intermediate-sequence galaxies (Bouquin et al. 2018) reside to the left of the
  relation that is defined by early-type galaxies.
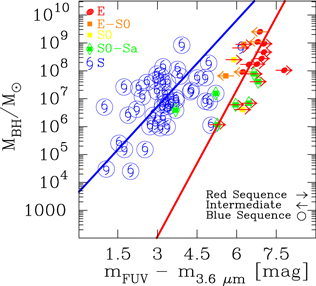
Figure 5. Similar to Figure 2, but here comparing the  red and blue sequences and the color–color red/intermediate and blue sequences. The color–color relation red- and intermediate-sequence galaxies (Bouquin et al. 2018, their Section 4.4) are marked by rightward- and leftward-pointing arrows, respectively. Blue-sequence galaxies are enclosed in circles.
Download figure:
Standard image High-resolution image4.4. Predicting SMBH Masses Using the Relations

It is of interest to assess the robustness of black hole masses that are estimated using the  and
and  relations found in this work. We do so using literature FUV, NUV, and 3.6 μm magnitudes for a selected sample of 11 galaxies with direct SMBH masses that are not in our sample (see Table 4). These 11 galaxies were not included in the main sample because we endeavor to establish the
  relations using homogeneously determined UV and 3.6 μm magnitudes. In this way, the observed trends in the
  diagrams (Figure 2) cannot be attributed to differences in methods and/or data sources. We use the black hole mass measurement of NGC 205 by Nguyen et al. (2019), and for the remaining 10 galaxies, the SMBH masses are taken from van den Bosch (2016). Of the 11 galaxies, 9 are in common between Jeong et al. (2009) and Savorgnan & Graham (2016). Jeong et al. (2009, their Table 1) published total apparent FUV and NUV magnitudes derived from growth curves for the galaxies, while Savorgnan & Graham (2016, their Table 2) presented their 3.6 μm galaxy apparent magnitudes10
that were computed using their best-fitting structural parameters. We also included the low-mass elliptical galaxy NGC 205 and the Seyfert SAm bulgeless galaxy NGC 4395 (Filippenko & Ho 2003; Peterson et al. 2005). NGC 205 potentially harbors the lowest central black hole mass measured for any galaxy to date (Nguyen et al. 2019), and NGC 4395 is known to be an outlier from the MBH − σ diagrams (e.g., Davis et al. 2017). For NGC 205, we use the UV and 3.6 μm magnitudes from Gil de Paz et al. (2007) and Marleau et al. (2006), respectively. For NGC 4395, the total UV and 3.6 μm magnitudes are from Dale et al. (2009) and Lee et al. (2011); a caveat here is that these magnitudes are not corrected for internal dust attenuation.
diagrams (Figure 2) cannot be attributed to differences in methods and/or data sources. We use the black hole mass measurement of NGC 205 by Nguyen et al. (2019), and for the remaining 10 galaxies, the SMBH masses are taken from van den Bosch (2016). Of the 11 galaxies, 9 are in common between Jeong et al. (2009) and Savorgnan & Graham (2016). Jeong et al. (2009, their Table 1) published total apparent FUV and NUV magnitudes derived from growth curves for the galaxies, while Savorgnan & Graham (2016, their Table 2) presented their 3.6 μm galaxy apparent magnitudes10
that were computed using their best-fitting structural parameters. We also included the low-mass elliptical galaxy NGC 205 and the Seyfert SAm bulgeless galaxy NGC 4395 (Filippenko & Ho 2003; Peterson et al. 2005). NGC 205 potentially harbors the lowest central black hole mass measured for any galaxy to date (Nguyen et al. 2019), and NGC 4395 is known to be an outlier from the MBH − σ diagrams (e.g., Davis et al. 2017). For NGC 205, we use the UV and 3.6 μm magnitudes from Gil de Paz et al. (2007) and Marleau et al. (2006), respectively. For NGC 4395, the total UV and 3.6 μm magnitudes are from Dale et al. (2009) and Lee et al. (2011); a caveat here is that these magnitudes are not corrected for internal dust attenuation.
Table 4. SMBH Masses
| Galaxy | Type |

|
log (MBH/M⊙) | log (MBH/M⊙) |
|---|---|---|---|---|
| (AB mag) | (directly measured) | (predicted) | ||
| (FUV/NUV) | (FUV/NUV) | |||
| (1) | (2) | (3) | (4) | (5) |
| NGC 0205 | E5 pec | 4.61/2.67 |

|
4.85/3.58 |
| NGC 0524 | SA0 | 7.30/5.48 |

|
9.68/9.02 |
| NGC 0821 | E6 | 7.02/4.69 |

|
9.13/7.64 |
| NGC 1023 | SB0 | 6.64/5.01 |

|
8.39/8.20 |
| NGC 4395 | SAm | 1.49/1.37 |

|
5.17/5.29 |
| NGC 4459 | SA0 | 6.56/5.03 |

|
8.24/8.23 |
| NGC 4473 | E5 | 6.80/4.93 |

|
8.71/8.06 |
| NGC 4552 | E | 6.24/5.33 |

|
7.61/8.76 |
| NGC 4564 | E6 | 6.34/4.77 |

|
7.91/7.78 |
| NGC 4621 | E5 | 7.18/5.78 |

|
9.41/9.55 |
| NGC 5845 | E | 6.38/5.30 |

|
7.89/8.71 |
Note. Column (1) lists the galaxy name. Column (2) lists the morphological type from the NED database. Column (3) lists the total FUV–[3.6] and NUV–[3.6] colors ( and
and  ). Columns (4) list the directly measured SMBH masses. Column (5) lists black hole masses predicted using the
  and
and  relations (Table 1) and the appropriate colors given in Column (3). We assign a typical uncertainty of 0.85 dex to log (MBH) for these predicted black hole masses.
Download table as: ASCIITypeset image
Before applying our  relations to estimate MBH, we homogenize the FUV, NUV, and 3.6 μm data from the literature by comparing our magnitudes with those from Jeong et al. (2009) and Savorgnan & Graham (2016) for galaxies in common with them. We find that compared to our magnitudes, the Jeong et al. (2009) total FUV and NUV magnitudes are fainter by typically 0.52 mag, while the galaxy magnitudes from Savorgnan & Graham (2016) are brighter by typically 0.18 mag. Having applied these corrections (i.e., mUV = mUV,Jeo − 0.52 and m3.6 = m3.6,Sav + 0.18) for the 9 early-type galaxies, we computed the
  and
and  colors listed in Table 4.
Figure 6 reveals good agreement between the directly measured MBH and predicted MBH determined using  and
and  relations for the 10 galaxies in Table 4. On average,
  and ∼0.32 dex ± 0.29 dex (NUV). In Figure 6 the direct black hole mass appears to correlate better with that predicted using the NUV color than using the FUV color, and for the massive early-type galaxies, this may be due to contributions to the FUV flux from the extreme horizontal branch stars (see Section 3.4). The approach of using homogenized galaxy colors obtained through different methods may introduce some systematic errors in the determination of MBH. We caution that when the
  relations are used to predict black hole masses, one should use FUV, NUV, and 3.6 μm magnitudes that are obtained in a homogeneous way. Furthermore, the
  relations should not be used to predict black hole masses in galaxies that are highly inclined (e.g., edge-on) and obscured with dust.
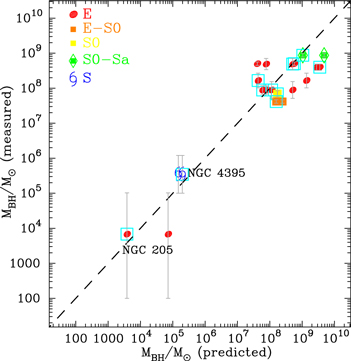
Figure 6. Comparison between SMBH masses predicted using our MBH −  and MBH −
  relations (Table 1) and those determined dynamically (van den Bosch 2016; Nguyen et al. 2019) for a selected sample of 11 galaxies that are not in our sample (see Table C1). SMBH masses predicted based on the MBH −
  relations are enclosed in boxes.
Download figure:
Standard image High-resolution imageAs noted in the introduction, a clear benefit of the  relation is its applicability to early- and late-type galaxies, including those with low central velocity dispersions (σ ≲ 100 km s−1) and with small or no bulges. Moreover, photometry has the advantage of being cheaper than spectroscopy. Using our relations (Table 1) together with galaxy colors derived from the Bouquin et al. (2018, their Table 1) asymptotic FUV, NUV, and 3.6 μm magnitudes, we tentatively predict black hole masses in a sample of 1382 GALEX/S4G galaxies (Table D1) with no measured black hole masses, see Appendix D. We show that late-type galaxies with
  AB mag or
  AB mag may harbor IMBHs (MBH ∼ 100–105M⊙). Similarly, early-type galaxies with
  AB mag or
  AB mag are potential IMBH hosts. While Sloan Digital Sky Survey (SDSS) velocity dispersion measurements are available for hundreds of thousands of galaxies and one can use them together with the MBH − σ relation to estimate black hole masses, as cautioned by the SDSS Data Release11
12 (Alam et al. 2015), velocity dispersion values lower than 100 km s−1 reported by SDSS are below the resolution limit of the SDSS spectrograph and are regarded as unreliable. Note that galaxies with σ ≲ 100 km s−1 are expected to have low stellar masses (M* ≲ 2 × 10¹⁰M⊙), and such galaxies make up a significant fraction of the SDSS galaxy sample (Chang et al. 2015, see their Figure 9). In addition, the SDSS spectra measure the light within a fixed aperture of radius 1
AB mag are potential IMBH hosts. While Sloan Digital Sky Survey (SDSS) velocity dispersion measurements are available for hundreds of thousands of galaxies and one can use them together with the MBH − σ relation to estimate black hole masses, as cautioned by the SDSS Data Release11
12 (Alam et al. 2015), velocity dispersion values lower than 100 km s−1 reported by SDSS are below the resolution limit of the SDSS spectrograph and are regarded as unreliable. Note that galaxies with σ ≲ 100 km s−1 are expected to have low stellar masses (M* ≲ 2 × 10¹⁰M⊙), and such galaxies make up a significant fraction of the SDSS galaxy sample (Chang et al. 2015, see their Figure 9). In addition, the SDSS spectra measure the light within a fixed aperture of radius 1 5, thus the SDSS velocity dispersion values of more distant galaxies can be systematically lower than those of similar nearby galaxies.
4.5. The Correlation as Evidence for the Coevolution of SMBHs and Galaxies

By morphologically splitting the sample galaxies, we have demonstrated that late-type hosts do not correlate with SMBHs in the same manner as early-type hosts (Table 1). This can be reconciled very well with the prediction that early- and late-type galaxies have fundamentally different formation histories (e.g., White & Rees 1978; Khochfar & Burkert 2001; Steinmetz & Navarro 2002; Kauffmann et al. 2003b; Kormendy & Kennicutt 2004; Schawinski et al. 2010, 2014; Dullo & Graham 2014; Tonini et al. 2016; Davis et al. 2018; Dullo et al. 2019). For example, the red and blue  relations are such that MBH,early-type ∝ (LFUV,tot/L3.6,tot)−4.38 and MBH,late-type ∝ (LFUV,tot/L3.6,tot)−2.58. Given that LUV/L3.6 is a good proxy for the sSFR, (Bouquin et al. 2018. their Appendix B), this therefore implies that both early- and late-type galaxies exhibit log-linear inverse correlations between MBH and sSFR, the latter having a steeper dependence on sSFR than the former (see Table 1 and Figure 2).
A correlation between MBH and sSFR is expected. Observations have shown that bright quasars and local Seyferts tend to reside in strong starburst galaxies or in galaxies with ongoing star formation (e.g., Sanders et al. 1988; Kauffmann et al. 2003a; Alexander et al. 2005; Lutz et al. 2008; Netzer 2009; Wild et al. 2010; Rosario et al. 2012; Barrows et al. 2017; Yang et al. 2017). Other findings lending further support to the link between star formation and SMBH growth are the correlation between black hole accretion rate and host galaxy SFR (e.g., Heckman et al. 2004; Merloni et al. 2004; Hopkins & Quataert 2010; Chen et al. 2013; Madau & Dickinson 2014; Sijacki et al. 2015; Yang et al. 2017), the inverse correlation between sSFR and specific SMBH mass (Terrazas et al. 2017), and the trend between SMBH mass and host galaxy star formation histories over cosmic time (e.g., Martín-Navarro et al. 2018; van Son et al. 2019).
Within the self-regulated SMBH growth model, the correlation between SMBH masses and the host galaxy properties (e.g., stellar luminosity, McLure & Dunlop 2002; Marconi & Hunt 2003) is interpreted as reflecting a link between the growth of SMBHs and star formation events in the host (Silk & Rees 1998; Fabian 1999; King 2003; Di Matteo et al. 2005; Murray et al. 2005; Springel et al. 2005; Croton et al. 2006; Hopkins et al. 2006; Schawinski et al. 2006; Cattaneo et al. 2009; Weinberger et al. 2017). In this scenario, the same cold gas reservoir that fuels the AGN/quasar feeds starburst events. The energy or momentum released by the AGN/quasar can heat the interstellar medium and cause the expulsion of gas from the host galaxy, shutting off star formation and halting accretion onto the SMBH. However, whether AGN accretion and star formation are precisely coincidental is unclear (e.g., Ho 2005).
We (see also Dullo et al. 2020, submitted) argue that the significantly different  relations for early- and late-type galaxies (i.e., the
  red and blue sequences) suggest that the two Hubble types follow two distinct channels of SMBH growth: the former is driven by a major merger, and the latter involves (major merger) free processes (see Hopkins & Hernquist 2009). This broadly agrees with Schawinski et al. (2010, 2014).
The standard cosmological formation paradigm is that SMBHs in early-type galaxies are built up during the period of rapid galaxy growth at high redshift (z ∼ 2–5) when the major gas-rich mergers of disk galaxies (e.g., Toomre & Toomre 1972; White & Rees 1978) drive gas infall into the nuclear regions of the newly formed merger remnant, leading to starburst events and AGN accretion processes (e.g., Barnes & Hernquist 1991, 1996; Naab et al. 2006a; Hopkins & Quataert 2010; Knapen et al. 2015). Accretion onto more massive SMBHs triggers stronger AGN feedback, which is efficient at quenching star formation rapidly. The position of an early-type galaxy on the  red sequence is therefore dictated by the complex interplay between the details of its SMBH growth, efficiency of AGN feedback, regulated star formation histories, and major merger histories; this is not set by simple hierarchical merging (Peng 2007; Jahnke & Macciò 2011).
Massive early-type galaxies (i.e., total stellar mass M*,k ∼ 8 × 10¹⁰M⊙–1012M⊙) with MBH ≳ 108M⊙ and  mag, at the high-mass end of the
  red sequence (Figure 2, Section 4.3), are consistent with the scenario where a (gas-rich) major merger at high redshift drives intense bursts of star formation, efficient SMBH growth, and ensuing quenching of star formation by strong AGN feedback on short timescales (e.g., Thomas et al. 2005, 2010; de La Rosa et al. 2011; McDermid et al. 2015; Segers et al. 2016). This is accompanied by a few (0.5–2) successive gas-poor (dry) major mergers since z ∼ 1.5–2 (e.g., Bell et al. 2004, 2006; Khochfar & Silk 2009; Dullo & Graham 2012, 2013, 2014; Man et al. 2012; Rodriguez-Gomez et al. 2015), involving low level star formation12
(i.e., "red but not strictly dead," see de La Rosa et al. 2011; Davis et al. 2019; Habouzit et al. 2019) detected by the GALEX FUV and NUV detectors (e.g., Gil de Paz et al. 2007; Bouquin et al. 2018). The bulk of these objects are core-Sérsic elliptical galaxies, a fraction of which may gradually grow stellar disk structures and transform into massive lenticular galaxies (Dullo & Graham 2013; Graham 2013; Dullo 2014; Graham et al. 2015; de la Rosa et al. 2016).
red sequence (Figure 2, Section 4.3), are consistent with the scenario where a (gas-rich) major merger at high redshift drives intense bursts of star formation, efficient SMBH growth, and ensuing quenching of star formation by strong AGN feedback on short timescales (e.g., Thomas et al. 2005, 2010; de La Rosa et al. 2011; McDermid et al. 2015; Segers et al. 2016). This is accompanied by a few (0.5–2) successive gas-poor (dry) major mergers since z ∼ 1.5–2 (e.g., Bell et al. 2004, 2006; Khochfar & Silk 2009; Dullo & Graham 2012, 2013, 2014; Man et al. 2012; Rodriguez-Gomez et al. 2015), involving low level star formation12
(i.e., "red but not strictly dead," see de La Rosa et al. 2011; Davis et al. 2019; Habouzit et al. 2019) detected by the GALEX FUV and NUV detectors (e.g., Gil de Paz et al. 2007; Bouquin et al. 2018). The bulk of these objects are core-Sérsic elliptical galaxies, a fraction of which may gradually grow stellar disk structures and transform into massive lenticular galaxies (Dullo & Graham 2013; Graham 2013; Dullo 2014; Graham et al. 2015; de la Rosa et al. 2016).
As for the less massive (Sérsic) early-type galaxies (M*,k ∼ 1010M⊙ − 2 × 10¹¹M⊙) with lower SMBH masses (106M⊙ ≲ MBH ≲ 108M⊙) and  mag (Figure 2, Section 4.3), they likely grow primarily via gas-rich (wet) major mergers and form their stellar populations over an extended period of time (Thomas et al. 2005, 2010; de La Rosa et al. 2011; McDermid et al. 2015). Our findings disfavor a scenario where Sérsic early-type galaxies with intermediate colors are late-type galaxies quenching star formation and moving away from the
  blue sequence. Collectively, core-Sérsic and Sérsic early-type galaxies define a red sequence in the
  diagram. Lacking the most luminous and massive BCGs with M*,k ≳ 1012M⊙ in our sample, we note that our
  relation is not constrained at the highest-mass end. Becausesuch galaxies are generally expected to have negligible star formation (Dullo 2019), the
  relations, the
  in particular, may not apply to them. Our interpretation of the assembly of the red sequence for early-type galaxies is in accordance with the "downsizing" scenario, where more massive galaxies form stars earlier and over a shorter timescale than less massive galaxies (e.g., Cowie et al. 1996; Brinchmann & Ellis 2000; Cattaneo et al. 2008; Pérez-González et al. 2008; Pannella et al. 2009).
The (major merger) free scenario—secular processes and minor mergers—may be naturally consistent with the observed late-type  blue sequence (Figure 2, Section 4.3) and dynamically cold stellar disks of late-type galaxies. Recently, Martin et al. (2018a) reported that massive SMBHs in disk galaxies can grow primarily via secular processes with small contributions (i.e., only 35% of the SMBH mass) from mergers. We tentatively hypothesize that secular-driven processes involving nonaxisymmetric stellar structures, such as bars and spiral arms, can trigger a large inflow of gas from the large-scale disk into nuclear regions of late-type galaxies, slowly feeding SMBHs and fueling star formation (e.g., Kormendy 1993, 2013; Kormendy & Kennicutt 2004; Fisher & Drory 2008; Leitner 2012; Cisternas et al. 2013; Tonini et al. 2016; Dullo et al. 2019). Barred galaxies make up the bulk (∼62%) of the late-type galaxies in our sample (Figure 4). In addition, gas-rich minor mergers have been suggested in the literature to trigger enhanced star formation and SMBH growth in late-type galaxies without destroying the disks (Simmons et al. 2013, 2017; Kaviraj 2014a, 2014b; Martin et al. 2018a, 2018b). The question remains, however, whether pure (major merger) free processes could be the main mechanism for the formation of late-type galaxies with massive bulges and high-velocity dispersion, as in the case of NGC 4594.
As noted above, we find that core-Sérsic13 and Sérsic galaxies collectively define a single early- or late-type morphology sequence, in agreement with the conclusions by Sahu et al. (2019a), Dullo (2019), and Dullo et al. (2020, submitted). Moreover, Savorgnan et al. (2016) reported a blue spiral galaxy MBH − M*,bulge sequence using their sample of 17 spiral galaxies (see also Davis et al. 2018, their Section 2.2).
We remark that bulgeless spirals and spiral galaxies with classical bulges or pseudo-bulges all follow the blue late-type  relations (Figure 2). Pseudo-bulges are typically hosted by late-type galaxies and a few early-type galaxies, while classical bulges are generally associated with early-type galaxies and massive late-type galaxies. A key point to note here is that the relatively high sSFR for pseudo-bulges coupled with the steeper dependence of SMBH masses on sSFRs for late-type galaxies likely explain why pseudo-bulges seem to obey a different MBH − σ relation than classical bulges (e.g., Kormendy & Ho 2013). This also explains why bulgeless spirals and low-mass spirals are offset from the MBH − LBulge, MBH − M*,Bulge, and MBH − σ relations defined by the massive early- and late-type galaxies, as reported in the literature (e.g., Greene et al. 2008, 2010, 2016; Baldassare et al. 2017, Caglar et al. 2020).
5. Conclusions
Using a sample of 67 GALEX/S4G galaxies with directly measured SMBH masses (MBH), comprised of 20 early-type galaxies and 47 late-type galaxies, we establish for the first time a correlation between (MBH) and the host galaxy total (i.e., bulge+disk) UV−[3.6] color ( ). More massive SMBHs are hosted by galaxies with redder colors. The GALEX FUV/NUV and S4G Spitzer 3.6 μm asymptotic magnitudes of the sample galaxies determined in a homogeneous manner (Bouquin et al. 2018) along with their 3.6 μm multicomponent decomposition by Salo et al. (2015) were used to derive dust-corrected total (bulge+disk) magnitudes in FUV, NUV, and 3.6 μm bands. We provide these magnitudes in Table C1.
We fit our ( ) data set using several statistical techniques, focusing on the symmetric BCES bisector regressions. Our key findings are as follows.
(1) Investigating the nature of the  relations, our results show that early-type galaxies define a red sequence in the
  diagrams that is different from the late-type blue sequence. We found a strong tendency for the galaxies that lie on the red/blue
  morphological sequences to also be on the (red plus intermediate)/blue sequences in the canonical color–color relation (see Section 4.3 and Figure 5).
(2) The  and
and  relations for early-type galaxies have slopes of 1.75 ± 0.41 and 1.95 ± 0.28, respectively, whereas for late-type galaxies, the slopes are substantially shallower, i.e., 1.03 ± 0.13 and 1.38 ± 0.23. The early- and late-type
  relations have rms scatters (Δ) in the log MBH direction of ΔUV,early ∼ 0.72–0.86 dex and ΔUV,late ∼ 0.86 dex and Pearson correlation coefficients (r) of rearly ∼ 0.61–0.70 and rlate ∼ 0.60–0.65.
(3) Given LUV,tot/L3.6,tot is a good proxy for sSFR, it follows that both early- and late-type galaxies exhibit log-linear inverse correlations between MBH and sSFR, the latter having a steeper dependence on sSFR (i.e.,  ) than the former (
 ). This suggests different channels for SMBH growth in early- and late-type galaxies.
(4) We have compared the  relations with the MBH − σ and MBH − L3.6,tot relations for our sample galaxies. While the
  relations are marginally weaker (r ∼ 0.60–0.70) and typically have 5%–27% more scatter than the MBH − σ relations (r ∼ 0.72–0.78), the former potentially constrains SMBH-galaxy coevolution models that predict different SMBH growth for different morphologies. In contrast, the M − σ relations for late- and early-type galaxies are similar. The
  and MBH − L3.6,tot relations display a similar level of strength and vertical scatter.
(5) We did not detect departures (bends or offsets) from the  relations because of core-Sérsic or Sérsic galaxies. However, we cannot firmly rule out the presence of such substructures because our sample does not consist of a large number of core-Sérsic galaxies.
(6) We argue that the different  relations for early- and late-type galaxies reflect that the two Hubble types have two distinct SMBH feeding mechanisms. Massive early-type galaxies (M*,k ∼ 8 × 10¹⁰M⊙–1012M⊙) at the high-mass end of the
  red sequence are core-Sérsic galaxies. Their formation is consistent with the scenario in which a gas-rich (wet) major merger at high redshift drives intense bursts of star formation, efficient SMBH growth, and the ensuing rapid quenching of star formation by strong AGN feedback. This is accompanied by gas-poor (dry) major mergers since z ∼ 1.5–2, involving a low level of star formation. In contrast, the less massive (Sérsic) early-type galaxies (M*,k ∼ 1010M⊙ − 2 × 10¹¹M⊙) in the low-mass part of the
  red sequence are likely built up primarily via gas-rich major mergers and form their stellar populations over an extended period of time. We tentatively hypothesize that late-type galaxies (M*,k ∼ 109M⊙ − 2 × 10¹¹M⊙) that define the
  blue sequence form via secular-driven processes involving nonaxisymmetric stellar structures, such as bars and spiral arms. Gas-rich minor mergers could also account for the build-up of late-type galaxies.
(7) Having demonstrated that our  relations are able to predict the SMBH masses in 10 galaxies, we employed these new relations to estimate the central black hole masses in 1382 GALEX/S4G galaxies with no measured black hole masses after excluding highly inclined and dust-obscured GALEX/S4G galaxies (Bouquin et al. 2018). We suggest that the
  relations can be used to estimate black hole masses without the need for high-resolution spectroscopy. However, we warn that to do so, one should use galaxy colors that are determined based on UV and 3.6 μm magnitudes that have been obtained in a homogeneous way. Furthermore, the
  relations can be used to identify low-mass and bulgeless galaxies that potentially harbor IMBHs.
We thank the referee for their useful comments. B.T.D. acknowledges support from the Spanish postdoctoral fellowship "Ayudas 1265 para la atracción del talento investigador. Modalidad 2: jóvenes investigadores." funded by Comunidad de Madrid under grant number 2016-T2/TIC-2039. B.T.D. acknowledges support from grant "Ayudas para la realización de proyectos de I+D para jóvenes doctores 2019." funded by Comunidad de Madrid and Universidad Complutense de Madrid under grant number PR65/19-22417. We acknowledge financial support from the Spanish Ministry of Economy and Competitiveness (MINECO) under grant numbers AYA2016-75808-R and RTI, which is partly funded by the European Regional Development Fund, and from the Excellence Network MaegNet (AYA2017-90589-REDT). A.Y.K.B. acknowledges financial support from the Spanish Ministry of Economy and Competitiveness (MINECO), project Estallidos AYA2016-79724-C4-2-P. J.H.K. acknowledges financial support from the European Union's Horizon 2020 research and innovation program under Marie Skłodowska-Curie grant agreement No 721463 to the SUNDIAL ITN network, from the State Research Agency (AEI) of the Spanish Ministry of Science, Innovation and Universities (MCIU) and the European Regional Development Fund (FEDER) under the grant with reference AYA2016-76219-P, from IAC project P/300724, financed by the Ministry of Science, Innovation and Universities, through the State Budget and by the Canary Islands Department of Economy, Knowledge and Employment, through the Regional Budget of the Autonomous Community, and from the Fundación BBVA under its 2017 program of assistance to scientific research groups, for the project "Using machine-learning techniques to drag galaxies from the noise in deep imaging." J.G. acknowledges financial support from the Spanish Ministry of Economy and Competitiveness under grant number AYA2016-77237-C3-2P.
Appendix A
A.1. Bayesian Approach
We have performed linear regression fits to the ( ) data set by applying a Bayesian statistical inference with an MCMC technique.14
The regression fits take into account errors in MBH and
) data set by applying a Bayesian statistical inference with an MCMC technique.14
The regression fits take into account errors in MBH and  and an additional spread that is not explained by the error bars. The MCMC runs were implemented in our work through the Stan programming language15
(e.g., Carpenter et al. 2017). In addition to the slope, intercept, and dispersion, the model parameters include "true" color and SMBH mass values. In our implementation, the observed SMBH mass upper limits were modeled by drawing samples from an asymmetric normal distribution centered around the true values, with the standard deviation having an upper wing that equals the error bar of the measurements and a lower wing with a much larger size. The regression fits thus probe a large range in SMBH masses for galaxies with SMBH upper limits. For the Bayesian analysis, we used noninformative prior distributions (e.g., Gelman et al. 2013) and confirmed that the results did not depend on the choice of the prior details.
and an additional spread that is not explained by the error bars. The MCMC runs were implemented in our work through the Stan programming language15
(e.g., Carpenter et al. 2017). In addition to the slope, intercept, and dispersion, the model parameters include "true" color and SMBH mass values. In our implementation, the observed SMBH mass upper limits were modeled by drawing samples from an asymmetric normal distribution centered around the true values, with the standard deviation having an upper wing that equals the error bar of the measurements and a lower wing with a much larger size. The regression fits thus probe a large range in SMBH masses for galaxies with SMBH upper limits. For the Bayesian analysis, we used noninformative prior distributions (e.g., Gelman et al. 2013) and confirmed that the results did not depend on the choice of the prior details.
Figure A1 shows the results of the Bayesian linear regressions. The shaded regions indicate the 95% highest density interval (HDI) for the derived fits. Note that the HDIs are not symmetric because the derived parameters exhibit skewed posterior distributions. The dotted lines mark the 1σ and 3σ intervals for the additional real dispersion that is not explained by the error bars (Figure A1). The probability distribution functions (PDFs) for these additional dispersions are not symmetrical, and the derived values exhibit 95% HDIs of 0.00 and 0.74, and 0.14 and 0.68 for the early- and late-type galaxies. For the former, the additional dispersion is not significantly different from zero, therefore the observed dispersion could be fully explained by the error bars. In contrast, an additional real dispersion is needed for the latter to explain the residuals from the fitted relation.
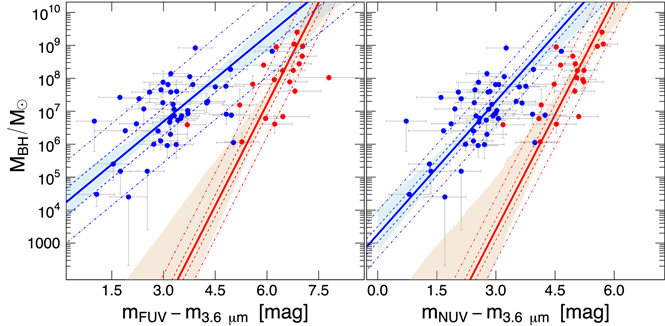
Figure A1. Similar to Figure 2, but here plotting the results of our symmetric linear Bayesian regression analysis. Early-type and late-type galaxies are shown in red and blue, respectively. The shaded regions indicate the 95% HDI for the derived fits. The dotted lines mark the 1σ and 3σ intervals for the additional real dispersion that is not explained by the error bars; see the text for further detail.
Download figure:
Standard image High-resolution imageIn Figure A2 we show the PDF for the disparity in slope between early- and late-type  relations obtained by applying the linear Bayesian regression fits. The PDFs are determined using all the individual steps of the computed chains, thus avoiding any assumption about the probability distribution of the derived parameters. We find that the significance levels for rejecting the null hypothesis that both morphological types have the same slope are 1.7% and 6.7% for the FUV and NUV relations, respectively.
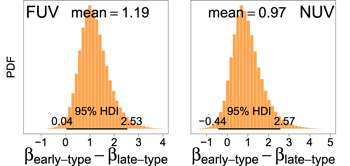
Figure A2. PDF for the difference in slopes (β) between the linear Bayesian regression fits to the early- and late-type ( ) data (see Figure A1).
Download figure:
Standard image High-resolution imageAppendix B
B.1. Outliers in the Diagrams

Five galaxies in our sample are offset notably from the  relations (Figure 2).
B.1.1. NGC 2685
The Helix Galaxy NGC 2685 is a well-studied polar ring lenticular galaxy (Schechter & Gunn 1978; Shane 1980; Watson et al. 1994; Eskridge & Pogge 1997; Schinnerer & Scoville 2002; Karataeva et al. 2004; Rampazzo et al. 2007; Józsa et al. 2009). Sandage (1961) referred to it as to the most unusual of all the galaxies in his atlas, and subsequent studies confirmed its rare nature (e.g., Eskridge & Pogge 1997; Schinnerer & Scoville 2002; Józsa et al. 2009). The galaxy contains a high concentration of molecular, neutral, and atomic hydrogen gas in its polar ring. Figure 2 shows that it resides in the  blue sequence that is defined by late-type galaxies, and its
  color is abnormally (∼1.90/1.00 FUV/NUV mag) bluer than that predicted for early-type galaxies based on the galaxy SMBH mass. This result agrees with the two formation scenarios considered in the literature for NGC 2685: formation via accretion of a small gas-rich companion (e.g., Shane 1980; Watson et al. 1994; Schinnerer & Scoville 2002), and a merger of two disk galaxies (e.g., Józsa et al. 2009).
B.1.2. NGC 3310
The starburst galaxy NGC 3310 is a well-studied peculiar spiral galaxy (SAB) known for its very blue color, circumnuclear ring of star formation, tidal features, and very bright infrared luminosity (e.g., Balick & Heckman 1981; Mulder et al. 1995; Smith et al. 1996; Conselice et al. 2000; Elmegreen et al. 2002; Wehner & Gallagher 2005; Wehner et al. 2006; Hägele et al. 2010). The favored scenario for the formation of the galaxy is through accretion of a small gas-rich dwarf galaxy ∼10 Myr ago (Balick & Heckman 1981; Mulder et al. 1995; Smith et al. 1996; Conselice et al. 2000; Wehner & Gallagher 2005; Wehner et al. 2006). Consistent with this picture, Figure 2 shows that the galaxy  color is (∼1.99/1.79 FUV/NUV mag) bluer than expected for late-type galaxies.
B.1.3. NGC 3368
The case of the double-barred spiral (SAB) galaxy NGC 3368 is less clear. It is the brightest galaxy in the nearby NGC 3368 group (Sil'chenko et al. 2003; Watkins et al. 2014), containing a dominant pseudo-bulge, a small classical bulge, and a box/peanut component (Nowak et al. 2010; Erwin et al. 2015). Not only is its  color (∼1.81/1.61 FUV/NUV mag) redder than that expected for late-type galaxies given its MBH, the galaxy also falls on the
  red sequence that is defined by early-type galaxies (Figure 2). Figure 2 shows that NGC 3368 lies 0.45 dex below the best-fitting MBH − σ line in the log MBH direction. This might suggest that the galaxy has an abnormally low SMBH mass and not a discrepant redder color. We cannot rule out the possibility that the black hole mass and color conspire, causing the offset in the
  diagrams (Figure 2).
B.1.4. NGC 4826
The SABa galaxy NGC 4826 is also referred to as the Evil- or Black-Eye Galaxy, which refers to its dusty disk, which has a radius R ∼ 50''. It has a large-scale counter-rotating gas disk (van Driel & Buta 1993; Braun et al. 1994; García-Burillo et al. 2003). The galaxy is the most significant outlier in the  diagrams, having a
  color (∼2.68/2.04 FUV/NUV mag) that is redder than what is expected for late-type galaxies (Figure 2). The dust disk likely explains the deviant (redder) UV−[3.6] color for the galaxy. Figure 2 shows that the galaxy falls on the red early-type sequence, despite being a late-type galaxy.
B.1.5. NGC 5018
The giant elliptical (E3) NGC 5018 is the most intriguing case. It is the brightest member of the poor NGC 5018 group that contains five galaxies (Gourgoulhon et al. 1992) and is known for its morphological peculiarity, including shells, ripples, and a dust lane (Schweizer 1987; Kim et al. 1988; Malin & Hadley 1997; Leonardi & Worthey 2000; Knapen et al. 2014). There is a tidal bridge between NGC 5018 and a gas-rich spiral companion, NGC 5022, detected in optical (Schweizer 1987; Malin & Hadley 1997) and H i observations (Kim et al. 1988; Ghosh et al. 2005) that was built up via accretion of gaseous material from NGC 5022 onto NGC 5018. NGC 5018 is currently forming stars (Ghosh et al. 2005), and about 12% (by mass) of the stars in the galaxy are younger than 3.4 Gyr (Nolan et al. 2007, see also Leonardi & Worthey 2000). The galaxy has a low metallicity and FUV and mid-UV flux deficits that are unusual for its luminosity and velocity dispersion (Bertola et al. 1993; Buson et al. 2004). While Carollo & Danziger (1994) attributed the observed unusual metallicity and UV fluxes to nuclear dust extinction, the galaxy is an outlier from the  diagram but not from the
  diagram (Figure 2), revealing that the offset nature of the galaxy is not caused by dust extinction, but rather by the mixing of young and old populations of stars at the galaxy center, which washes out the preexisting metallicity (Bertola et al. 1993; Hilker & Kissler-Patig 1996; Kim et al. 1988; Buson et al. 2004). We also note that the galaxy is slightly offset from the MBH − L3.6,tot relation toward a brighter magnitude. This may partly explain the deviant red color of the galaxy.
Appendix C
Table C1 presents total magnitudes, bulge-to-total (B/T) and disk-to-total (D/T) ratios, dust corrections, and SMBH masses for our sample galaxies.
Table C1. Basic Data for Our Sample of 67 GALEX/S4G Galaxies with Directly Measured SMBH Masses
| Galaxy | Type | mFUV | mNUV | m3.6 | B/T | B/T | D/T | D/T | Dustcorr | Dustcorr | Dustcorr | log MBH |
|---|---|---|---|---|---|---|---|---|---|---|---|---|
| B+D | B+D | B+D | FUV and NUV | 3.6 | FUV and NUV | 3.6 | (B and D)3.6 | (B and D)FUV | (B and D)NUV | |||
| (mag) | (mag) | (mag) | (mag) | (mag) | (mag) | (M⊙) | ||||||
| (1) | (2) | (3) | (4) | (5) | (6) | (7) | (8) | (9) | (10) | (11) | (12) | (13) |
| NGC 0289 | SBbc |

|

|

|
⋯ | 0.02 | 0.92 | 0.92 | 0.14/0.05 | ⋯/0.66 | ⋯/0.66 |

|
| NGC 0428 | SABm |

|

|

|
⋯ | 0.00 | 0.93 | 0.93 | 0.13/0.05 | ⋯/0.70 | ⋯/0.70 |

|
| NGC 0613 | SBbc |

|

|

|
0.04 | 0.13 | 0.92 | 0.75 | 0.13/0.05 | 1.29/0.62 | 1.29/0.62 |

|
| NGC 1042 | SABc |

|

|

|
⋯ | 0.02 | 0.97 | 0.97 | 0.13/0.05 | ⋯/0.70 | ⋯/0.70 |

|
| NGC 1052 | E4 |

|

|

|
0.67 | 0.72 | ⋯ | ⋯ | 0.01/⋯ | 0.23/⋯ | 0.23/⋯ |

|
| NGC 1097 | SBb |

|

|

|
0.11 | 0.22 | 0.79 | 0.56 | 0.15/0.05 | 1.41/0.73 | 1.41/0.73 |

|
| NGC 1300 | SBc |

|

|

|
⋯ | 0.07 | 0.87 | 0.87 | 0.16/0.05 | ⋯/0.76 | ⋯/0.76 |

|
| NGC 1386 | SB0-a |

|

|

|
0.26 | 0.36 | 0.70 | 0.58 | 0.32/0.10 | 1.54/1.00 | 1.54/1.00 |

|
| NGC 1493 | SBc |

|

|

|
⋯ | 0.00 | 0.97 | 0.97 | 0.11/0.04 | ⋯/0.53 | ⋯/0.53 |

|
| NGC 2685 | SB0-a |

|

|

|
0.36 | 0.46 | 0.54 | 0.41 | 0.23/0.08 | 1.82/1.17 | 1.83/1.18 |

|
| NGC 2748 | Sbc |

|

|

|
⋯ | 0.03 | 0.97 | 0.97 | 0.34/0.11 | ⋯/1.16 | ⋯/1.17 |

|
| NGC 2787 | SB0-a |

|

|

|
0.39 | 0.51 | 0.59 | 0.45 | 0.19/0.07 | 2.32/1.65 | 2.34/1.66 |

|
| NGC 2903 | SBbc |

|

|

|
⋯ | 0.07 | 0.90 | 0.90 | 0.25/0.08 | ⋯/0.96 | ⋯/0.96 |

|
| NGC 2964 | SBbc |

|

|

|
⋯ | 0.10 | 0.90 | 090 | 0.20/0.06 | ⋯/0.75 | ⋯/0.75 |

|
| NGC 2974 | E4 |

|

|

|
0.49 | 0.54 | ⋯ | ⋯ | 0.01/⋯ | 0.44/⋯ | 0.45/0.45 |

|
| NGC 3021 | Sbc |

|

|

|
⋯ | 0.01 | 0.98 | 0.98 | 0.19/0.06 | ⋯/0.71 | ⋯/0.71 |

|
| NGC 3031 | Sab |

|

|

|
0.14 | 0.46 | 0.86 | 0.54 | 0.23/0.08 | 1.96/1.30 | 1.97/1.31 |

|
| NGC 3079 | SBc |

|

|

|
0.07 | 0.24 | 0.93 | 0.77 | 0.57/0.24 | 1.81/1.73 | 1.82/1.73 |

|
| NGC 3115 | E-S0 |

|

|

|
0.63 | 0.74 | 0.37 | 0.26 | 0.36/0.13 | 1.86/1.37 | 1.87/1.38 |

|
| NGC 3310 | SBbc |

|

|

|
0.16 | 0.33 | 0.83 | 0.63 | 0.13/0.05 | 1.33/0.65 | 1.33/0.66 |

|
| NGC 3368 | SBab |

|

|

|
⋯ | 0.07 | 0.92 | 0.92 | 0.15/0.05 | ⋯/0.71 | ⋯/0.71 |

|
| NGC 3414 | SB0 |

|

|

|
0.57 | 0.69 | 0.41 | 0.29 | 0.13/0.05 | 1.36/0.69 | 1.37/0.69 |

|
| NGC 3423 | Sc |

|

|

|
⋯ | 0.06 | 0.95 | 0.95 | 0.12/0.05 | ⋯/0.71 | ⋯/0.71 |

|
| NGC 3489 | SB0-a |

|

|

|
0.23 | 0.32 | 0.71 | 0.58 | 0.19/0.06 | 1.38/0.71 | 1.39/0.71 |

|
| NGC 3608 | E2 |

|

|

|
1.00 | 1.00 | ⋯ | ⋯ | 0.01/⋯ | 0.17/⋯ | 0.18/⋯ |

|
| NGC 3627 | SBb |

|

|

|
0.03 | 0.12 | 0.93 | 0.78 | 0.26/0.08 | 1.62/1.00 | 1.62/1.00 |

|
| NGC 3642 | Sbc |

|

|

|
0.03 | 0.14 | 0.95 | 0.80 | 0.12/0.04 | 1.21/0.55 | 1.21/0.55 |

|
| NGC 4041 | Sbc |

|

|

|
0.03 | 0.14 | 0.95 | 0.80 | 0.12/0.04 | 1.28/0.61 | 1.28/0.61 |

|
| NGC 4051 | SABb |

|

|

|
0.03 | 0.15 | 0.96 | 0.80 | 0.13/0.04 | 1.26/0.59 | 1.27/0.59 |

|
| NGC 4088 | SABc |

|

|

|
⋯ | 0.02 | 0.98 | 0.98 | 0.32/0.11 | ⋯/1.08 | ⋯/1.08 |

|
| NGC 4151 | SBab |

|

|

|
0.22 | 0.44 | 0.78 | 0.56 | 0.14/0.05 | 1.39/0.71 | 1.39/0.71 |

|
| NGC 4203 | E-S0 |

|

|

|
1.0 | 1.0 | ⋯ | ⋯ | 0.11/0.04 | 1.20/⋯ | 1.20/⋯ |

|
| NGC 4212 | Sc |

|

|

|
⋯ | 0.04 | 0.96 | 0.96 | 0.18/0.06 | ⋯/0.82 | ⋯/0.82 |

|
| NGC 4245 | SB0-a |

|

|

|
0.11 | 0.18 | 0.82 | 0.70 | 0.13/0.05 | 1.32/0.64 | 1.32/0.64 |

|
| NGC 4258 | SBbc |

|

|

|
⋯ | 0.07 | 0.96 | 0.96 | 0.32/0.10 | ⋯/1.02 | ⋯/1.02 |

|
| NGC 4278 | E1-2 |

|

|

|
0.65 | 0.71 | ⋯ | ⋯ | 0.01/⋯ | 0.25/⋯ | 0.26/⋯ |

|
| NGC 4314 | SBa |

|

|

|
0.08 | 0.17 | 0.79 | 0.57 | 0.12/0.05 | 1.32/0.67 | 1.33/0.67 |

|
| NGC 4321 | SABb |

|

|

|
⋯ | 0.10 | 0.90 | 0.90 | 0.12/0.05 | ⋯/0.67 | ⋯/0.67 |

|
| NGC 4371 | SB0-a |

|

|

|
0.16 | 0.23 | 0.74 | 0.62 | 0.12/0.05 | 1.41/0.76 | 1.41/0.76 |

|
| NGC 4374 | E1 |

|

|

|
0.60 | 0.65 | ⋯ | ⋯ | 0.01/⋯ | 0.35/⋯ | 0.35/⋯ |

|
| NGC 4388 | SBb |

|

|

|
0.06 | 0.16 | 0.94 | 0.84 | 0.56/0.24 | 1.97/1.84 | 1.97/1.85 |

|
| NGC 4472 | E2 |

|

|

|
0.58 | 0.63 | ⋯ | ⋯ | 0.01/⋯ | 0.19/⋯ | 0.19/⋯ |

|
| NGC 4501 | Sb |

|

|

|
⋯ | 0.06 | 0.94 | 0.94 | 0.21/0.07 | ⋯/0.92 | ⋯/0.93 |

|
| NGC 4548 | SBb |

|

|

|
0.03 | 0.12 | 0.93 | 0.78 | 0.13/0.05 | 1.45/0.78 | 1.46/0.79 |

|
| NGC 4593 | SBb |

|

|

|
0.10 | 0.16 | 0.81 | 0.61 | 0.13/0.05 | 1.36/0.69 | 1.37/0.69 |

|
| NGC 4594 | Sa |

|

|

|
0.49 | 0.83 | 0.51 | 0.17 | 0.31/0.10 | 1.84/1.27 | 1.84/1.28 |

|
| NGC 4596 | SB0-a |

|

|

|
0.13 | 0.19 | 0.77 | 0.65 | 0.13/0.05 | 1.32/0.64 | 1.32/0.65 |

|
| NGC 4698 | Sab |

|

|

|
0.22 | 0.44 | 0.78 | 0.56 | 0.17/0.05 | 1.43/0.74 | 1.43/0.75 |

|
| NGC 4736 | Sab |

|

|

|
0.24 | 0.42 | 0.54 | 0.21 | 0.12/0.04 | 1.27/0.61 | 1.28/0.61 |

|
| NGC 4800 | Sb |

|

|

|
0.04 | 0.17 | 0.95 | 0.80 | 0.13/0.05 | 1.28/0.60 | 1.28/0.61 |

|
| NGC 4826 | SABa |

|

|

|
0.12 | 0.28 | 0.87 | 0.68 | 0.21/0.07 | 1.62/0.96 | 1.63/0.96 |

|
| NGC 5005 | SABb |

|

|

|
0.06 | 0.15 | 0.88 | 0.69 | 0.24/0.07 | 1.44/0.81 | 1.45/0.81 |

|
| NGC 5018 | E3 |

|

|

|
0.83 | 0.88 | ⋯ | ⋯ | 0.02/⋯ | 0.79/⋯ | 0.80/⋯ |

|
| NGC 5055 | Sbc |

|

|

|
0.03 | 0.17 | 0.97 | 0.81 | 0.19/0.06 | 1.40/0.73 | 1.40/0.73 |

|
| NGC 5194 | SABb |

|

|

|
⋯ | 0.10 | 0.87 | 0.88 | 0.17/0.06 | ⋯/0.83 | ⋯/0.83 |

|
| NGC 5248 | SBb |

|

|

|
0.05 | 0.20 | 0.95 | 0.80 | 0.14/0.05 | 1.37/0.69 | 1.37/0.69 |

|
| NGC 5273 | S0 |

|

|

|
⋯ | 0.09 | 0.99 | 0.91 | 0.11/0.04 | ⋯/0.53 | ⋯/0.53 |

|
| NGC 5347 | SBab |

|

|

|
0.17 | 0.33 | 0.80 | 0.59 | 0.13/0.05 | 1.31/0.64 | 1.32/0.64 |

|
| NGC 5427 | SABc |

|

|

|
⋯ | 0.10 | 0.90 | 0.90 | 0.12/0.05 | ⋯/0.68 | ⋯/0.69 |

|
| NGC 5457 | SABc |

|

|

|
⋯ | 0.05 | 0.95 | 0.95 | 0.11/0.04 | ⋯/0.53 | ⋯/0.53 |

|
| NGC 5576 | E3 |

|

|

|
0.69 | 0.74 | ⋯ | ⋯ | 0.01/⋯ | 0.25/⋯ | 0.26/⋯ |

|
| NGC 5728 | SBa |

|

|

|
0.12 | 0.26 | 0.72 | 0.39 | 0.20/0.07 | 2.09/1.41 | 2.10/1.42 |

|
| NGC 5846 | E0-1 |

|

|

|
0.60 | 0.65 | ⋯ | ⋯ | 0.01/⋯ | 0.46/⋯ | 0.46/⋯ |

|
| NGC 5879 | SBbc |

|

|

|
0.16 | 0.46 | 0.83 | 0.51 | 0.44/0.16 | 1.67/1.33 | 1.67/1.33 |

|
| NGC 5921 | SBbc |

|

|

|
0.01 | 0.11 | 0.99 | 0.83 | 0.13/0.05 | 1.45/0.78 | 1.45/0.79 |

|
| NGC 7418 | SBc |

|

|

|
⋯ | 0.02 | 0.97 | 0.97 | 0.13/0.04 | ⋯/0.61 | ⋯/0.61 |

|
| NGC 7582 | SBab |

|

|

|
0.10 | 0.25 | 0.78 | 0.45 | 0.29/0.09 | 1.51/0.93 | 1.51/0.93 |

|
Note. Column (1) lists the galaxy name. Column (2) lists the morphological type from HyperLeda, in good agreement with the classification in the NED database. Columns (3)–(5) list dust-corrected, FUV, NUV, and 3.6 μm total (B + D) apparent magnitudes ( ,
,  , and
, and  ). Columns (6)–(9) list FUV, NUV, and 3.6 μm bulge-to-total (B/T) and disk-to-total (D/T) ratios. Columns (10)–(12) list bulge and disk dust corrections in
  , FUV-, and NUV-bands, see Section 3.1. Column (13) list the SMBH mass from van den Bosch (2016).
A machine-readable version of the table is available.
Appendix D
We use our  and
and  relations (Table 1) together with the appropriate asymptotic galaxy colors derived based on the asymptotic FUV, NUV, and 3.6 μm magnitudes from Bouquin et al. (2018, their Table 1) to predict tentative black hole masses in a sample of 1382 GALEX/S4G galaxies with no measured black hole masses (Table D1). From the Bouquin et al. (2018) sample, we excluded galaxies that are highly inclined, dust obscured, and have prominent large-scale bars and rings. In contrast to the total (B+D) magnitudes in this paper (Table C1), the Bouquin et al. (2018) asymptotic magnitudes, which were not corrected for internal dust attenuation, contain additional fluxes from bars, rings, and nuclear components. We therefore caution about overinterpreting these predicted black hole masses. Furthermore, Chandra X-ray data or/and high-resolution radio data are important to confirm the presence of a central black hole in the low-mass (M* ≲ 1010M⊙) GALEX/S4G galaxies.
Table D1. Predicted Black Hole Masses for 1382 GALEX/S4G Galaxies with no Measured Black Hole Masses
| Galaxy | Type | MBH | MBH | Galaxy | Type | MBH | MBH | Galaxy | Type | MBH | MBH | Galaxy | Type | MBH | MBH |
|---|---|---|---|---|---|---|---|---|---|---|---|---|---|---|---|
| (FUV) | (NUV) | (FUV) | (NUV) | (FUV) | (NUV) | (FUV) | (NUV) | ||||||||
| (1) | (2) | (3) | (4) | (1) | (2) | (3) | (4) | (1) | (2) | (3) | (4) | (1) | (2) | (3) | (4) |
| ESO 013-016 | 7.5 | 5.35 | 5.42 | ESO 159-025 | 10.0 | 4.84 | 4.37 | ESO 286-044 | −0.8 | 6.33 | 6.25 | ESO 342-050 | 5.0 | 6.80 | 6.99 |
| ESO 026-001 | 5.9 | 5.03 | 4.96 | ESO 187-035 | 9.0 | 4.78 | 4.57 | ESO 287-037 | 8.5 | 5.61 | 5.64 | ESO 345-046 | 7.0 | 5.16 | 5.11 |
| ESO 027-001 | 5.0 | 6.42 | 6.45 | ESO 187-051 | 9.0 | 4.79 | 4.52 | ESO 288-013 | 9.0 | 5.46 | 5.26 | ESO 347-008 | 9.0 | 4.50 | 4.16 |
| ESO 027-008 | 5.1 | 7.98 | 8.15 | ESO 202-041 | 8.9 | 3.86 | 3.34 | ESO 289-026 | 7.9 | 4.98 | 4.72 | ESO 347-017 | 9.0 | 4.83 | 4.52 |
| ESO 048-017 | 6.9 | 5.10 | 4.86 | ESO 234-043 | 8.9 | 5.19 | 4.75 | ESO 291-024 | 5.0 | 5.57 | 5.40 | ESO 347-029 | 7.9 | 5.02 | 4.78 |
| ESO 079-005 | 7.0 | 5.08 | 4.75 | ESO 234-049 | 4.1 | 5.28 | 5.00 | ESO 293-034 | 6.2 | 6.89 | 7.06 | ESO 355-026 | 4.2 | 6.13 | 6.16 |
| ESO 079-007 | 4.0 | 5.32 | 5.12 | ESO 237-052 | 7.5 | 5.27 | 5.06 | ESO 293-045 | 7.8 | 4.14 | 3.69 | ESO 356-018 | 5.0 | 5.36 | 5.24 |
| ESO 085-014 | 9.0 | 4.75 | 4.08 | ESO 238-018 | 5.5 | 4.62 | 4.35 | ESO 298-015 | 6.2 | 5.50 | 5.33 | ESO 357-007 | 9.0 | 5.18 | 4.93 |
| ESO 085-047 | 9.0 | 3.81 | 3.19 | ESO 245-005 | 9.9 | 3.64 | 3.04 | ESO 298-023 | 6.0 | 4.68 | 4.35 | ESO 357-012 | 7.0 | 5.03 | 4.83 |
| ESO 119-016 | 9.7 | 5.12 | 4.82 | ESO 245-007 | 9.5 | 6.22 | 5.17 | ESO 300-014 | 8.9 | 5.68 | 5.50 | ESO 358-005 | 9.0 | 5.56 | 5.40 |
| ESO 120-012 | 7.1 | 4.43 | 4.03 | ESO 248-002 | 6.9 | 6.34 | 6.26 | ESO 302-021 | 5.0 | 4.43 | 4.08 | ESO 358-015 | 8.9 | 5.86 | 5.70 |
| ESO 145-025 | 9.0 | 4.08 | 3.69 | ESO 249-008 | 1.3 | 5.37 | 5.24 | ESO 305-009 | 8.0 | 4.27 | 3.74 | ESO 358-020 | 9.3 | 6.69 | 6.60 |
| ESO 149-001 | 8.0 | 4.95 | 4.39 | ESO 249-026 | 7.2 | 4.07 | 3.44 | ESO 305-017 | 9.9 | 4.73 | 4.31 | ESO 358-025 | −2.6 | 5.05 | 5.35 |
| ESO 149-003 | 9.7 | 3.56 | 3.07 | ESO 249-035 | 5.9 | 4.28 | 3.68 | ESO 340-017 | 8.0 | 5.50 | 5.72 | ESO 358-051 | 0.0 | 6.33 | 6.23 |
| ESO 150-005 | 7.8 | 5.07 | 4.86 | ESO 249-036 | 10.0 | 4.66 | 4.31 | ESO 340-042 | 7.8 | 5.31 | 5.41 | ESO 358-054 | 8.0 | 5.02 | 4.79 |
| ESO 154-023 | 8.9 | 4.65 | 4.75 | ESO 285-048 | 5.9 | 5.73 | 5.55 | ESO 341-032 | 9.0 | 5.18 | 4.92 | ESO 358-060 | 9.9 | 3.74 | 3.30 |
Note. Column (1) lists the galaxy name. Column (2) lists the galaxy T-type from HyperLeda. Columns (3) and (4) list the tentative black hole masses (log  ) estimated using our
  and
and  relations (Table 1) and the asymptotic FUV, NUV, and 3.6 μm magnitudes from Bouquin et al. (2018, their Table 1). We adopt a typical uncertainty of 0.85 dex on
  ) for these predicted black hole masses.
Only a portion of this table is shown here to demonstrate its form and content. A machine-readable version of the full table is available.
Download table as: DataTypeset image
Footnotes
- 4
- 5
- 6
The strength of the
correlations decreases when the SMBH upper limits are excluded. The Pearson correlation coefficient for the (, MBH) blue sequence has reduced from r ∼ 0.60 to 0.34 due to the exclusion of MBH upper limits, and for the (, MBH) blue sequence, there is a decrease in r from ∼0.65 to 0.36. - 7
While the IR emissions in massive galaxies have contributions from the dusty AGN, the NUV emissions arise from main-sequence turn-off stars and are less prone to contamination from the AGN (Boselli et al. 2005).
- 8
After comparing the HyperLeda individual velocity dispersion measurements and mean homogenized values for 100 sample galaxies, we adopt a conservative upper limit on the uncertainty of 10% on σ.
- 9
Our slopes for the full sample of 66 galaxies are slightly (i.e., ∼1.4σ ≈ 15%) shallower than the slope reported by van den Bosch (2016, slope ∼5.35 ± 0.23). This is because the van den Bosch (2016, his Figure 1) sample contains extremely bright galaxies with σ ≳ 270, which tend to steepen the MBH − σ relation (see Figure 1).
- 10
We have converted the 3.6 μm VEGA magnitudes from Savorgnan & Graham (2016) into AB magnitudes.
- 11
- 12
Massive early-type galaxies and some BCGs can acquire cold gas through the cooling of hot gas and/or via cannibalism of a gas-rich satellite, and they may undergo episodes of low level star formation at low redshift (Salomé & Combes 2003; O'Dea et al. 2008; Hopkins & Hernquist 2009; Struve et al. 2010; Young et al. 2011; Zubovas & King 2012; Russell et al. 2014, 2019; Smith & Edge 2017; Krajnović et al. 2020).
- 13
All the seven core-Sérsic galaxies in this paper are "normal-core" galaxies (Dullo 2019).
- 14
- 15


