


Abstract
Since 2018 July, the black hole X-ray binary GRS 1915+105 has been in an X-ray low luminous state (XLLS), which is the faintest period ever observed in a soft X-ray band. We present here the results of near-infrared (NIR) observations from 2019 April–December in the XLLS using HONIR attached to the Kanata telescope, together with radio data obtained by the Yamaguchi Interferometer and archival X-ray data. We found the historical NIR brightening in the XLLS. For several tens of days in the XLLS, NIR flux showed a positive correlation with radio flux and negative correlation with X-ray flux. This result suggests that at least a jet contributes to the NIR bands in the NIR-bright XLLS period. An accretion disk is not likely a candidate for the NIR emission because of the decrease of X-ray flux. In contrast to the NIR band, there was no historical radio brightening in the XLLS. This implies that the NIR emission in the NIR-bright period cannot be explained by the jet alone. The X-ray obscuration suggested by X-ray data is another possible candidate for the nonjet emission component in the NIR band.
Export citation and abstract BibTeX RIS
1. Introduction
Black hole low-mass X-ray binaries (BH-LMXBs) are the binary systems of a black hole whose mass is from a few to a dozen M⊙ and a low-mass companion star. The gas that flows out from the companion star accretes to the black hole. As the gas falls into the black hole, gravitational energy is released and various processes are driven.
The X-ray spectra of BH-LMXBs sometimes show dramatic changes, which are called a "state transition." The state transition can be interpreted by changes in the geometrical and radiative properties of an accretion disk at the vicinity of the black hole (e.g., Shakura & Sunyaev 1973; Narayan & Yi 1995). The X-ray emission state can be roughly classified into two types: a high/soft state and a low/hard state (e.g., Remillard & McClintock 2006). The X-ray spectrum and accretion rate in the high/soft state are brighter and higher than those in the low/hard state.
From the X-ray binary system, a relativistic plasma outflow, which is called a "jet," is sometimes ejected. There are two main types of jets in the X-ray binaries: the optically thick self-absorbed jet detected in the low/hard state and the optically thin transient jet detected in the state transition from the hard to the soft state. The spectral indexes α, where Fν ∝ να , are different between the spectra emitted from these jets. The former spectrum is flat or slightly inverted, α ∼ 0.0–0.5 (e.g., Fender 2001; Gallo et al. 2003; Shahbaz 2019), at least up to millimeter wavelengths, while the latter is steep, α ∼ −0.6 (e.g., Corbel & Fender 2002; Hynes et al. 2003; Buxton & Bailyn 2004; Russell et al. 2010). The flat spectrum can be explained by assuming a conical shape of the partially self-absorbed jet (e.g., Blandford & Koenigl 1979; Hjellming & Johnston 1988; Fender 2001; Shahbaz 2019), and the steep spectrum can be explained by the internal shock with the fast-moving plasma (e.g., Marscher & Gear 1985; Kaiser et al. 2000).
In the soft state, the jet is usually not detected, but outflow, called "disk wind," from the surface of the accretion disk can be detected in some BH-LMXBs (Díaz Trigo & Boirin 2016). Ponti et al. (2012) suggested that the disk wind causes mass loss of at least twice the mass inflow rate in the cases of BH-LMXBs 4U1630–47, GRO J1655–40, H1743–322, and GRS 1915+105. The disk wind is one of the major mechanisms of mass transfer in a BH-LMXB system. Three major mechanisms are suggested to generate the disk wind: thermal, radiative, and magnetic pressures (e.g., Begelman et al. 1983; Balbus & Hawley 1991; Proga et al. 2000).
Multiwavelength observations for BH-LMXBs are often performed to obtain time variations of the fluxes and spectral energy distributions to study the accretion disk, jet, and disk wind (e.g., Mirabel et al. 1998; Neilsen & Lee 2009; Gandhi et al. 2010; Shidatsu et al. 2018; Kosenkov et al. 2020). From the long-term observations, many BH-LMXBs show a positive correlation between the optical/near-infrared (OIR) and X-ray fluxes, especially during the outburst period (e.g., Bernardini et al. 2016; Maitra et al. 2017; Vincentelli et al. 2018). One of the reasons for the correlation is that the observed OIR and X-ray emissions occur at the same location (e.g., the outer and inner parts, respectively, of the accretion disk). However, the near-infrared (NIR) emission of a BH-LMXB could also originate from the jet instead of the disk in the hard state, which is suggested by observational evidence such as multiwavelength spectra and flux variations (e.g., Eikenberry et al. 1998; Mirabel et al. 1998; Fender & Pooley 2000). Because of the complexity of the NIR region, which includes not only the jet and the disk emissions but also the companion star and other emissions, the origin of the NIR emission is still under debate compared to the radio and X-ray emissions. This causes difficulties in investigating how the jet and disk evolve and estimating the physical quantities of their radiative components.
A candidate for the NIR radiation mechanism of BH-LMXBs is the synchrotron radiation from the jet, in addition to the thermal radiation from the accretion disk and the companion star. The synchrotron radiation from high-energy particles in the jet is lineally polarized in the direction perpendicular to the magnetic field in the radiation region. The polarization from the synchrotron radiation is detected from the blazar jet (e.g., Aller et al. 1999; Marscher et al. 2008; Abdo et al. 2010; Ikejiri et al. 2011; Blinov et al. 2016; Zhang 2019). If the synchrotron radiation from the BH-LMXB jet is observed, the polarization is expected to be detected. The OIR polarization observations have already been performed on some BH-LMXBs, and some of them may show jet-derived polarization (Dubus & Chaty 2006; Russell & Fender 2008; Shahbaz et al. 2008; Chaty et al. 2011; Lipunov et al. 2016; Shahbaz et al. 2016).
The BH-LMXB GRS 1915+105 has continued its outburst since its discovery in 1992 (Castro-Tirado et al. 1992, 1994; Remillard & McClintock 2006). The spectral type of the companion star is K5 iii (Ziółkowski & Zdziarski 2017). The binary system has an orbital period of 33.85 ± 0.16 days (Steeghs et al. 2013). The inclination angle at the system is  °, and the distance is
  kpc (Reid et al. 2014). The black hole mass is
  M⊙ measured by a trigonometric parallax (Reid et al. 2014). Previous observations of GRS 1915+105 have allowed us to understand many important physical phenomena related to the accretion and ejection of black holes so far, such as a superluminal radio jet (Mirabel & Rodríguez 1994; Fender et al. 1999), the relationship between jets and the accretion disk (e.g., Mirabel et al. 1998), and the nature of the disk wind (e.g., Lee et al. 2002; Neilsen & Lee 2009; Ueda et al. 2009).
The NIR flux from the source has been reported to exhibit variability on timescales ranging from a few minutes to several months, as well as X-rays. The origin of the short-term variations of the NIR emission is suggested to be the jet (e.g., Eikenberry et al. 1998; Mirabel et al. 1998; Ueda et al. 2006); however, the origin of the long-term variations is still unclear. If we can understand the origin of the long-term variations of the NIR emission, we can study the physics and relationships of each emission in more detail by combining it with X-ray and radio results. This will lead to a better understanding of the evolution of black hole systems. To understand the origin of the long-term variation of the NIR emission, the long-term NIR observations are useful. The NIR and X-ray monitoring of GRS 1915+105 over 7 yr from 2000 to 2006 suggested that the thermal emission associated with the accretion disk dominates at low NIR flux and the nonthermal emission dominates at high NIR flux (Neil et al. 2007). In contrast, the NIR monitoring of GRS 1915+105 during a soft state lasting 250 days suggested that the origin of the NIR emission is not at least the jet because of the anticorrelations between the radio and NIR fluxes (Arai et al. 2009). Long-term and multiwavelength monitoring, including NIR bands, is important to reveal the components of long-term variations.
The NIR polarization observation of GRS 1915+105 was performed only 1 night by Shahbaz et al. (2008) during the low flux state in the radio and NIR bands. The observed polarization is consistent with the interstellar polarization, and it is not concluded to be from the jet. The radio and NIR fluxes were low in the past study; however, if the NIR flux is high, there is a possibility of detecting the polarization originating from the synchrotron radiation from the jet. This is needed to perform frequent polarization observations.
Around mid-2018, the source was the faintest ever observed in the soft X-ray band (<10 keV; Negoro et al. 2018). The soft X-ray flux further decreased from around 2019 April to the end of 2019 May by an order of magnitude (Homan et al. 2019). In the X-ray spectra after mid-2019 May, the presence of X-ray obscuration was reported by several authors (Balakrishnan et al. 2019; Miller et al. 2019; Balakrishnan et al. 2021; Koljonen & Tomsick 2020; Miller et al. 2020; Neilsen et al. 2020). During the X-ray dimming state, a radio flux increase from a few to over 100 mJy was also reported between 2019 May 13 and 17 (Motta et al. 2019; Trushkin et al. 2019; Motta et al. 2021).
While the X-rays became fainter, NIR brightening was reported from 2019 April to May (Imazato et al. 2019; Murata et al. 2019; Vishal et al. 2019). In the weeks before and after this anticorrelated event, the X-ray and NIR fluxes were roughly stable, although one strong X-ray flare occurred (MJD ∼ 58,635). This anticorrelated event between the NIR and X-ray fluxes on a timescale of several weeks is a rare event in BH-LMXBs. The origin of the NIR emission and the variability mechanism during the unusual X-ray faint state of GRS 1915+105 are not well understood.
We performed dense, long-term continuous photopolarimetric monitoring of GRS 1915+105 at multiple wavelengths in the NIR bands with the radio and X-ray bands to investigate the origin of the emission mechanism. We present NIR, radio, and X-ray observations and data analysis methods in Section 2, their results in Section 3, and the discussion in Section 4. Errors not explained in this paper are standard errors. Error bars for NIR and radio fluxes and NIR spectral indices in all figures show standard deviations.
2. Observations and Data Reductions
2.1. NIR
We performed the NIR monitoring observations of GRS 1915+105 using the Hiroshima Optical and Near-InfraRed camera (HONIR; Akitaya et al. 2014) installed with the Cassegrain focus of the 1.5 m Kanata telescope at the Higashi-Hiroshima Observatory. We used NIR photometry and photopolarimetry modes with the H- and KS -band filters. This monitoring continued from 2019 April 2 to December 12.
We switched between the photometric and photopolarimetric modes, depending on weather conditions. For the photopolarimetric observation, we used a rotatable half-wave plate and a fixed Wollaston prism; a typical observation sequence takes four exposures at 0°, 45 0, 225, and 675 positions of the half-wave plate in each exposure. Data in both the modes were processed in standard reductions (dark-frame subtraction, flat-field correction, bad-pixel correction, and cosmic-ray removal). In addition, we performed sky-frame subtraction and converted the detector coordinates to sky coordinates with astrometry.net (Lang et al. 2010) in the photometric mode.
Subsequent data in the photometric and photopolarimetric modes were performed by aperture photometry with SExtractor (Bertin & Arnouts 1996) and IRAF, respectively. The typical aperture radius of the photometry was ∼3'' for both modes. In the photometric mode, we calculated the median of the zero-point magnitudes using stars in the Two Micron All Sky Survey (2MASS) All-Sky Catalog (Cutri et al. 2003) within the field of view of the HONIR/Kanata telescope and derived the fluxes. The typical systematic error of the zero-point magnitude was ∼0.02 mag. In the photopolarimetric mode, we derived the fluxes with the median of the zero-point magnitudes using different stars from the photometric mode, since the photopolarimetric mode has only a part of the field of view of the photometric mode. The list of stars used in the calculation of zero-point magnitudes in the photopolarimetric mode is shown in Table 1. The typical systematic error of the magnitudes was ∼0.02 mag for the photopolarimetric mode. As the systematic errors were small in both modes, these errors were negligible for spectral fitting.
Table 1. 2MASS All-Sky Catalog Stars
| Name | R.A. J2000 | Decl. J2000 | KS Magnitude | H Magnitude | Period of Use |
|---|---|---|---|---|---|
| 19151127+1056275 | 288.798149 | +10.945807 | 9.032 | 10.413 | 2019-05-21–2019-12-11 |
| 19151187+1055466 | 288.799469 | +10.929620 | 10.822 | 12.367 | 2019-06-03–2019-12-11 |
| 19151772+1054548 | 288.823854 | +10.915235 | 10.079 | 10.993 | 2019-06-03–2019-12-11 |
| 19151763+1055192 | 288.823492 | +10.922013 | 12.472 | 12.633 | 2019-06-03–2019-12-11 |
| 19150583+1056071 | 288.774321 | +10.935328 | 8.407 | 8.805 | 2019-06-03–2019-06-18 |
| 19151109+1054040 | 288.796218 | +10.901121 | 9.810 | 10.130 | 2019-06-03–2019-06-18 |
| 19151202+1057466 | 288.800101 | +10.962962 | 11.514 | 11.680 | 2019-05-21–2019-06-02 |
Download table as: ASCIITypeset image
The calculations of polarization degree (PD) and electric-vector polarization angle (EVPA) are the same as in Kawabata et al. (1999) and Ikejiri et al. (2011). The errors of PD and EVPA were derived by error propagation with the standard errors of q and u. The typical standard errors in polarization were ∼0.3% for PD and ∼4° for EVPA. The Instrumental PD of NIR band for HONIR was ∼0.2% (Itoh et al. 2017), and the instrumental depolarization of KS band was confirmed to be negligible. The instrumental EVPA was corrected with the polarized standard stars.
2.2. Radio
A radio observation was carried out using the Yamaguchi Interferometer at 36 epochs from MJD 58,529 to 58,820. The observation frequency was 8.448 GHz, and the bandwidth was 512 MHz. The polarization was RHCP for MJD 58,529-58,718 and LHCP thereafter. The system noise temperature was 50 K, the integration time was 600 s, and the typical detection limit of 6σ was 4 mJy. A 1 day observation consisted of two or 30 scans of 600 s each, and the average of the measured flux density was used as the flux density for that day. The nearby AGN 1920+154 and GRS 1915+105 were observed alternately for the flux density measurement. The flux density of GRS 1915+105 was derived using the ratio of the correlated amplitudes of the two sources and the flux density of 1920+154 (593 mJy at 8.448 GHz). The flux density of 1920+154 was regularly monitored based on the flux density of 3C48, 2.99 Jy at 8.448 GHz (Ott et al. 1994).
2.3. X-Ray
2.3.1. MAXI
Monitoring of the All-sky X-ray Image (MAXI; Matsuoka et al. 2009) observation provides the archival X-ray data for many X-ray sources. We used the MAXI data of GRS 1915+105 as soft X-ray information. We analyzed the MAXI on-demand process 7 to generate X-ray light curves of GRS 1915+105 in the energy band from 2.0 to 6.0 keV with the light-curve time bin set to 3 days. The analysis period was from 2009 August 11 to 2019 December 12. The method of the MAXI on-demand process was the same as described in Nakahira et al.(2012).
2.3.2. RXTE
We obtained 1 day averaged X-ray data of GRS 1915+105 provided by the ASM/RXTE team. 8 In this paper, we used A-band 2.0–4.0 keV data from ASM/RXTE. The data period was from 1996 January 6 to 2011 October 25.
3. Result
3.1. Multiwavelength Light Curves and NIR Polarization
Figure 1 shows the multiwavelength light curves including X-ray, NIR, and radio bands. Focusing on the variability timescales of more than a dozen days, the NIR and X-ray fluxes show an anticorrelated variation in the period from MJD 58,600 (2019 April 27) to MJD 58,618 (2019 May 15). The NIR brightening occurs during the X-ray dimming. Here we define the pretransition period (MJD < 58,600) as X-ray low luminous state 1 (XLLS1), the posttransition period (MJD > 58,618) as X-ray low luminous state 2 (XLLS2), and the transition period (58,600 < MJD < 58,618) based on the change in the X-ray flux.

Figure 1. Light curves of GRS 1915+105 in XLLS from MJD 58,500 (2019 January 17) to MJD 58,850 (2020 January 2). This shows the MAXI X-ray count rate (2.0–6.0 keV), NIR flux (circles, KS band; crosses, H band), NIR spectral index (KS and H bands), NIR PD (KS band), NIR EVPA (KS band), and radio flux (8.3 GHz) from top to bottom. Blue, orange, and green points represent the periods of XLLS1, the transition from XLLS1 to XLLS2, and XLLS2, respectively. A reddening correction was not performed.
Download figure:
Standard image High-resolution imageIn the anticorrelated variation during the transition, the X-ray decaying timescale appears longer than the NIR rising timescale. To compare the decaying and rising timescales, time constants, τ, with an exponential function were calculated from the X-ray and NIR fluxes, FX or NIR, in the range from MJD ∼ 58,530 to MJD ∼ 58,619 as

where S is −1 for the X-ray and +1 for the NIR bands. Figure 2 shows models of the exponential function with the best-fit parameters. The τX for the X-ray band was 15 ± 3 days, and τNIR for the NIR band was 1.8 ± 0.1 days. The result indicates that the variability timescale of the NIR flux was shorter than that of the X-ray flux in the anticorrelated variation event. Next, we compare ts , which is the start time of the variation of the X-ray and NIR fluxes. We define ts as the time when the model of Equation (1) is equal to the mean ± the standard deviation of the X-ray and NIR fluxes for 58,530 < MJD < 58,619. In other words, ts is the time when the pink line (the variability model) exceeds the blue area (the mean ± the standard deviation of the flux) in Figure 2. Here ts was ∼58,588 (2019 April 15) and ∼58,612 (2019 May 9) for the X-ray and NIR bands, respectively. This result indicates that the flux variation in the X-ray band started about 25 days earlier than that in the NIR band.

Figure 2. Variability timescales and start dates of the X-ray and NIR fluxes in the anticorrelated event. The pink line represents the best fit of the model shown in Equation (1). The blue area represents the mean ± the standard deviation of the flux for 58,530 < MJD < 58,619. The solid lines of the X-ray and NIR bands exceed the blue area in MJD 58,588 and MJD 58,612, respectively. This figure is an extended version of the X-ray and NIR light curves in Figure 1.
Download figure:
Standard image High-resolution imageThe NIR spectral index, 9 αNIR, between the KS - and H-band fluxes, which are corrected for the Galactic extinction of AV = 19.6 (Chapuis & Corbel 2004), is shown in the fourth panel from the top of Figure 1. The mean spectral index and its standard deviation for each of XLLS1, XLLS2, the transition period, and the entire XLLS were −2.9 ± 0.6 and 0.4, −3.5 ± 0.5 and 0.1, −3.8 ± 0.4 and 0.2, and −3.5 ± 0.5 and 0.1, respectively. Here αNIR possibly varies between XLLS1 and XLLS2. However, due to large uncertainties in the respective data and only two samples of XLLS1, we cannot conclude that it varies.
There is no clear time-series variation in the PD and EVPA in Figure 1. The null hypothesis of the χ2 test, whose polarization does not vary, cannot be rejected at a 0.05 significance level; the p-values for the PD and EVPA are 0.38 and 0.20. The mean of the PD and median of the EVPA in XLLS2 were 2.42% ± 0.08% and 381 ± 12, respectively. These are roughly consistent with the previous result of PD = 3.7% ± 1.1% and EVPA ∼ 50° (Shahbaz et al. 2008). Shahbaz et al. (2008) calculated the KS
-band maximum interstellar PD to be 3.3%. Note that the interstellar EVPA has not been reported so far. Our results can be explained by the interstellar PD, as well as the results of Shahbaz et al. (2008). The correlation between KS
-band flux and polarization is shown in Figure 3. The correlation coefficients for the PD versus the flux and the EVPA versus the flux were −0.25 and 0.47, respectively. The strength of the correlation between the EVPA and the flux was mild, but it was strongly affected by the EVPA on the day of the highest NIR flux (≳30 mJy, 2019 June 3). Excluding the data, the correlation coefficient between the EVPA and the flux was 0.04. Thus, neither the PD nor the EVPA showed a clear correlation with the flux.

Figure 3. The KS -band flux-polarization diagram in XLLS. The upper panel is PD vs. flux, and the lower panel is EVPA vs. flux. The plot color corresponds to the colors in Figure 1.
Download figure:
Standard image High-resolution imageThe day of the highest NIR flux also had high flux in the X-ray and radio bands. It is possible that the EVPA during this flare is not an outlier but rather shows jet polarization. The EVPA during the flare (∼50°) was closest to perpendicular to the jet position angle of GRS 1915+105, on average 143° (Miller-Jones et al. 2005), compared to the EVPA on other days.
The radio flare lasted for a long period of time (>50 days) in XLLS2, as already pointed out by several authors (Koljonen & Tomsick 2020; Motta et al. 2021). The median and standard deviation of the radio flux from MJD 58,618 (2019 May 15) to MJD 58,715 (2019 August 20), during XLLS2, was 74 ± 26 mJy. This flux level is not obviously brighter than in the past before XLLS1; radio flux levels of ∼100 mJy for several tens of days were reported in the past (Pooley & Fender 1997; Fender et al. 1999; Rodriguez et al. 2008; Punsly & Rodriguez 2016). The highest radio flux in our data during XLLS2 was ∼630 mJy on 2019 June 3. Compared with XLLS2, the radio flux of XLLS1 was weak at ∼4 mJy. The low radio flux of XLLS1 is consistent with Motta et al. (2021). Unfortunately, it is not clear whether the change in the radio flux occurred at the same time as the change in the NIR and X-ray fluxes because of the lack of our radio data during the transition from XLLS1 to XLLS2.
3.2. Historical NIR Light Curve
We define a normal state as the state before entering the XLLS (MJD ≤ ∼58,300, 2018 July 1; Negoro et al. 2018). We assemble published K- and KS -band data (Chaty et al. 1996; Mirabel et al. 1996; Eikenberry & Fazio 1997; Bandyopadhyay et al. 1998; Ueda et al. 2002; Neil et al. 2007; Arai et al. 2009) with reddening correction AK = 2.2 (Chapuis & Corbel 2004) and show a historical light curve in Figure 4. The KS -band flux of ∼15 mJy in the XLLS1 was approximately equal to the lower flux in the normal state. Note that the lowest flux is ∼9 mJy on 1994 June 4. In the XLLS2, the KS -band flux of ∼110 mJy was clearly brighter than that in the normal state. The source became bright with the K- and KS -band flux over 100 mJy with a timescale over tens of days for the first time.
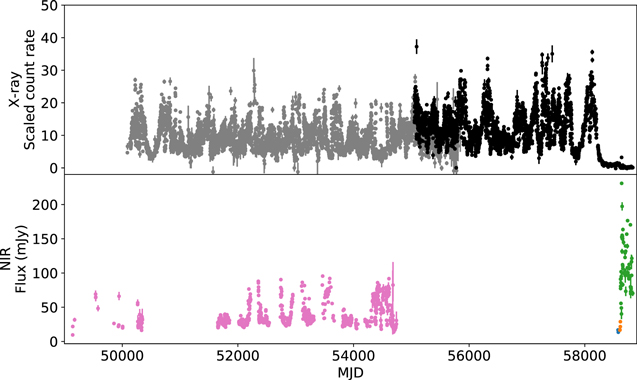
Figure 4. The X-ray and KS - and K-band historical light curves. The upper panel shows the X-ray light curve (gray, RXTE 1.5–2.0 keV; black, MAXI 2.0–4.0 keV), and the lower panel shows the K- and KS -band light curves (pink, previous data; blue, orange, and red, this work.). A reddening correction was performed with AK = 2.2 (Chapuis & Corbel 2004).
Download figure:
Standard image High-resolution image4. Discussion
4.1. The Dereddening Correction for GRS 1915+105
The visual extinction (AV ) for GRS 1915+105 has often been given as AV = 19.6 ± 1.7 (Chapuis & Corbel 2004). This value was derived from the relationship between the visual extinction and total column density of hydrogen (NH) found by Predehl & Schmitt (1995) using X-ray halo data obtained from ROSAT. However, the relationship between AV and NH has been updated, and, using the relationship derived from the detailed analysis of supernova remnant data obtained from the Chandra satellite (Foight et al. 2016), together with NH = (3.5 ± 0.3) × 1022 cm−2 (Chapuis & Corbel 2004), the visual extinction value for GRS 1915+105 becomes AV = 12.2 ± 1.0.
The differences in the values of visual extinction make it difficult to discuss the origin of the NIR emission. The NIR spectral index between the KS - and H-band fluxes becomes 2 or zero if we use AV = 19.6 or 12.2, respectively. These values for alpha are typical values in the NIR bands for the Rayleigh–Jeans part of the blackbody radiation and synchrotron radiation from the thermal component and optically thick jet (e.g., Shahbaz 2019), respectively.
Thus, it is important to use the exact visual extinction for the origin of the NIR emission, but there is a common problem with both papers. The problem is that the value of the hydrogen column density for GRS 1915+105 is quite high compared to the data used in the two papers. The visual extinction of GRS 1915+105 calculated with the relationship in these papers is just an extrapolated value with a large uncertainty. Ideally, we should use the visual extinction estimated directly from the observations of GRS 1915+105 rather than indirectly from these papers. For these reasons, we hereafter do not use these dereddened fluxes when we discuss the origin of the NIR emission. We only use the value of AV = 19.6 to compare our results with the previous ones.
4.2. Comparison between the XLLS and Normal State Based on the NIR Flux
The NIR flux level of XLLS1 was almost the same as that of the normal state at low flux. There is no evidence from our NIR data that XLLS1 is different from the normal state. However, as the X-ray flux in XLLS1 was lower than that in the normal state, it is possible that the properties of the disk and jet are different between XLLS1 and the normal state. This possibility is difficult to verify in the faint NIR flux because the thermal emission from the companion star is dominant in the NIR bands and the jet and disk cannot be observed.
The NIR flux level of XLLS2 was brighter than the flux level of the normal state (Section 3.2). This indicates that XLLS2 is a state that has not been observed before.
4.3. The Origin of the NIR Emission in XLLS1
In XLLS1, the dereddened KS -band flux was low (∼15 mJy with AV = 19.6), and the radio flux was also low (∼4 mJy). In BH-LMXBs, the emissions from the accretion disk and the companion star are expected to dominate in the NIR spectrum during the low radio flux period. In addition, Neil et al. (2007) suggested that thermal emission from the accretion disk is observed when the NIR flux of GRS 1915+105 is low.
Atacama Large Millimeter/submillimeter Array (ALMA) data during the XLLS1 period are available (Koljonen & Hovatta 2021); Figure 5 shows the multiwavelength spectrum for the radio, millimeter, and NIR bands. Note that all of the multiwavelength data are taken on different days. We cannot adapt the visual extinction to the NIR-band fluxes because the exact value of the visual extinction for GRS 1915+105 is unclear (Section 4.1). However, if the value of the visual extinction is AV = 19.6 or 12.2 or falls somewhere in that range, Figure 5 indicates that the jet does not contribute to the NIR bands in XLLS1. This is consistent with our suggestion that the disk and companion emissions contribute to the NIR band of XLLS1.

Figure 5. Multiwavelength spectrum with radio, NIR, and millimeter data in XLLS1. Light-colored points show the multiple-day fluxes, dark-colored points show the mean and standard deviation of the multiday fluxes, circles represent the YI data (8.3 GHz; 2019 February 15 and 2019 March 11), diamonds represent the ALMA data (90.5, 92.5, 102.5, and 104.5 GHz; 2019 March 21), and the upper triangles and crosses represent the Kanata data (KS and H bands; 2019 April 2 and 2019 April 6). The upper triangles and crosses represent the dereddened NIR fluxes for AV = 19.6 and 12.2, respectively.
Download figure:
Standard image High-resolution imageThus, there is a possibility that the origin of the NIR emission in XLLS1 is the thermal emission from the accretion disk and the companion star, rather than the jet emission.
4.4. The Origin and Emission Mechanism of the NIR Emission in XLLS2
In XLLS2, the KS -band and radio fluxes were high (Sections 3.1 and 3.2). The high radio flux and the positive correlation between NIR and radio fluxes imply the jet contribution in the NIR bands in XLLS2.
The comparison of the NIR flux of XLLS2 with that of the normal state was different from the comparison of the radio flux of XLLS2 with the normal state. During the highest NIR flux period of XLLS2 (58,630 < MJD < 58,680), the NIR flux level (∼150 mJy with AV = 19.6) was higher than that of the normal state (∼90 mJy from Neil et al. 2007 with AV = 19.6). On the other hand, the radio flux of XLLS2 was not particularly high compared to that in the normal state (Section 3.1). Furthermore, the radio spectral index (α∼−0.3; Trushkin et al. 2019) during radio flare in XLLS2 was similar to the spectral index (α∼−0.4 ± 0.1) of the Green Bank Interferometer data 10 at a comparable flux level (400–500 mJy at 8 GHz) in the normal state. The comparison of the flux and spectral index of the radio bands implies that the radio emission of the jet in XLLS2 is similar to that in the normal state. In this case, the NIR flux from the jet in XLLS2 may also be similar to that in the normal state. Then, the fact that the NIR flux in XLLS2 was higher than that in the normal state indicates that there is a contribution from sources other than the jet in the NIR bands in XLLS2.
A possible candidate for the nonjet emission in the NIR bands is the blackbody radiation from the outer parts of the standard disk (Shakura & Sunyaev 1973). However, as the soft X-ray flux from the inner parts of the standard disk decreases in XLLS2 (Homan et al. 2019), the contribution of blackbody radiation from the outer parts of the standard disk to the NIR bands is expected to be low. Another possible candidate for the NIR radiation other than the jet is the blackbody radiation from the X-ray obscuration, which is confirmed by X-ray spectral analyses in XLLS2 (Balakrishnan et al. 2021; Koljonen & Tomsick 2020; Miller et al. 2020; Neilsen et al. 2020). The X-ray obscuration is argued to be caused by a failed disk wind (Miller et al. 2020), which is not reaching escape velocity, or a puffed-up outer disk (Neilsen et al. 2020). The X-ray obscuration becomes denser during the transition period from XLLS1 to XLLS2, and it becomes Compton-thick at around the beginning of XLLS2 (Balakrishnan et al. 2021). The period of increasing density of the X-ray obscuration is roughly coincident with the period of increasing NIR flux, suggesting that the X-ray obscuration not only decreases the X-ray flux but also increases the NIR flux.
There are two possible mechanisms for the increase of the NIR flux by the X-ray obscuration.
- 1.The X-ray obscuration forms an NIR photosphere and increases the NIR flux.
- 2.The X-ray obscuration scatters more X-rays than in the normal state, increasing the efficiency of X-ray irradiation to the outer disk, thereby raising its temperature and increasing the NIR flux.
These mechanisms are also discussed in the anticorrelated feature of the X-ray and OIR fluxes in the outburst of GRO J1655–40 in 2005 (Neilsen et al. 2016; Shidatsu et al. 2016). However, we could not determine which of these mechanisms occurred during the transition of GRS 1915+105. If these mechanisms actually occur, then GRS 1915+105 may be in a super-Eddington state in XLLS as well as the similar state in 2005 of GRO J1655-40 (Neilsen et al. 2016; Shidatsu et al. 2016). These mechanisms take time for the X-rays to warm the X-ray obscuration and for the X-ray obscuration to increase its volume and become optically thick, which may explain the result that the start time of the flux variations for X-rays is before the start time for NIR bands in the anticorrelated event (Section 3.1).
To summarize, there is at least a contribution from the jet to the NIR band in XLLS2. Additionally, there is a possible contribution of the thermal radiation from the X-ray obscuration to the NIR band.
4.5. Comparison between the Soft State in 2007 and XLLS2
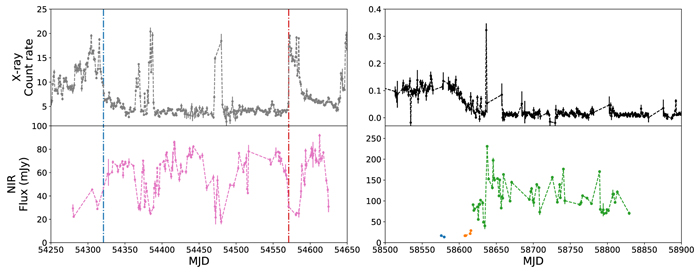
Object GRS 1915+105 also showed the anticorrelated feature of the X-ray and NIR fluxes during the transition to the soft state in 2007 (Arai et al. 2009; Ueda et al. 2009), as well as during the XLLS. Note that the origin and mechanism of the variability of the NIR emission during the soft state in 2007 are not understood (Arai et al. 2009). Figure 6 shows the X-ray and NIR light curves of GRS 1915+105 during the soft state in 2007 and the XLLS. The event similar to the anticorrelation event of the XLLS occurred around MJD 54,321. Arai et al. (2009) mentioned the anticorrelated feature of the X-ray and NIR fluxes during the X-ray flares in the soft state, while not mentioning the feature during the transition to the soft state.
Figure 6. The X-ray and KS -band light curves of GRS 1915+105. The left panels show the data before and after the soft state in 2007, and the right panels show the data during the XLLS1 and XLLS2 in 2019. The upper panels show the X-ray data (gray, RXTE 1.5–2.0 keV; black, MAXI 2.0–4.0 keV), and the lower panels show the KS -band data (pink, Arai et al. 2009; blue, orange, and red, this work.). The blue dashed–dotted line represents the period of transition to the soft state, and the red dashed–dotted line represents the period of the end of the soft state. The beginning and end of the soft state were determined based on the hardness ratio (Arai et al. 2009; Belloni et al. 2000). A reddening correction was performed with AK = 2.2 (Chapuis & Corbel 2004).
Download figure:
Standard image High-resolution image
In addition to the anticorrelated feature, there are two similarities in the NIR band and one similarity in the X-ray band between the soft state in 2007 and XLLS2. One similarity of the NIR band is the persistence of a high KS
-band flux. The other similarity of the NIR band is that the spectral index of the soft state,  (derived from observed H–KS
color = 1.47 ± 0.08; Arai et al. 2009), is consistent with that of XLLS2,
(derived from observed H–KS
color = 1.47 ± 0.08; Arai et al. 2009), is consistent with that of XLLS2,  (our observed H–KS
color = 1.50 ± 0.03). Note that neither of these spectral indices are derived without any reddening correction. There is also a similarity in the X-ray band wherein both X-ray spectra suggest the existence of the X-ray obscuration (Ueda et al. 2009; Neilsen et al. 2016).
(our observed H–KS
color = 1.50 ± 0.03). Note that neither of these spectral indices are derived without any reddening correction. There is also a similarity in the X-ray band wherein both X-ray spectra suggest the existence of the X-ray obscuration (Ueda et al. 2009; Neilsen et al. 2016).
The similarities between the soft state in 2007 and XLLS2 are mentioned above, but there are three clear differences. First, the X-ray hardness ratio in the soft state was soft (Ueda et al. 2009), whereas the X-ray hardness ratio in XLLS2 was hard (Koljonen & Tomsick 2020). Note that the hardness ratio cannot be directly compared between the soft state and XLLS2 because there is no overlap between the RXTE and MAXI observations. This difference can be interpreted as the difference of the intrinsic X-ray spectra before being scattered by the X-ray obscuration. Second, the radio flux of XLLS2 was high (∼80 mJy with AV = 19.6), but that of the soft state was low, except in the radio flare. This may be due to the difference in the mass accretion rate. The model of the X-ray spectra assuming the existence of the X-ray obscuration shows that the Eddington rates of the soft state and XLLS2 are 30%–120% (Ueda et al. 2009) and 1%–2% (Koljonen & Tomsick 2020), respectively, suggesting that the mass accretion rate of the soft state is higher than that of XLLS2. In general, in X-ray binaries, the stable jets are ejected when the accretion rate is low (hard state) and absent when the accretion rate is high (soft state). Note that the nonthermal emission from the steady radio jet in GRS 1915+105 is sometimes observed even in the super-Eddington accretion state (e.g., van Oers et al. 2010). Third, the NIR flux decreased and the radio flux increased during the X-ray flare in the soft state (Arai et al. 2009), but both the NIR and radio fluxes increased during the X-ray flare in XLLS2 (2019 June 3). The reason is unclear.
Even though there are some differences, as mentioned above, several similarities suggest that the soft state in 2007 and XLLS2 may have a common origin of the NIR emission. From the discussion in Section 4.4, there is a possibility that the origins of the NIR emission of XLLS2 are the jet and X-ray obscuration. The differences in the radio fluxes between the two states imply that the origin of the NIR emission of the soft state in 2007 is the X-ray obscuration of XLLS2.
If the origin of the NIR emission of the soft state in 2007 is the X-ray obscuration, the high KS -band flux level (∼150 mJy with AV = 19.6) in XLLS2 can be explained. Neil et al. (2007) suggested that the high flux level of the nonthermal component is ∼90 mJy with AV = 19.6 based on the correlation between X-ray and NIR fluxes. The nonthermal component can be interpreted as the jet. In addition, the high KS -band flux level in the 2007 soft state, which may have the emission from the X-ray obscuration, is ∼80 mJy with AV = 19.6 (Arai et al. 2009). Subtracting the KS -band flux of the companion star (∼10 mJy with AV = 19.6; Rahoui et al. 2010) from the sum of the two flux levels, we roughly obtain a flux level of ∼150 mJy for XLLS2.
5. Conclusion
We have provided the results of the NIR observations from 2019 April–December in the XLLS using HONIR attached to the Kanata telescope, including the radio data from the Yamaguchi Interferometer and the archival X-ray data. Over the course of several tens of days, we found that in XLLS2, there was a historical NIR brightening (∼110 mJy with AV = 19.6). During the XLLS, the NIR flux showed a positive correlation with the radio flux and a negative correlation with the X-ray flux. These results suggested a possible contribution of the jet to the NIR bands in XLLS2. However, the radio flux did not show a historical brightening, implying that the jet emission is not necessarily the only origin of the NIR brightening in XLLS2. The rough timing coincidence of the increase between the NIR flux and hydrogen columns density of the X-ray obscuration (Balakrishnan et al. 2021) suggested that the nonjet NIR emission might come from the X-ray obscuration.
We would like to thank the staff of the Higashi-Hiroshima Observatory and the Yamaguchi Interferometer for their observations and providing data. We would like to thank Dr. Murata for providing us with Kanata data from the OISTER Program. We appreciate the anonymous referee for useful suggestions that helped to improve the original manuscript. This work was supported by JSPS KAKENHI grant Nos. JP19K14761 and JP20K04013. This research was partially supported by the Optical & Near-Infrared Astronomy Inter-University Cooperation Program, and the MEXT of Japan. This research has made use of MAXI data provided by RIKEN, JAXA, and the MAXI team.
Footnotes
- 7
- 8
- 9
Here the spectral index α is defined as fν ∝ να , where fν is the flux density (mJy) and ν is the frequency.
- 10
Public domain data from the NSF-NRAO-NASA Green Bank Interferometer. Data can be taken from https://www.gb.nrao.edu/fgdocs/gbi/plgbi/plgbi.html.