


Abstract
We present deep Keck/MOSFIRE near-infrared spectroscopy of a strong Lyα emitting source at z = 6.1292, HSC J142331.71−001809.1, which was discovered by the SHELLQS program from imaging data of the Subaru Hyper Suprime-Cam (HSC) survey. This source is one of five objects that show narrow (FWHM < 500 km s−1) and prominent (LLyα > 1044 erg s−1) Lyα emission lines at absolute 1450 Å continuum magnitudes of M1450 ∼ −22 mag. Its rest-frame Lyα equivalent width (EW) is 370 ± 30 Å. In the 2 hr Keck/MOSFIRE spectrum in Y band, the high-ionization C iv λλ1548,1550 doublet emission line was clearly detected with  km s−1 and a total rest-frame EW of
  Å. We also report the detection of weak continuum emission, and the tentative detection of O iii]λλ1661,1666 in the 4 hr J-band spectrum. Judging from the UV magnitude, line widths, luminosities, and EWs of Lyα and C iv, we suggest that this source is a reionization-era analog of classical type-II AGNs, although there is a possibility that it represents a new population of AGN/galaxy composite objects in the early universe. We compare the properties of J1423−0018 to intermediate-redshift type-II AGNs and C iv emitters seen in z = 6–7 galaxy samples. Further observations of other metal emission lines in the rest-frame UV or optical, along with X-ray follow-up observations of the z = 6–7 narrow-line quasars, are needed for more robust diagnostics and to determine their nature.
Export citation and abstract BibTeX RIS
1. Introduction
The last two decades have yielded remarkable success in the discovery of unobscured quasars in the reionization epoch (z > 6). Thanks to the advent of wide-field surveys such as the Sloan Digital Sky Survey (e.g., Jiang et al. 2016) and Pan-Starrs1 (e.g., Bañados et al. 2016), more than 200 z > 5.7 quasars have been reported, with redshifts up to z ∼ 7.6 (Bañados et al. 2018; Yang et al. 2020; Wang et al. 2021). Most of the luminous z > 6 quasars (with bolometric luminosity Lbol > 1046 erg s−1) are powered by billion-solar-mass supermassive black holes (SMBHs), which is remarkable given the fact that the universe is less than one billion years old at z > 6. How such massive SMBHs could form at z > 6 has been the focus of active discussion in the literature (Inayoshi et al. 2020, for a recent review).
However, these optical (rest-frame UV) quasar surveys have not been sensitive to obscured quasars. Only a handful of candidate type-II active galactic nuclei (AGNs) are known at z ≳ 6. They have been identified as either radio galaxies (Saxena et al. 2018) or companion X-ray sources of luminous unobscured quasars (Connor et al. 2019; Vito et al. 2019). 19 Luminous type-II AGNs whose bolometric luminosities are high enough to be classified as quasars have been identified at z < 4 through observations at various wavelength ranges: optical (e.g., Zakamska et al. 2003; Alexandroff et al. 2013; Yuan et al. 2016), infrared (e.g., Stern et al. 2012; Lacy et al. 2015; Glikman et al. 2018), X-ray (e.g., Stern et al. 2002; Szokoly et al. 2004), and radio (e.g., van Breugel et al. 1999; De Breuck et al. 2000b). The intrinsic luminosities and degree of obscuration depend strongly on the selection criteria, making it challenging to compare results from different samples. Yet at z < 0.8, Reyes et al. (2008) suggest that type-II quasars are as abundant as type-I quasars at fixed [O iii] λ5007 luminosity (L[OIII] > 108.3 L⊙). Sensitive X-ray observations also showed that the obscured (NH > 1023 cm−2) fraction is >60% at 3 < z < 6, increasing from lower redshift (Ueda et al. 2003, 2014; Vito et al. 2018). Those high-redshift obscured type-II quasars and AGNs are useful probes of the metal enrichment of host galaxies, because their narrow emission lines trace host-scale ionized gas, unlike broad emission lines from the nuclear region. Radio galaxy observations have found no significant redshift evolution of the narrow-line-region metallicity up to z ∼ 5 (Nagao et al. 2006; Matsuoka et al. 2009, 2011; Maiolino & Mannucci 2019).
Obscuration of AGNs can occur at different scales within the host galaxies. The standard AGN unification models explain the two types of AGNs as due to different viewing angles to the central accretion disks (e.g., Antonucci 1993; Urry & Padovani 1995). In this framework, type-II AGNs are observed when the observers' lines of sight are obscured by optically thick dusty material that blocks the nuclear emission at ≲10 pc from the central SMBHs. An alternative model suggests that the obscured AGNs constitute a transitional phase during a gas-rich galaxy major merger (e.g., Hopkins et al. 2006); obscured AGNs appear when SMBHs first ignite, surrounded by dust in the host galaxy generated by a merger-induced starburst. In these models, one predicts a population of dust-reddened broad-line quasars before the strong radiation pressure from the AGN completely expels the surrounding dust. This modestly obscured population of so-called red quasars and dust-obscured galaxies has been observed over a broad range of redshift (e.g., Richards et al. 2003; Urrutia et al. 2008; Glikman et al. 2012; Assef et al. 2013; Ross et al. 2015; Toba et al. 2018; Kato et al. 2020). Theoretical studies have recently suggested that the initial intense growth of SMBHs at high redshift is accompanied by high column-density gas and dust in the host galaxies, and such host-scale gas and dust can significantly contribute to the observed optical depth (Trebitsch et al. 2019; Davies et al. 2019; Ni et al. 2020). Thus, there is particular interest in identifying red and obscured AGN at high redshift, because those type-II objects may provide clues to the initial growth of SMBHs as well as dust and chemical enrichment in the host galaxies.
1.1. Narrow-line Population in the z = 6–7 Low-luminosity Quasar Sample
A 1000 deg2-class optical survey with the Hyper Suprime-Cam (Miyazaki et al. 2018) mounted on the 8.2 m Subaru telescope (Aihara et al. 2018) has enabled the deepest investigation to date of the faint end of the quasar luminosity function at high redshift. With this survey, the Subaru High-z Exploration Low-Luminosity Quasar (SHELLQs) project has found 93 quasars at 5.7 ≤ z ≤ 7.1 in the low-luminosity range (down to bolometric luminosity Lbol ∼ 1045 erg s−1, or 1450 Å absolute magnitude M1450 ∼ −22) (Matsuoka et al. 2016, 2018a, 2018b, 2019a, 2019b). Those objects were selected with a standard color cut that makes use of red i − z and z − y colors of z ∼ 6 and z ∼ 7 quasars, respectively. In the SHELLQs project, quasar candidates are required to be point sources in their HSC images (typical seeing of 0.7 arcsecond in the z and y bands). Their UV magnitudes were derived by extrapolating the observed optical continua (rest-frame λrest ≈ 1220–1350 Å) to rest-frame 1450 Å, assuming the fiducial power-law slope (e.g., Vanden Berk et al. 2001) of αλ
= −1.5 ( ). The Lyα properties were measured by subtracting the underlying continuum flux that is estimated by pixels redward of Lyα. Please refer to Matsuoka et al. (2019b) for more details on the sample selection and discovery observations.
The luminosity function of z = 6 quasars overlaps that of dropout galaxies at M1450 = −23 mag (Ono et al. 2018; Matsuoka et al. 2018c); therefore, we cannot assume that the observed rest-UV continua and emission lines of the faintest SHELLQs objects are purely from the nuclear regions. The host stellar light contamination to the rest-UV quasar continuum at z > 4 has recently been discussed both theoretically (Trebitsch et al. 2020) and observationally (Adams et al. 2020; Bowler et al. 2021).
Intriguingly, 16 of the spectroscopically confirmed SHELLQs quasars (∼20% of the sample) show narrow Lyα emission with FWHM < 500 km s−1 (Matsuoka et al. 2018a, 2019b), while typical broad emission lines of type-I quasars have FWHM = several 1000 km s−1. We tentatively refer to this population as narrow-line quasars, as their Lyα luminosities of 1043-44 erg s−1 are in the range of AGNs at lower redshifts (Sobral et al. 2018; Spinoso et al. 2020), and are comparable to those of the 2 < z < 4 type-II quasar candidates of Alexandroff et al. (2013). Another possible AGN signature is seen in a weak P-Cygni-like profile of the high-ionization N v λ1240 line (ionization potential: 77.4 eV) tentatively detected in the composite spectrum of the narrow-line objects (Matsuoka et al. 2018a, 2019b). The low signal-to-noise ratio of the spectra precludes identifying the presence of interstellar absorption in the rest-frame UV continuum. Figure 1(a) shows that the narrow-line objects have some of the lowest UV continuum luminosities in the SHELLQs sample. However, their Lyα luminosities are significantly higher than those of the broad-line SHELLQs quasars with similar UV magnitudes, suggesting that they comprise a distinct population. Their Lyα brightness is comparable to, or even larger than, those of z = 5.7 and z = 6.6 Lyα emitters (LAEs) identified in the deep and ultradeep layers of the HSC survey (Shibuya et al. 2018), as well as luminous 2 < z < 3 LAEs presented in Sobral et al. (2018). Five sources stand out as being very faint in the UV continuum (MUV > −22 mag) and extremely bright in Lyα (LLyα > 1044 erg s−1) (Matsuoka et al. 2018a, 2019b). In Figure 1(a), we highlight those five objects with large symbols. Those features cause us to speculate that the SHELLQs narrow-line population represents the obscured counterpart to the broad-line quasars at the reionization epoch. This population is so faint optically that it could not be probed with previous shallower surveys.

Figure 1. (a) The absolute UV magnitude—Lyα luminosity plane of quasars and LAEs. The z = 6–7 narrow-line and broad-line SHELLQs quasars (Matsuoka et al. 2016, 2018a, 2018b, 2019a, 2019b) are shown as red filled and open diamonds, respectively. The five extreme narrow-line objects with MUV > −22 and  are highlighted with large symbols. The red dashed line shows a linear fit to the broad-line quasars. For comparison, spectroscopically confirmed HSC LAEs at z = 5.7 and 6.6 (Shibuya et al. 2018) are shown as green crosses. A luminous star-forming galaxy at z = 2.5 (BOSS-EUVLG1; Marques-Chaves et al. 2020) at MUV = −24.40 ± 0.05 mag and
  erg s−1 is shown as a green triangle. Type-II quasar candidates at 2 < z < 4 from the SDSS BOSS survey (Alexandroff et al. 2013, their Class A objects) are indicated with blue dots. The composite spectrum of narrow-line AGNs at 2 < z < 3 from Hainline et al. (2011) is shown as a purple diamond. The 2 < z < 3 LAEs from Sobral et al. (2018) are shown in gray, for which three different symbols indicate different classifications: narrow-line AGNs (FWHMLyα
< 1000 km s−1; filled diamonds), broad-line AGNs (FWHMLyα
≥ 1000 km s−1; open diamonds), and galaxies (crosses). The Lyα luminosity of J1423−0018 is significantly larger than those of the broad-line SHELLQs quasars of similar UV continuum magnitude, as well as those of known LAEs. Horizontal and vertical dashed lines show the knee of the Lyα luminosity function at z = 5.7 (
erg s−1 is shown as a green triangle. Type-II quasar candidates at 2 < z < 4 from the SDSS BOSS survey (Alexandroff et al. 2013, their Class A objects) are indicated with blue dots. The composite spectrum of narrow-line AGNs at 2 < z < 3 from Hainline et al. (2011) is shown as a purple diamond. The 2 < z < 3 LAEs from Sobral et al. (2018) are shown in gray, for which three different symbols indicate different classifications: narrow-line AGNs (FWHMLyα
< 1000 km s−1; filled diamonds), broad-line AGNs (FWHMLyα
≥ 1000 km s−1; open diamonds), and galaxies (crosses). The Lyα luminosity of J1423−0018 is significantly larger than those of the broad-line SHELLQs quasars of similar UV continuum magnitude, as well as those of known LAEs. Horizontal and vertical dashed lines show the knee of the Lyα luminosity function at z = 5.7 ( erg s−1; Konno et al. 2018), and the UV luminosity function at z ∼ 6 (
 mag; Ono et al. 2018). (b) The optical spectrum of J1423−0018 taken by Subaru/FOCAS (Matsuoka et al. 2018a). The inset shows the Lyα wing and the expected location of N v
λλ1239, 1243. The spectrum in the inset is smoothed with a Gaussian kernel of σ = 1 pixel. The error spectrum is shown in cyan.
mag; Ono et al. 2018). (b) The optical spectrum of J1423−0018 taken by Subaru/FOCAS (Matsuoka et al. 2018a). The inset shows the Lyα wing and the expected location of N v
λλ1239, 1243. The spectrum in the inset is smoothed with a Gaussian kernel of σ = 1 pixel. The error spectrum is shown in cyan.
Download figure:
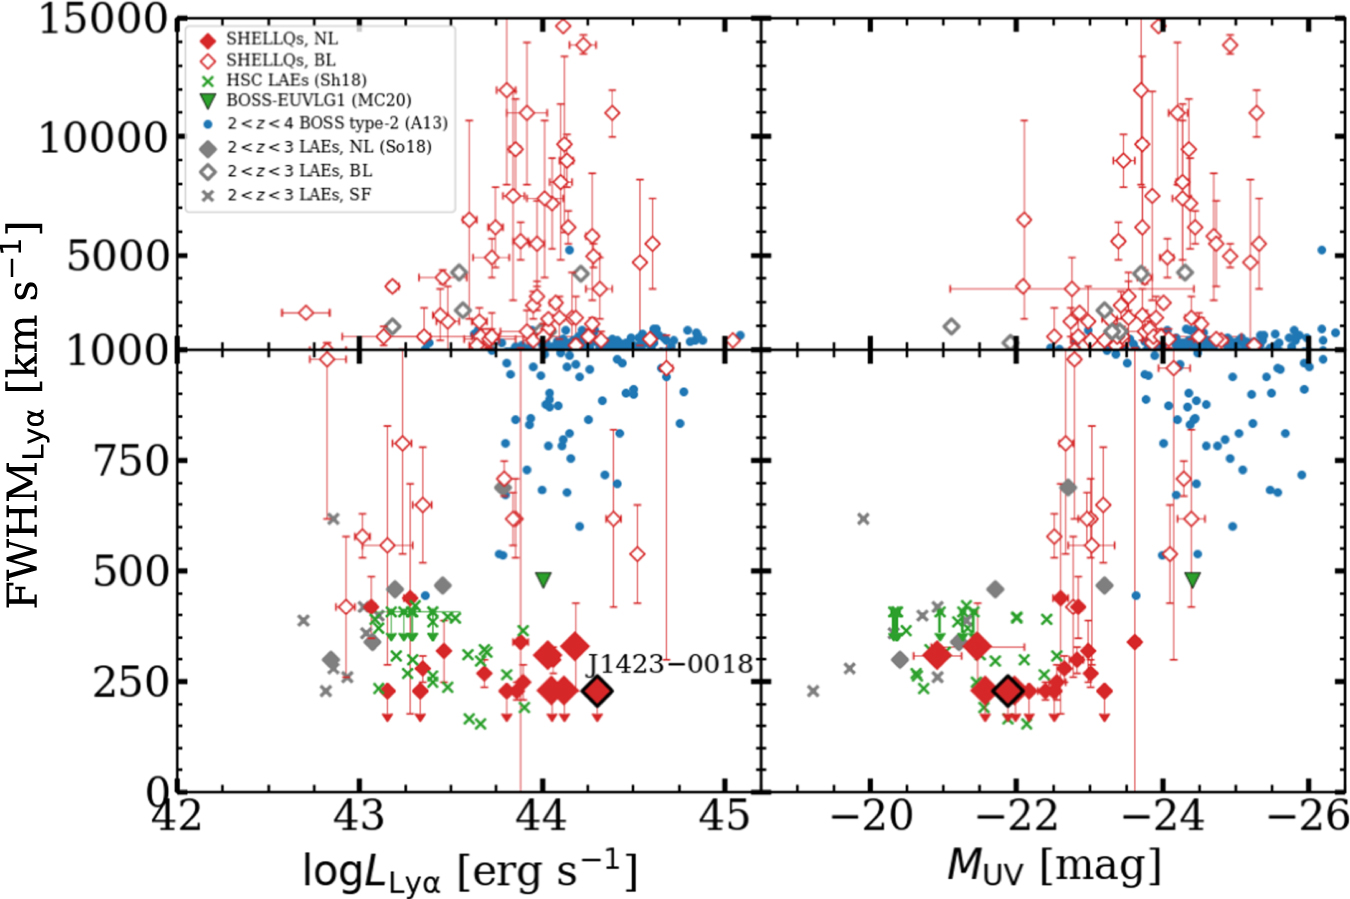
Standard image High-resolution imageIn this paper, we present Keck/MOSFIRE follow-up observations of HSC J142331.71-001809.1 (hereafter J1423−0018) at z = 6.1292. This object was discovered in Matsuoka et al. (2018a). J1423−0018 is one of the five extreme narrow-line SHELLQs quasars, and it was chosen for near-infrared spectroscopy because it has the highest Lyα luminosity (LLyα = 1044.30±0.01 erg s−1) of all the narrow-line objects discovered in SHELLQs. The rest-frame equivalent width of Lyα is EWrest(Lyα) = 370 ± 30 Å. Figure 1(b) shows its discovery spectrum in the optical. It is one of the faintest SHELLQs sources in the continuum (M1450 = −21.88 ± 0.20 mag); its Lyα redshift is z = 6.13. Note that N v λλ1239,1243 is not detected, but there are strong OH sky emission lines at the wavelengths of the expected line centers. This object shows a remarkably large Lyα rest-frame equivalent width of EWrest(Lyα) = 370 ± 30 Å, and the highest Lyα luminosity among the narrow-line population, with LLyα = 1044.30±0.01 erg s−1. The Lyα line is not resolved (FWHM < 230 km s−1) in the discovery spectrum (Figure 1(b)). Figure 2 plots Lyα FWHM as a function of Lyα and UV luminosities for J1423−0018 and the objects shown in Figure 1(a).

Figure 2. Lyα FWHM vs. Lyα luminosities (left) and UV magnitudes (right) for the objects shown in Figure 1(a). The symbol types are the same as in that figure. Note that the y-axis scale is different in the lower and upper panels. The five extreme SHELLQs NL objects, including J1423−0018, lie in the most Lyα luminous ( [erg s−1]) and UV continuum faintest (MUV > −22 mag) ranges.
Download figure:
Standard image High-resolution imageThroughout this paper, all magnitudes quoted are on the AB system. We adopt a standard ΛCDM cosmology with H0 = 70 km s−1 Mpc−1, Ωm = 0.3, and ΩΛ = 0.7.
2. Keck/MOSFIRE Spectroscopy
We carried out near-infrared spectroscopic observations of J1423−0018 with MOSFIRE (McLean et al. 2012) on the Keck I telescope on the first half of the nights of 2019 June 6 and 7 (program ID: S19A-102
20
). J1423−0018 was observed in the Y and J bands together with filler sources, covering the wavelength ranges of 9716–11250 Å and 11530–13520 Å, respectively. Those filler sources included a z ∼ 1 radio galaxy and two z ∼ 4 quasar candidates newly identified in the HSC survey. A more detailed description and analysis of those objects will be presented elsewhere. The mask also included a point source for flux calibration of the science targets, as described below. Those five targets were aligned to custom slitmasks with bright reference stars in the target field. We selected the 0 7-wide slit to perform our spectroscopy, giving spectral resolutions of R = 3388 in the Y band and R = 3318 in the J band. Individual exposure times were 180 s in Y and 120 seconds in J, respectively. The total exposure times were 2.0 hr in Y and 3.8 hr in J. During the exposures, we employed a four-point (ABA' B') dither pattern to maximize the quality of the faint source spectra. The nodding amplitudes of the AB and A'B' pairs were 27, or 15 pixels, with a relative offset of 0.3 arcseconds between the two pairs. During the observations, the seeing ranged from 04 to 09 and the targets were observed at airmass 1.1–1.5.
The raw data were reduced with the MOSFIRE Data Reduction Pipeline in the standard way. One-dimensional spectra were extracted with a boxcar aperture twelve pixels (22) wide, roughly twice the seeing. This wide aperture was motivated by the spatial extent of C iv
λλ 1548,1550 and O iii]
λ1666, and the apparent extended O iii]
λ1661 signal visible in the two-dimensional J-band spectrum (Section 3). The central pixel of the object trace was determined from the spatial profile of the C iv emission lines. The positive signal that we interpret as O iii]
λ1666 (Section 3) is centered on the extraction aperture. Telluric absorption was corrected with long-slit observations of A0-type stars. The point source observed in the field (α, δ = 14:23:47.81,−00:17:52.2) has NIR photometry from the VIKING DR3 (Edge et al. 2013; YAB = 17.966 ± 0.009, JAB = 17.811 ± 0.009); we used this for spectrophotometric flux calibration. The Y-band exposures taken during the two nights were all stacked before one-dimensional extraction to efficiently remove cosmic-ray hits on the detectors, while the J-band exposures were stacked separately for each night before extraction. The final J-band spectrum is an inverse-variance weighted mean of the spectra from the two nights.
3. Results
The MOSFIRE spectrum covers various UV emission lines at rest-frame 1370–1895 Å. We measured the emission line fluxes (or upper limits) of Si iv λλ 1393, 1402, N iv λλ 1483, 1487, C iv λλ1548, 1550 in the Y band, and He ii λ1640, O iii] λλ1661, 1666, and Si iii λλ1883, 1892 in the J band.
The top two panels of Figure 3 showcase the MOSFIRE spectrum at the wavelengths of those emission lines. The C iv λλ1548, 1550 doublet, which is usually observed as a blended single line in a broad-line quasar, was clearly detected as two distinct lines. Note in particular both the positive and negative signals from each of the lines of the doublet in the two-dimensional spectrum. The detection significance of the two lines in the one-dimensional spectrum is 6.6 and 4.5 sigma, respectively, when the continuum-subtracted signals are integrated over ±2 FWHM from the line centers.

Figure 3. The Keck/MOSFIRE spectrum of J1423−0018 around the rest-frame UV emission lines (Si iv λλ 1393, 1402, N iv] λλ 1483, 1487, and C iv λλ 1548, 1550 in the first row, and He ii λ 1640, O iii] λλ 1661, 1666, and Si iii] λλ 1883, 1892 in the second row). Both two- and one-dimensional spectra are shown for each line region. The two-dimensional spectrum is not corrected for telluric absorption, nor has it been relative/absolute flux calibrated. It has been smoothed with a Gaussian kernel with σ = 1 pixel, where positive/negative signals are shown in white/black. The extraction aperture in the two-dimensional spectra is indicated with black dashed lines. The ±1σ flux error is shown as the gray shading in the one-dimensional spectra. The line centers expected from the measured C iv redshift are marked in the one-dimensional spectra with dark blue dashed lines. For the J band, we also show the one-dimensional spectrum obtained by stacking all the two-dimensional frames taken on the two observing dates before extraction (cyan).
Download figure:
Standard image High-resolution imageFigure 4 shows that the trace of a weak continuum is visible in the J band. The robustness of the continuum detection is supported by the mean spatial profile of the Gaussian-smoothed (σ = 1 pixel) two-dimensional spectrum. The extracted one-dimensional spectrum (with 15-pixel binning) is clearly positive over the J band. The spectroscopic magnitude of this continuum component is J = 24.71 ± 0.24 mag.
21
We masked wavelengths between 1.26 and 1.28 microns in determining the continuum level, due to the presence of strong lines of O2 in the atmosphere. There is no J-band photometry available for this source. Fitting the continuum of J1423−0018 to a power law, we estimated the UV slope to be β = −2.3 ± 1.2, where β is defined as Fλ
∝ λβ
, based on the HSC-y and the spectroscopic J-band magnitudes. This continuum slope is bluer than that of the z ∼ 2 narrow-line quasars in (Hainline et al. 2011, β = −0.5), but is consistent with those of UV dropout galaxies (−2.5 < β < −1.5; Bouwens et al. 2020). We fit the β = −2.3 power-law continuum model to the unbinned J-band spectrum to estimate the absolute 1450 Å magnitude. We find  mag, which is slightly brighter than the value of M1450 = −21.88 ± 0.20 mag reported by Matsuoka et al. (2018a).

Figure 4. The full two- (top) and one-dimensional (bottom) J-band spectrum. The two-dimensional spectrum is smoothed with a σ = 1 pixel Gaussian kernel. In the bottom panel, the cyan shows the 15-pixel binned spectrum (19.5 Åper bin). The best-fit power-law continuum model with β = −2.3, for which λobs = 12600–12800 Å is masked, is shown in red. The masked wavelength range is shown in gray. The right panel is the inverse-variance-weighted mean spatial profile of the smoothed spectrum, in which the averaged continuum flux is detected within the extraction aperture. The expected positions of the negative traces are marked with tick marks.
Download figure:
Standard image High-resolution imageThe results of our line measurements are reported in Table 1. We assumed that C iv
λ1548 and C iv
λ1550 originate from the same ionized gas, and thus fit them to the same line widths and redshifts. The errors quoted in Table 1 were derived by a Monte Carlo simulation of 1000 mock spectra, in which random noise was added to the original spectrum given the estimated flux error at each pixel. Therefore, the uncertainty of our continuum measurement is taken into account in the error budgets of the emission line properties. The 1σ uncertainties were determined from the 16th and 84th percentiles. We measured a C iv redshift of zCIV = 6.1292 ± 0.0002. There is a modest C iv velocity blueshift of ΔvCIV − Lyα
= −30 ± 9 km s−1 with respect to Lyα. This C iv redshift is our best estimate at this point of the systemic redshift of J1423−0018, although C iv is a resonant line that is possibly red/blueshifted from nebular emission lines. The velocity offset between Lyα and C iv may be attributed to the fact that kinematics of the gas is different between neutral and highly ionized gas (Steidel et al. 2010). The line width after correcting for instrumental broadening is  km s−1. A fit forced to the instrumental resolution of FWHM = 88 km s−1 gave a significantly worse χ2. Thus, we are confident that the C iv doublet line is resolved. Both lines of the doublet are strong, with the flux ratio of C iv
λ1548/C iv
λ1550 = 1.3. Their rest-frame equivalent widths are
km s−1. A fit forced to the instrumental resolution of FWHM = 88 km s−1 gave a significantly worse χ2. Thus, we are confident that the C iv doublet line is resolved. Both lines of the doublet are strong, with the flux ratio of C iv
λ1548/C iv
λ1550 = 1.3. Their rest-frame equivalent widths are  Å and
Å and  Å, respectively; therefore, the total equivalent width is
  Å.
Å.
Table 1. Emission Line Properties of J1423−0018
| Line | λrest | λobs | Fline | EWrest | ΔvLyα |
|---|---|---|---|---|---|
| (Å) | (Å) | (10−17 erg cm−2 s−1) | (Å) | (km s−1) | |
| Lyα | 1215.67 | 8667.7 | 47.60 ± 0.01 | 370 ± 30 | ⋯ |
| N v | 1238.82 | sky | ⋯ | ⋯ | ⋯ |
| ⋯ | 1242.80 | sky | ⋯ | ⋯ | ⋯ |
| Si iv | 1393.76 | ⋯ | <0.73 | <6.3 | ⋯ |
| ⋯ | 1402.77 | ⋯ | <0.91 | <8.3 | ⋯ |
| N iv | 1483.3 | sky | ⋯ | ⋯ | ⋯ |
| ⋯ | 1486.5 | ⋯ | <0.74 | <7.5 | ⋯ |
| C iv | 1548.19 |

|

|

|

|
| ⋯ | 1550.77 |

|

|

| |
| He ii | 1640.42 | sky | ⋯ | ⋯ | ⋯ |
| O iii] | 1660.81 |

|

|

|

|
| ⋯ | 1666.15 |

|

|

| |
| Si iii] | 1882.71 | sky | ⋯ | ⋯ | ⋯ |
| ⋯ | 1892.03 | ⋯ | <−0.02 | <−0.4 | ⋯ |
Notes. The emission line fluxes and rest-frame equivalent widths were measured after subtracting the continuum emission, which was estimated by fitting a β = −2.3 continuum to the J-band spectrum. The 2σ upper limits of the line fluxes and rest-frame equivalent widths are provided for undetected lines, except for those overlapping with strong OH sky emission lines. The Lyα line flux and rest-frame EW are taken from Matsuoka et al. (2018a). For the velocity offsets with respect to Lyα (ΔvLyα ), negative values indicate blueshifts of the metal lines. The quoted line flux of the Si iii] doublet, which falls at the red edge of the J-band spectrum, is negative because the observed flux is smaller than the power-law continuum model.
Download table as: ASCIITypeset image
We searched for other emission lines and found weak signals at the wavelengths where the O iii] doublet lines (λλ1661, 1666) are expected based on the C iv redshift. There is apparent O iii] λ1666 emission at λobs ∼ 11875 Å in the stacked spectrum. This flux excess is clear in the stacked spectra of each of the observing dates. Flux excess is also seen at λobs ∼ 11840 Å where O iii] λ1661 is expected. This signal is slightly offset from the aperture center (Figure 3) determined by C iv, but it is included in the 2.2 arcsecond aperture that we employed to measure all the detected signal from C iv and O iii] λ1666. The detection significance of the O iii] doublet emission lines is modest, at 3.3 and 3.0 sigma for O iii] λ1661 and O iii] λ1666, respectively.
In addition, there is a positive flux excess between the two O iii] peaks at λrest ∼ 1663 Å with a significance of 1–2 sigma per pixel in the 1D spectrum. This feature remains when all the two-dimensional frames taken on the two observing dates were stacked before extraction (cyan line in Figure 3). Since its peak flux density is comparable to the two O iii] lines and its nature is unclear, we conclude that the excess at λrest ∼ 1666 Å and especially at 1661 Å cannot be conclusively attributed to O iii] emission.
Despite this uncertainty, we measured the O iii] profiles while ignoring the third peak at λrest ∼ 1663 Å. As with our C iv fit, we fit each of the O iii]
λ1661 and O iii]
λ1666 lines with a single Gaussian profile with a common velocity offset with respect to Lyα. The line width was fixed to that of C iv convolved with the J-band resolution. The O iii] velocity offset is ![${\rm{\Delta }}{v}_{\mathrm{OIII}]-\mathrm{Ly}\alpha }=-{90}_{-16}^{+14}$](https://content.cld.iop.org/journals/0004-637X/919/1/61/revision1/apjac0f07ieqn28.gif) km s−1 (zOIII] = 6.1279 ± 0.0004), which is three times larger than that of C iv. If this tentatively detected O iii] traces the systematic redshift of J1423−0018, the Lyα velocity offset is still small compared to z > 6 galaxies, which often show ≪ −100 km s−1 (see the compilations of Hashimoto et al. 2017; Hutchison et al. 2019). More robust detection of O iii] or other lines such as rest-frame far-IR [C ii] 158 μm or [O iii] 88 μm is required to confidentially investigate the Lyα offset of J1423−0018. The flux ratio is O iii]
λ1661 / O iii]
λ1666 = 1.0, while Hainline et al. (2011) report flux ratios of 3.4 for their 2 < z < 3 type-II objects. The rest-frame equivalent widths are
km s−1 (zOIII] = 6.1279 ± 0.0004), which is three times larger than that of C iv. If this tentatively detected O iii] traces the systematic redshift of J1423−0018, the Lyα velocity offset is still small compared to z > 6 galaxies, which often show ≪ −100 km s−1 (see the compilations of Hashimoto et al. 2017; Hutchison et al. 2019). More robust detection of O iii] or other lines such as rest-frame far-IR [C ii] 158 μm or [O iii] 88 μm is required to confidentially investigate the Lyα offset of J1423−0018. The flux ratio is O iii]
λ1661 / O iii]
λ1666 = 1.0, while Hainline et al. (2011) report flux ratios of 3.4 for their 2 < z < 3 type-II objects. The rest-frame equivalent widths are  Å for O iii]
λ1661 and
Å for O iii]
λ1661 and  Å for O iii]
λ1666, for a total of
Å for O iii]
λ1666, for a total of  Å. We emphasize again that these O iii] measurements must be interpreted with caution.
No significant excess was identified from the other emission lines we covered with MOSFIRE, thus we report 2σ upper limits of the fluxes and equivalent widths in Table 1. Those upper limits were derived by integrating continuum-subtracted fluxes of the mock spectra over the wavelength ranges of ±2 FWHM of C iv from the line centers expected from the C iv redshift, and measuring the 16th and 84th percentiles. We could not derive any useful constraints on N iv] λ1483, He ii, or Si iii] λ1883, as those lines overlap with strong sky emission lines.
4. Discussion
The line widths of Lyα (FWHM < 230 km s−1) and C iv ( km s−1) in J1423−0018 are much narrower than those of typical type-I quasars, and even narrower than those of local narrow-line Seyfert 1 galaxies (FWHM ∼ 500–2000 km s−1; e.g., Constantin & Shields 2003), whereas local Seyfert 2 galaxies (Veilleux 1991) and low-redshift narrow-line AGNs (Zakamska et al. 2003; Hao et al. 2005) show lines with widths ≲500 km s−1. Therefore, J1423−0018 is a good candidate to be a reionization-era analog to classical type-II AGNs. In this section, we discuss how J1423−0018 is compared with various types of type-II AGNs and galaxies in the literature based on the rest-frame UV properties.
4.1. Lyα and C iv Properties
We first explore the possibility that J1423−0018 is an extreme LAE powered solely by star formation. In this context, the high luminosity of Lyα (1044.30±0.01 erg s−1) and C iv (1043.2±0.2 erg s−1) in J1423−0018 are unique. Figure 5 shows that the Lyα luminosity of J1423−0018 is ≳0.5 dex higher than objects in the sample of z = 6–7 Lyman break galaxies and LAEs compiled in Matthee et al. (2017). Konno et al. (2018) found that the z = 5.7 and z = 6.6 Lyα luminosity functions have an excess relative to their Schechter function fit above LLyα
∼ 1043.5 erg s−1. This bright-end excess could be due to significant AGN contribution, as has been argued at lower redshift (Konno et al. 2016; Spinoso et al. 2020; Zhang et al. 2021). Spectroscopic follow-up observations of 2 < z < 3 LAEs by Sobral et al. (2018) found that the AGN fraction reaches 100% at  and
and  , where
  and
and  are the knee luminosities of the Lyα and the UV luminosity functions, respectively. Their AGN/galaxy classification was based on strong N v emission (N v/Lyα >0.1), and line ratio diagnostics based on C iv/He ii and C iii]/He ii. J1423−0018 satisfies both of the LLyα
and LUV thresholds at z ∼ 6, with
are the knee luminosities of the Lyα and the UV luminosity functions, respectively. Their AGN/galaxy classification was based on strong N v emission (N v/Lyα >0.1), and line ratio diagnostics based on C iv/He ii and C iii]/He ii. J1423−0018 satisfies both of the LLyα
and LUV thresholds at z ∼ 6, with  (
( erg s−1 at z = 5.7; Konno et al. 2018), and
  (
( mag; Ono et al. 2018). Calhau et al. (2020) used X-ray and radio detections to show that the AGN fraction of LAEs decreases toward high redshift. Although their constraints are poor at z ∼ 3.5–6, objects in their sample with luminosity above LLyα
= 1044 erg s−1 and z ∼ 2–6 are dominated by AGN. However, the high luminosities of the UV continuum and Lyα alone may not be sufficient to prove that J1423−0018 is an AGN. For example, Marques-Chaves et al. (2020) discovered a blue star-forming galaxy at z = 2 (BOSS-EUVLG1) that has LLyα
= 1044.0±0.1 erg s−1, comparable to J1423−0018 (see Figures 1 and 2). It is unlikely that this particular source is the same population as J1423−0018, because the continuum luminosity of BOSS-EUVLG1 (MUV = −24.40 ± 0.05 mag) is considerably higher than that of J1423−0018, rather close to broad-line quasars and the BOSS type-II AGN candidates (Alexandroff et al. 2013).
mag; Ono et al. 2018). Calhau et al. (2020) used X-ray and radio detections to show that the AGN fraction of LAEs decreases toward high redshift. Although their constraints are poor at z ∼ 3.5–6, objects in their sample with luminosity above LLyα
= 1044 erg s−1 and z ∼ 2–6 are dominated by AGN. However, the high luminosities of the UV continuum and Lyα alone may not be sufficient to prove that J1423−0018 is an AGN. For example, Marques-Chaves et al. (2020) discovered a blue star-forming galaxy at z = 2 (BOSS-EUVLG1) that has LLyα
= 1044.0±0.1 erg s−1, comparable to J1423−0018 (see Figures 1 and 2). It is unlikely that this particular source is the same population as J1423−0018, because the continuum luminosity of BOSS-EUVLG1 (MUV = −24.40 ± 0.05 mag) is considerably higher than that of J1423−0018, rather close to broad-line quasars and the BOSS type-II AGN candidates (Alexandroff et al. 2013).
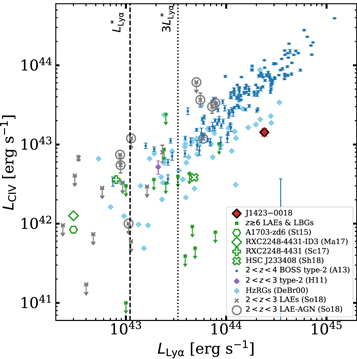
Figure 5. The Lyα and C iv luminosities of selected type-II AGNs/quasars and galaxies. J1423−0018 (red diamond) is more luminous than the z ≳ 6 LAEs and LBGs compiled in (Matthee et al. 2017, green squares) in both emission lines, while it is as luminous as the type-II quasar candidates at 2 < z < 4 (Alexandroff et al. 2013, blue dots). C iv-emitting galaxies (Stark et al. 2015; Mainali et al. 2017; Schmidt et al. 2017; Shibuya et al. 2018) are shown as distinct symbols. Note that the quoted C iv line luminosity of RXC2248-4431-ID3 (Mainali et al. 2017) is that of the C iv
λ1550 line alone. The gray crosses are luminous LAEs at 2 < z < 3 from Sobral et al. (2018). Those objects spectroscopically confirmed as AGN are indicated with large gray circles. Objects from the type-II AGN sample of Hainline et al. (2011) at 2 < z < 3 are shown in purple. The sample of high-z radio galaxies (HzRGs) at 0 < z < 5.2 from De Breuck et al. (2000b) are shown in light blue diamonds, where we show only those objects for which they provide both Lyα and C iv line fluxes (their Table A 1). The dashed line shows the characteristic Lyα luminosity  at z = 5.7 (
 erg s−1; Konno et al. 2018). The dotted line shows
  , above which the Lyα luminosity function has a bright-end excess (Konno et al. 2018).
Download figure:
Standard image High-resolution imageAfter Lyα, C iv is usually the second-brightest emission line in the rest-UV spectrum of AGN. While C iv has a high ionization potential (47.9 eV), it can arise from hard ionizing radiation of either an AGN or a young metal-poor galaxy. Such C iv-luminous star-forming galaxies should be common in the reionization era, and indeed C iv has recently been detected in galaxy samples at z > 6: A1703-zd6 (Stark et al. 2015), RXC2246-4431 (Schmidt et al. 2017), RXC2246-4431-ID3 (Mainali et al. 2017), and HSC J233408 (Shibuya et al. 2018) 22 . The absolute UV magnitudes of those C iv emitters are ≳2 mag fainter than that of J1423−0018. Figure 5 shows that the C iv luminosity of J1423−0018 is considerably higher than C iv-emitting z = 6–7 galaxies, and is comparable to those of the 2 < z < 4 type-II quasars of Alexandroff et al. (2013), the high-redshift (0 < z < 5.2) radio galaxies (HzRGs) of De Breuck et al. (2000b), and the 2 < z < 3 LAE-AGNs of Sobral et al. (2018).
Nakajima et al. (2018) show that star-forming galaxies can power C iv up to EWrest = 12 Å within plausible parameter ranges of metallicity and ionization hardness. Indeed, the C iv emission from known intermediate-redshift type-II AGNs/quasars mostly lies above the threshold (De Breuck et al. 2000b; Hainline et al. 2011; Alexandroff et al. 2013; Le Fèvre et al. 2019; Mignoli et al. 2019). Thus, the observed  Å of J1423−0018 strongly suggests that the C iv-emitting gas is powered by an AGN rather than star formation.
Figure 6 shows C iv rest-frame EW as a function of UV magnitude for various high-redshift populations. This figure shows that some of the strongest C iv emitters known at z ∼ 6–7 (Stark et al. 2015; Schmidt et al. 2017; Mainali et al. 2017; Shibuya et al. 2018) reside in the faintest UV magnitude range (MUV ≳ −20 mag). This may reflect the fact that metal-poor galaxies are often faint in UV and low-mass, while galaxies with C iv EWrest( CIV) ≥ 12 Å are at least partly powered by AGNs in the framework of Nakajima et al. (2018). Although J1423−0018 has a C iv EW considerably higher than most sources at similar UV magnitudes (Laporte et al. 2017; Schmidt et al. 2017; Shibuya et al. 2018; Mainali et al. 2018), it is comparable to those of the BOSS type-II quasar candidates with EWrest( CIV) ≈ 12–50 Å (Alexandroff et al. 2013).

Figure 6. C iv rest-frame EW as a function of UV continuum absolute magnitude. The symbols are the same as Figure 5, while we added z ∼ 6–7 galaxies from (Laporte et al. 2017, brown) and (Mainali et al. 2018, gray). The horizontal dashed line is drawn at EW = 12 Å, the upper limit for star formation powered emission (Nakajima et al. 2018).
Download figure:
Standard image High-resolution imageIt is not clear whether J1423−0018 is a member of the same classes of type-II AGNs known at lower redshift, because the nature of type-II AGNs is highly dependent on the method by which they were selected. Figure 7 compares the C iv rest-frame EW, the flux ratio of C iv to Lyα, and C iv line width of J1423−0018 with those of intermediate-redshift (z ∼ 2–5) type-II AGNs (De Breuck et al. 2000b; Hainline et al. 2011; Alexandroff et al. 2013; Le Fèvre et al. 2019). The ratio of C iv to Lyα (0.08 ± 0.01) in J1423−0018 is significantly smaller than those optically selected type-II AGNs, which lie in the range ≈0.1–0.6; even though intergalactic medium absorption at Lyα is stronger at higher redshift.

Figure 7. (a) The relationship between the rest-frame C iv equivalent widths and the C iv/Lyα flux ratios. The same samples as in Figure 5 are shown. Galaxies detected in C iv are plotted in green (Stark et al. 2015; Mainali et al. 2017; Schmidt et al. 2017; Shibuya et al. 2018). We also added the data point of the composite spectrum of 2 < z < 3.8 narrow-line AGNs in the VUDS field as a purple hexagon (Le Fèvre et al. 2019). The right-hand histogram shows the 0 < z < 5.2 HzRGs of De Breuck et al. (2000b). (b) The FWHM of C iv vs. its rest-frame equivalent width. The vertical dashed line at EWrest(C iv) = 12 Å indicates the boundary above which only AGNs can fall, according to the photoionization model of Nakajima et al. (2018).
Download figure:
Standard image High-resolution imageWe should note that the objects in the Alexandroff et al. (2013) sample of intermediate-redshift Type-II candidates are likely to be only modestly obscured. These objects show higher UV luminosity, their C iv line widths are FWHM = 1000–2000 km s−1, approaching values for broad-line quasars, and NIR spectroscopy shows broad Hα in many cases (up to 7500 km s−1; Greene et al. 2014). The narrow-line AGNs of Hainline et al. (2011), Mignoli et al. (2019), and Le Fèvre et al. (2019) are likely to be more similar to J1423−0018: their UV continuum luminosities are comparable to the SHELLQs narrow-line population, and their composite spectra do not appear to show broad components in emission lines (FWHM < 1350 km s−1; Mignoli et al. 2019).
4.2. Similarity to High-redshift Radio Galaxies
High-redshift radio galaxies (HzRGs), one known population of type-II AGNs, tend to have relatively small C iv/Lyα ratios (e.g., De Breuck et al. 2000b; Villar-Martín et al. 2007; Matsuoka et al. 2009, 2011). De Breuck et al. (2000b) compiled rest-frame UV spectra of a large sample of spectroscopically confirmed HzRGs at 0 < z < 5.2. They found a median C iv/Lyα ratio of about 0.1, with some objects as low as 0.03. There are objects in the HzRG sample with Lyα rest-frame EWs up to ≈ 1000 Å, even higher than that of J1423−0018. Thus, the emission-line properties of J1423−0018 are similar to those of HzRGs.
We searched for the radio counterpart of J1423−0018 in the 1.4 GHz radio source catalog of the Faint Images of the Radio Sky at Twenty-cm survey (FIRST; Becker et al. 1995). There is no source entry within 30 arcseconds of the optical position of J1423−0018, which corresponds to a flux upper limit of 1 mJy. The HzRG sample of De Breuck et al. (2000a), one of the HzRG samples compiled by De Breuck et al. (2000b), applied a 1.4 GHz flux limit of >10 mJy to select HzRG candidates with steep radio slopes between 1.4 GHz and 325 MHz; therefore, J1423−0018 does not meet this criterion. The only known z ∼ 6 radio galaxy, TGSS1530 (Saxena et al. 2018, z = 5.7) has a 1.4 GHz flux of 7.5 ± 0.1 mJy in the FIRST source catalog. The Lyα luminosity of TGSS 1530 is LLyα = 5.7 ± 0.7 × 1042 erg s−1, while its C iv strength has not yet been reported. This Lyα luminosity is smaller than that of J1423−0018 by a factor of 35.
In the right panel of Figure 7(a), we show the distribution of C iv/Lyα for the HzRG sample of De Breuck et al. (2000b). The rest-frame C iv EWs of this sample span a wide range, from 0 to ≈100 Å. We do not show their UV magnitudes and C iv EWs in Figure 6 and Figure 7(a) because those properties are not provided for the objects in the sample. De Breuck et al. (2000b) shows that the C iv/Lyα ratios of their z ≳ 3 sample are about one half of those seen in their lower-redshift sample. This may reflect a lower ionized gas metallicity at high redshift (De Breuck et al. 2000b), or host star formation responsible for a larger fraction of the strong Lyα emission at higher redshift (Villar-Martín et al. 2007, see Section 5). We note that there is a Lyα-only AGN known at z = 2 (Hall et al. 2004), although its Lyα is broad (FWHM = 1400 km s−1), and its EW(Lyα) (=34 Å) is not as extreme as J1423−0018.
4.3. C iv Emitters at z = 6–7
Figure 7(a) also shows that z = 6–7 C iv-emitting objects from galaxy samples share common properties with intermediate-z type-II AGNs and J1423−0018. The C iv emitters with rest-frame EW ∼20 Å or larger are classified as AGNs according to the diagnostics of Nakajima et al. (2018).
23
Stark et al. (2015) argue that the only way to model the photoionization of A1703-zd6, a C iv emitter at z = 7.043 with EW(C iv) ∼40 Å with stellar ionization is to assume a low metallicity (12 + logO/H = 7.0) and a high ionization parameter ( ). Pure AGN models can also explain its observed O iii]/C iv and He ii/C iv line ratios. Nakajima et al. (2018) pointed out that the relative abundance ratio of C/O needs to be near-solar or supersolar to realize the observed C iv EW using stellar radiation alone. This would be surprising, given their standard models of metal-poor galaxies. Given this controversial situation, detection of other high-ionization metal emission lines such as He ii and C iii] would provide firmer evidence of whether J1423−0018 and those C iv emitters are the same populations of AGNs or galaxies.
If J1423−0018 is a galaxy powered principally by star formation, the high EW(Lyα) = 370 ± 30 Å (which could be twice as large after correcting for the strong IGM absorption at z = 6.1) suggests that the stellar population should be young (≪107 yr) and metal-poor (Z ≪ 0.02Z⊙) according to the burst star formation model of Hashimoto et al. (2017).
There are several other extreme Lyα emitting galaxies known at z > 5 (Kashikawa et al. 2012; McGreer et al. 2018) with rest-frame Lyα EWs of <200 Å. However, those authors noted that C iv is not detected in these sources, and concluded that they are not powered by AGNs. At this stage, the relation between those emission line galaxies and J1423−0018 is unclear.
4.4. O iii] Properties
Figure 8 shows the rest-frame O iii] EWs as a function of UV magnitude for the samples of low-redshift type-II quasars and the z ∼ 6–7 galaxies we have considered in Figure 6. The figure includes the tentative detection of O iii] λλ1661,1666 in J1423−0018. Given the spatial offset of O iii] λ1661 (Section 2 and Figure 3), we consider two cases: one in which we assume that the O iii] λ1661 detection is real, and the other in which we only consider O iii] λ1666. Just as we found for C iv, the observed total rest-frame EW (=10.6 Å or =5.3 Å) is as strong as the UV-fainter C iv emitters of Stark et al. (2015) and Mainali et al. (2017) at z ∼ 6–7, whereas it is a factor of seven (or five) larger than that of the Hainline et al. (2011) type-II AGNs at 2 < z < 3. The strong O iii] of J1423−0018, if real, may suggest a distinct change in the hardness of the ionizing radiation of type-II AGNs at high redshift; however, the ionization parameter of J1423−0018 is hard to constrain from the currently available data, especially due to the lack of high-ionization lines such as He ii and N v.

Figure 8. O iii] rest-frame EW of various galaxy samples as a function of UV magnitude. For J1423−0018, we show two cases. The filled diamond shows the case where we consider both O iii] λ1661 and O iii] λ1666, while the open diamond shows the case where we consider O iii] λ1661. The other symbols are the same as Figure 6.
Download figure:
Standard image High-resolution image
We compare the O iii]/C iv flux ratio of J1423−0018 (=0.24 or 0.12) to other galaxy and type-II AGN samples. Local metal-poor galaxies (Berg et al. 2019) show relatively strong O iii], with O iii]/C iv line ratios of 0.5–1.9. The z ∼ 6–7 C iv-detected Lyman break galaxies of Stark et al. (2015) and Mainali et al. (2017) have comparable O iii]/C iv to this sample. On the other hand, the intermediate-redshift type-II AGNs of Hainline et al. (2011) and Alexandroff et al. (2013) show a dex fainter O iii]/C iv (see Figure 4 of Mainali et al. 2017). J1423−0018 lies in between the metal-poor star-forming galaxies and low-redshift type-II AGNs.
5. Conclusion and Future Prospects
The Lyα and C iv emission line properties (line width, luminosity, and EW) of J1423−0018 suggest that this object is an obscured type-II AGN at z = 6.1292. However, further observations are needed to confirm the type-II nature—and if it is an obscured AGN, to determine the amount of its extinction, its bolometric luminosity, and the contribution of the host galaxy to the observed rest-UV continuum and emission lines. Photoionization models suggest that measurements of equivalent widths and line ratios of additional lines (including C iii], He ii, and N v) would lead to more definitive conclusions (e.g., Feltre et al. 2016; Byler et al. 2018; Nakajima et al. 2018). We were not able to observe these lines, given our spectral coverage and contamination from strong sky lines. It is thus important to observe analogs to J1423−0018 at different redshifts to constrain their properties. Spectroscopic follow-up observations with the James Webb Space Telescope (JWST) would enable us to carry out the classic AGN diagnostic test based on the rest-frame optical emission lines. We note that J114658.89−000537.7, one of the five extremely Lyα luminous narrow-line objects among the SHELLQs sample (Figures 1(a), 2) will be observed in an approved Cycle 1 General Observers program by Onoue et al. (2021) as a part of their 12 targets. X-ray detection would provide the most direct signature of being an AGN, and if sensitive enough, we could also estimate the hydrogen column density. We are planning to obtain deep X-ray data of the five extreme narrow-line objects (including J1423−0018) with Chandra. Deep radio follow-up observations will test if J1423−0018 has synchrotron radiation as significant as that of HzRGs.
Finally, it is possible that the observed rest-UV continuum and emission lines of the SHELLQs narrow-line objects are powered by both AGN and star formation. This scenario is suggested by the small C iv/Lyα line ratio of J1423-0018, because Villar-Martín et al. (2007) argued that the strong Lyα emission of HzRGs is partly contributed by gas irradiated by the young stellar population common in high-redshift galaxies. Such an intermediate type of high-redshift source would naturally appear in the UV magnitude range where galaxies are more common than AGNs (Adams et al. 2020; Bowler et al. 2021). The cosmological simulations of Trebitsch et al. (2020) support this hypothesis, which showed that such AGN/galaxy composite objects are commonly found in UV bright galaxies at z ≳ 6. Since the attenuation of nuclear emission to the UV wavelength ranges is not constrained for J1423−0018, a higher signal-to-noise ratio NIR spectrum and multiwavelength photometry of the narrow-line objects are required to disentangle the observed continuum and emission lines from AGNs and host galaxies. Far-infrared follow-up observations will provide clues to the host star formation activities. Such observations would allow us to diagnose whether the obscuration of the nucleus is due to dust at the core of the galaxy, or distributed throughout the host.
The data presented herein were obtained at the W. M. Keck Observatory, which is operated as a scientific partnership among the California Institute of Technology, the University of California and the National Aeronautics and Space Administration. The Observatory was made possible by the generous financial support of the W. M. Keck Foundation. We wish to recognize and acknowledge the very significant cultural role and reverence that the summit of Maunakea has always had within the indigenous Hawaiian community. We are most fortunate to have the opportunity to conduct observations from this mountain.
This publication has made use of data from the VIKING survey from VISTA at the ESO Paranal Observatory, program ID 179.A-2004. Data processing has been contributed by the VISTA Data Flow System at CASU, Cambridge and WFAU, Edinburgh.
The Hyper Suprime-Cam (HSC) collaboration includes the astronomical communities of Japan and Taiwan, and Princeton University. The HSC instrumentation and software were developed by the National Astronomical Observatory of Japan (NAOJ), the Kavli Institute for the Physics and Mathematics of the Universe (Kavli IPMU), the University of Tokyo, the High Energy Accelerator Research Organization (KEK), the Academia Sinica Institute for Astronomy and Astrophysics in Taiwan (ASIAA), and Princeton University. Funding was contributed by the FIRST program from Japanese Cabinet Office, the Ministry of Education, Culture, Sports, Science and Technology (MEXT), the Japan Society for the Promotion of Science (JSPS), Japan Science and Technology Agency (JST), the Toray Science Foundation, NAOJ, Kavli IPMU, KEK, ASIAA, and Princeton University.
The authors wish to thank Ramesh Mainali for useful comments on RXCJ2248-ID3. We also thank the anonymous referee for providing us constructive comments on the draft.
This work was supported by JSPS KAKENHI grant Nos. 17H04830 (YM), 20H01949 (TN), 18J01050 (YT). M.O. was supported by the ERC Advanced Grant 740246 Cosmic gas. Y.M. was supported by the Mitsubishi Foundation grant No. 30140. T.H. was supported by Leading Initiative for Excellent Young Researchers, MEXT, Japan (HJH02007).
Facility: Keck:I (MOSFIRE). -
Software: Astropy (Astropy Collaboration et al. 2013, 2018), Matplotlib (Hunter 2007), NumPy (Harris et al. 2020), SciPy (Virtanen et al. 2020).
Footnotes
- 19
- 20
Subaru-Keck exchange program.
- 21
The J-band spectrum was convolved with the J-band transmission curve of UKIRT/WFCAM.
- 22
The C iv λ1550 detection of HSC J233408 is tentative.
- 23
The object RXC2246-4431-ID3 has EW(C iv λ1550) = 9.9 ± 2.3 Å (Mainali et al. 2017). The λ1548 line is affected by a strong sky line, and is thus not measured. Mainali et al. (2017) carried out emission line diagnostics based on C iv/He ii and O iii]/He ii to suggest that this particular object is primarily powered by star formation, using the photoionization models of Feltre et al. (2016).