


Abstract
The origin of astrophysical high-energy neutrinos detected by the IceCube Neutrino Observatory remains a mystery to be solved. In this paper we search for neutrino source candidates within the 90% containment area of 70 track-type neutrino events recorded by the IceCube Neutrino Observatory. By employing the Fermi-LAT 4FGL-DR2, the Swift-XRT 2SXPS, and the CRATES catalogs, we identify possible gamma-ray, X-ray, and flat-spectrum radio candidate sources of track-type neutrinos. We find that based on the brightness of sources and their spatial correlation with the track-type IceCube neutrinos, the constructed neutrino samples represent special populations of sources taken from the full Fermi-LAT 4FGL-DR2/Swift-XRT 2SXPS/CRATES catalogs with similar significance (2.1σ, 1.2σ, 2σ at 4.8 GHz, 2.1σ at 8.4 GHz, respectively, assuming 50% astrophysical signalness). After collecting redshifts and deriving subsamples of the CRATES catalog complete in the redshift–luminosity plane, we find that the 4.8 GHz (8.4 GHz) subsample can explain between 4% and 53% (3% and 42%) of the neutrinos (90% C.L.), when the probability of detecting a neutrino is proportional to the (k-corrected) radio flux. The overfluctuations indicate that a part of the sample is likely to contribute and that more sophisticated schemes in the source catalog selection are necessary to identify the neutrino sources at the 5σ level. Our selection serves as a starting point to further select the correct sources.
Export citation and abstract BibTeX RIS

Original content from this work may be used under the terms of the Creative Commons Attribution 4.0 licence. Any further distribution of this work must maintain attribution to the author(s) and the title of the work, journal citation and DOI.
1. Introduction
High-energy cosmic rays (HECRs) are energetic subatomic particles with a nonthermal energy spectrum that ranges from GeV up to at most ZeV energies (e.g., Abraham et al. 2010; Abu-Zayyad et al. 2012; Biermann et al. 2016, 2018; Fenu 2017; Saftoiu & Pierre Auger Collaboration 2019). The detection of high-energy neutrinos is an unambiguous way of pinpointing the high-energy particle accelerators, a necessary precursor to ultrahigh-energy cosmic-ray (UHECR) particles in the sky (Gaisser 1990), that cannot be revealed in cosmic rays alone. The reason is that HECRs scatter in Galactic and intergalactic magnetic fields (Dermer et al. 2009; Becker Tjus & Merten 2020), losing directionality. An alternative is the detection of high-energy gamma rays arising from hadronic interactions. These are, however, absorbed in interactions with the cosmic microwave background photons, so the high-energy gamma-ray horizon at TeV energies is constrained to the universe at z < 1, and at PeV energies it is constrained to our Galaxy. In addition, the leptonic production of high-energy gamma rays makes an interpretation of the photon spectrum alone much more difficult.
Neutrinos are produced in high-energy (photo)hadronic interaction processes via the production of pions and kaons, which subsequently decay to produce high-energy neutrinos and muons, where the latter further contribute to the neutrino flux (Gaisser et al. 1995; Becker 2008). High-energy gamma rays are always co-produced via the decay of neutral pions. The IceCube Neutrino Observatory detects cosmic high-energy neutrinos with energies between ∼100 GeV and ∼10 PeV. Among millions of atmospheric neutrinos and hundreds of billions of cosmic-ray muons, about 200/year cosmic neutrinos for an E−2.5 spectrum (Aartsen et al. 2015) are detected via data reduction by introducing intelligent physics-based cuts to remove a large portion of the atmospheric particles (IceCube Collaboration 2013a, 2013b, 2014, 2016, 2017, 2020).
After their first detection by the IceCube Neutrino Detector (IceCube Collaboration 2013a), high-energy astrophysical neutrinos quickly became powerful probes of astrophysics (e.g., Ahlers et al. 2018). In 2018, multimessenger observations of the blazar TXS 0506+056 were reported (IceCube Collaboration et al. 2018b). The high-energy neutrino event IceCube-170922A detected on 2017 September 22 was in temporal and positional coincidence with a strong gamma-ray flare shown by TXS 0506+056 and detected by Fermi-LAT at GeV energies. Knowing where to look, the IceCube Collaboration analyzed archival track-type data and found 3.5σ evidence for a neutrino flare in the direction of TXS 0506+056 (IceCube Collaboration 2018a) during a low gamma state of TXS 0506+06 (Garrappa 2019), which lasted about half a year and was of significantly lower energy than the IceCube event IceCube-170922A. Since 2019 June, neutrino events with high chance of being astrophysical and detected in the framework of the IceCube Realtime Alert System (Aartsen et al. 2017b) have been distributed to the Gold (signalness is above 50%) or Bronze channel (signalness is below 50% but above 30%). The signalness is the probability that an observed neutrino is of astrophysical (s = 1) or atmospheric (s = 0) origin (see its definition in Aartsen et al. 2017b).
In general, radio-loud active galactic nuclei (AGNs) are among the primary candidate sources of IceCube neutrinos. A prime candidate is their blazar subclass. These sources usually show low-energy and high-energy bumps coexisting in their spectral energy distribution (SED). Throughout the paper we refer to blazars as the subclass of AGNs that point their jet close to our line of sight, according to the unification scheme of radio-loud AGNs (Urry & Padovani 1995). The flat spectrum in the 5 GHz range of radio frequencies is indicative of these sources pointing to us and boosting the emission (Biermann et al. 1981; Gregorini et al. 1984).
High-energy neutrinos can be produced in the interaction of cosmic rays with either a photon or a gas target. Here, the threshold of the kinematic energy of a cosmic-ray proton for interaction with the gas is at Ep ≳ 280 MeV. Interaction with a photon target, on the other hand, is typically constrained to higher energies, as its threshold is dominated by the production of the delta resonance at E ≳ 1.3 GeV. As photon targets are typically most dense for thermal emission spectra in the infrared to optical energy range, these interactions might be very effective in certain regions such as close to the accretion disk of the supermassive black hole, but the energy spectrum will be limited to energies above ∼1018 eV for the Bethe–Heitler pair production and above ∼5 × 10¹⁹ eV for the photopion production.
Two photohadronic processes are of astrophysical interest as mentioned—the Bethe–Heitler pair production and the photopion production—such that neutrinos are produced only by the latter process. Enhanced gamma-ray emission from the decay of neutral pions is bound to accompany the emission of neutrinos born in charged-current pion production. However, no statistically significant association of neutrino events with an ensemble of gamma-ray-loud blazars has been found yet (e.g., Aartsen et al. 2017a; Neronov et al. 2017; O'Sullivan & Finley 2019; IceCube Collaboration 2020). Moreover, at lower energies there is more flux in the IceCube diffuse neutrino component than would be expected from the Fermi diffuse gamma-ray sky if they have the same sources (IceCube Collaboration 2021).
Independently, it has been shown that Fermi-LAT resolved blazars contribute only up to ∼5%–30% of the IceCube cumulative neutrino flux (Aartsen et al. 2017a; Pinat et al. 2017; Hooper et al. 2019). Recently Bartos et al. (2021) found that blazars (mainly flat-spectrum radio quasars, based on their assumption of the blazar density) cannot contribute more than 11% to the total diffuse neutrino flux (90% confidence level, C.L.). We note these results are model-dependent as regards the diffuse backgrounds.
Hadronic gamma rays produced in photon-rich environments, such as AGNs, may lose energy through electromagnetic cascading, which results in a high flux emitted in the hard X-ray to MeV range (e.g., Petropoulou et al. 2015; Petropoulou & Mastichiadis 2015; Murase et al. 2018; Rodrigues et al. 2019; Halzen & Kheirandish 2020). Petropoulou & Mastichiadis (2015) had shown that if relativistic protons interact with the synchrotron blazar photons producing gamma rays through photopion processes, despite being a subdominant proton cooling process (for protons satisfying the threshold condition for photopion production), the typical blazar SED should have an emission feature due to the synchrotron emission of Bethe–Heitler pairs in the energy range 40 keV–40 MeV. Therefore, typical neutrino emitters would show this third, although less energetic, bump between the typical low-energy and high-energy bumps of blazar SEDs (e.g., Abdo et al. 2010).
It is a nontrivial task to find a well-established connection between the radio flux and neutrino flux in AGNs, mainly because neutrino production zones may be realized in different parts of an AGN (central or extended parts of the galaxy), and the resolution of the instruments, especially at high energies, is somewhat poor. While a significant connection is not widely concluded yet, catalog searches and studies of particular individual radio-loud sources associated with neutrinos (e.g., Kadler et al. 2016; Britzen et al. 2019, 2021; Kun et al. 2019, 2021; Ros et al. 2020; Rodrigues et al. 2021) deliver more and more results that suggest radio observations play an important role in the understanding of the sources of astrophysical neutrinos.
One way to study the connection between radio observations of AGNs and neutrino data observed with IceCube is the search for correlations between neutrinos that have a high probability of being astrophysical and individual sources or source catalogs. By analyzing public muon-track data from the seven years of IceCube observations against the 8 GHz very long baseline interferometry data of 3411 radio-loud AGNs in the Radio Fundamental Catalog, Plavin et al. (2021) found a connection between the neutrinos and the radio sources at a 4.1σ significance level, combining the post-trial significance of their study and the results in Plavin et al. (2020). Hovatta et al. (2021) studied association of IceCube neutrinos with radio sources observed at Owens Valley (at 15 GHz) and Metsähovi Radio Observatories (at 36.8 GHz) by identifying sources in their radio monitoring sample that are positionally consistent with IceCube high-energy neutrino events. According to their results, observations of large-amplitude radio flares in a blazar at the same time as a neutrino event are unlikely to be a random coincidence at the 2σ level.
Another way to study the connection between radio observations of AGNs and neutrino data taken with IceCube is the concept of stacking; see Achterberg et al. (2006) for the introduction of the method of source stacking for the first time in neutrino astronomy. Zhou et al. (2021) studied the connection between ten years of IceCube muon-track data (with 1,134,450 tracks, taken between 2008 April and 2018 July) and 3388 radio-bright AGNs at 8 GHz selected from the Radio Fundamental Catalog. Using the unbinned maximum likelihood method they analyzed the neutrino data in the position of radio-bright AGNs. Their results imply the 3388 radio-bright AGNs can account for at most 30% (95% C.L.) of the flux of neutrino tracks in the 10 yr catalog of IceCube. Desai et al. (2021) presented a correlation analysis between 15 GHz radio observations of AGNs reported in the MOJAVE XV Catalog and ten years of IceCube detector data. They did not find a significant correlation between them.
In this paper we carry out a multiwavelength search of sources within the 90% containment area of 70 IceCube track-type neutrino events. In Section 2 we design an analysis to match the 70 track-type neutrino events published by IceCube and the Fermi-LAT 4FGL-DR2 catalog, the Swift-XRT 2SXPS catalog, and the CRATES Catalog. We perform a randomness test of the average brightness of the candidate samples in Section 3. We investigate neutrino–radio statistical correlations in Section 4. by deriving number counts of the CRATES catalog after collecting redshifts of more than 3000 radio sources, and by defining a 4.8 GHz subsample and an 8.4 GHz subsample that are complete in radio luminosities. Then we estimate how many neutrinos can be explained by the above subsamples, assuming the probability of detecting a neutrino is proportional to the radio flux. We summarize our results in Section 5 and discuss them in Section 6. We give our conclusions in Section 7.
2. Point Sources within 90% Containment of IceCube Neutrinos
The neutrino list compiled by Giommi et al. (2020) summarizes 70 public IceCube high-energy cosmic neutrino tracks (recorded between 2009 October 13 and 2019 September 30) that are well reconstructed and off the Galactic plane. We use this sample to find neutrino candidate sources. Given that the errors on the neutrino sky positions are asymmetric, the centers of their error-ellipses were shifted in the direction of the most significant errors by an amount equal to half the difference between the larger and smaller errors, and by setting the major and minor axes equal to the sum of the two asymmetrical errors.
2.1. Gamma-Ray Neutrino Source Candidates In the Fermi-LAT 4FGL-DR2 Catalog
The Fermi Gamma-ray Space Telescope is one of the most successful telescopes in the gamma range. Its main instrument, the Large Area Telescope (LAT), is sensitive between 20 MeV and 300 GeV energies, though measurements are made up to 1 TeV. The 4FGL-DR2 catalog includes 5787 gamma sources based on ten years of survey data in the 50 MeV–1 TeV energy range (Ballet et al. 2020), being an incremental version to the 8 yr 4FGL catalog (Abdollahi et al. 2020). More than 3413 of the identified or associated sources are blazars in the Fermi-LAT 4FGL-DR2 catalog (Abdollahi et al. 2020; Ballet et al. 2020). We plot this catalog in Figure 1 overlaid on the 90% containment area of the IceCube track-type neutrino events (Giommi et al. 2020). We found 29 gamma-ray sources from the Fermi-LAT 4FGL-DR2 catalog within the 90% containment area of track-type neutrinos, as summarized in Table 1, and from now on we refer to them as the gamma "ν-sample." In Table 2 we summarize the average, standard deviation, median, minimum, and maximum values of the gamma flux in the 0.1–100 GeV energy range of the sources in the full Fermi-LAT 4FGL-DR2 catalog, and separately such values for the gamma ν-sample. The average flux of the Fermi-LAT ν-sample emerged as 2.4 × 10⁻⁹ photons cm−2 s−1.

Figure 1. Galactic sky position (l, b) and 0.1 GeV–100 GeV flux (F0.1−100 GeV) of the Fermi-LAT 4FGL-DR2 point sources (colored dots), overlaid on the list of the 70 track-type neutrino detections by the IceCube Neutrino Detector (black filled ellipses) compiled by Giommi et al. (2020). The map is shown in Mollweide projection. The equator is plotted as a purple continuous line. TXS 0506+056 and PKS 1502+106 are marked on the map. The seven brightest sources (with F0.1−100 GeV > 10−7 photons cm−2 s−1) are not shown in order to enhance the visibility of the flux-diversity of the sources.
Download figure:
Standard image High-resolution imageTable 1. Excerpt of the Neutrino Source Candidates from the 10 yr Fermi-LAT Point Source Catalogue (4FGL-DR2) (n = 29, out of 5787)
| IDν | tν | R.A.ν | Decl.ν | ID4FGL | R.A.4FGL | Decl.4FGL | F0.1−100 GeV |
|---|---|---|---|---|---|---|---|
| (MJD) | (deg) | (deg) | (deg) | (deg) | (photons cm−2 s−1) | ||
| (1) | (2) | (3) | (4) | (5) | (6) | (7) | (8) |
| IC-100710A | 55387.54 |

|

| 4FGL J2030.5+2235 | 307.63 | 22.59 | 1.36e-10 |
| IC-100710A | 55387.54 |

|

| 4FGL J2030.9+1935 | 307.74 | 19.60 | 8.24e-10 |
| IC-110610A | 55722.43 |

|

| 4FGL J1808.2+3500 | 272.07 | 35.01 | 3.72e-10 |
| IC-110610A | 55722.43 |

|

| 4FGL J1808.8+3522 | 272.22 | 35.38 | 1.91e-10 |
| IC-110930A | 55834.45 |

|

| 4FGL J1744.2-0353 | 266.05 | −3.89 | 3.90e-10 |
Note. Neutrino ID (1), detection time (2), arrival direction of neutrino (90% containment), (3, 4), 4FGL-DR2 source ID (5), equatorial coordinates (J2000) (6, 7), and flux between 0.1 and 100 GeV (8). The full table is available in electronic format here.
Only a portion of this table is shown here to demonstrate its form and content. A machine-readable version of the full table is available.
Download table as: DataTypeset image
Table 2. Summary of the Multiwavelength Flux in the Catalogs and for the Multiwavelength ν-samples
| Fermi-LAT 4FGL: F0.1−100GeV (photons cm−2 s−1) | ||||||
|---|---|---|---|---|---|---|
| N |

| σF | med(F) | min(F) | max(F) | |
| – | (10−9) | (10−9) | (10−10) | (10−11) | (10−8) | |
| T | 5787 | 1.5 | 20.8 | 3.2 | 1.1 | 135.2 |
| S | 29 | 2.4 | 5.6 | 3.3 | 3.9 | 2.4 |
| Swift-XRT 2SXPS: Rm (counts s−1), S/N ≧ 10 | ||||||
| N |

| σR | med(Rm ) | min(Rm ) | max(Rm ) | |
| T | 9097 | 0.039 | 0.077 | 0.015 | 0.002 | 1.755 |
| S | 61 | 0.049 | 0.068 | 0.027 | 0.003 | 0.3603 |
| CRATES: S4.8 (mJy) | ||||||
| N |

| σS4.8 | med(S4.8) | min(S4.8) | max(S4.8) | |
| T | 11,131 | 251 | 905 | 120 | 65 | 46, 894 |
| S | 87 | 544 | 573 | 232 | 66 | 2, 530 |
| CRATES: S8.4 (mJy) | ||||||
| N |

| σS8.4 | med(S8.4) | min(S8.4) | max(S8.4) | |
| T | 14,467 | 149 | 596 | 65 | 0.1 | 41, 725 |
| S | 96 | 423 | 497 | 171 | 13.4 | 1813.4 |
Note. The table lists the number of sources (N), the average (¯), standard deviation (σ), median (med), minimum (min), and maximum (max) values of the flux of the sources in the total (T) Fermi-LAT 4FGL-DR2 (F0.1–100 GeV), of the mean rate of sources in the full Swift-XRT 2SXPS Catalog (Rm ), of the flux density at 4.8 GHz (S4.8) and 8.4 GHz (S8.4) of sources in the full CRATES catalog, as well as the same properties of the subsamples of neutrino candidate sources (S) derived from the above catalogs by the list of IceCube track-type neutrino events compiled by Giommi et al. (2020).
Download table as: ASCIITypeset image
Similar studies were already conducted in the gamma regime, but either with different neutrino lists or with different source catalogs. Franckowiak et al. (2020) studied the IceCube real-time alerts, which select high-energy (≳100 TeV) starting and through-going muon-track events (Aartsen et al. 2017b), and archival neutrino events that would have passed the same selection criteria. We used the neutrino list by Giommi et al. (2020) that is partially different. When searching for the neutrino source candidates, Giommi et al. (2020) used the Fermi-LAT 3FHL (which reports hard Fermi-LAT sources significantly detected in the 10 GeV–2 TeV energy range during the first seven years of the Fermi mission using the Pass 8 event-level analysis, Ajello et al. 2017), 4LAC (the Fourth Catalog of Active Galactic Nuclei detected by the LAT based on eight years of data, Ajello et al. 2020), and 3HSP catalogs (a sample of extreme and high-synchrotron peaked blazars and blazar candidates, Chang et al. 2019), while we employed the whole 10 yr catalog of Fermi-LAT data.
2.2. X-Ray Neutrino Source Candidates in the Swift-XRT 2SXPS Catalog
The Swift-XRT Point Source (2SXPS) catalog covers 3790 square degrees on the sky and contains position, fluxes, spectral details, and variability information for 206,335 X-ray point sources. Observations were made with the X-ray telescope on-board the Neil Gehrels Swift Observatory between 2005 January 1 and 2018 August 1 (Evans et al. 2020). Each source has a detection flag that indicates how likely it is to be a real astrophysical object. We applied several selection criteria: DetFlag = 0 (good), S/N (signal-to-noise ratio = count rate/BG rate) ≧ 10 (in the total 0.3–10 keV energy band). We plot the catalog in the upper panel of Figure 2 overlaid on the 90% containment area of the IceCube track-type neutrino events. Due to the usually wide diversity of sources with different natures in an X-ray catalog such as the 2SXPS (with typically AGNs and stars as the most dominant populations), we applied an additional selection criterion that allows only AGNs to be in our sample. Tranin et al. (2022) applied a robust probabilistic classification of X-ray sources in the Swift-XRT and XMM-Newton catalogs. We selected such X-ray sources, for which the posterior probability of being an AGN is >0.99 according to their probabilistic classification. The resulting subsample contains 9079 sources that have a high chance of being an AGN, from which we found 61 sources to be located within the 90% containment area of track-type neutrinos, as summarized in Table 3.

Figure 2. Galactic sky position (l, b) and mean rate of the Swift-XRT 2SXPS point sources (S/N ≧ 10, chance of being an AGN is >0.99, colored dots) overlaid on the list of the 70 track-type neutrino detections by the IceCube Neutrino Detector (black filled ellipses) compiled by Giommi et al. (2020). The map is shown in Mollweide projection. The equator is plotted as a purple continuous line. TXS 0506+056 and PKS 1502+106 are marked on the map.
Download figure:
Standard image High-resolution imageTable 3. Excerpt of the Neutrino Source Candidates from the Swift-XRT 2SXPS Catalog
| IDν | tν | R.A.ν | Decl.ν | ID2SXPS | R.A.Sw | Decl.Sw | Rm Sw | S/NSw |
|---|---|---|---|---|---|---|---|---|
| (MJD) | (deg) | (deg) | (deg) | (deg) | (counts s−1) | |||
| (1) | (2) | (3) | (4) | (5) | (6) | (7) | (8) | (9) |
| IC-090813A | 55056.70 |

|

| J015910.0+010515 | 29.79 | 1.09 | 0.030 ± 0.003 | 42.0 |
| IC-100710A | 55387.54 |

|

| J203057.1+193612 | 307.74 | 19.60 | 0.059 ± 0.005 | 93.4 |
| IC-100710A | 55387.54 |

|

| J203031.2+223438 | 307.63 | 22.58 | 0.020 ± 0.004 | 40.7 |
| IC-110521A | 55702.77 |

|

| J154743.5+205216 | 236.93 | 20.87 | 0.284 ± 0.006 | 178.6 |
| IC-110521A | 55702.77 |

|

| J154750.7+210352 | 236.96 | 21.06 | 0.007 ± 0.002 | 13.0 |
Note. Neutrino ID (1), detection time (2), arrival direction of neutrino (90% containment), (3, 4), 2SXPS source (5), equatorial coordinates (J2000) (6, 7), mean rate between 0.3 and 10 keV (8), and signal-to-noise ratio (9). The full table is available in electronic format here.
Only a portion of this table is shown here to demonstrate its form and content. A machine-readable version of the full table is available.
Download table as: DataTypeset image
In Table 2 we summarize the average, standard deviation, median, minimum, and maximum values of the X-ray full band rate in the 0.3 keV–10 keV energy range of the sources in the full 2SXPS catalog, and separately such values for the X-ray ν-sample. The average flux of the Swift-XRT ν-sample emerged as 0.049 counts s−1.
2.3. Radio Neutrino Source Candidates in the CRATES Catalog
We searched for radio sources within the 90% containment area of neutrinos in the Combined Radio All-Sky Targeted Eight GHz Survey (CRATES, Healey et al. 2007). The authors have assembled an 8.4 GHz survey of bright, flat-spectrum (α > −0.5, with the convention Sν ∼ να , Gregorini et al. 1984) radio sources with nearly uniform extragalactic (∣b∣ > 10°) coverage for sources brighter than a 4.8 GHz flux density of S4.8 GHz = 65 mJy. The catalog is assembled from existing observations, especially the Green Bank 6 cm Radio Source Catalog (GB6, 4.8 GHz, Gregory et al. 1996), the Parkes–MIT–NRAO Survey (PMN, 4.8 GHz, Wright et al. 1994; Griffith et al. 1994), and the Cosmic Lens All-Sky Survey (CLASS, 8.4 GHz, Myers et al. 2003). The existing observations were augmented by reprocessing of archival Very Large Array (VLA) and ATCA data and by new observations to fill in coverage gaps. The resulting catalog provides precise positions, subarcsecond structures, and spectral indices for 14,467 sources at 8.4 GHz. The number of sources exceeds the number of sources at 4.8 GHz since in many cases there are multiple 8.4 GHz counterparts to a single 4.8-GHz source due to the higher frequency and therefore better resolution. There are also 762 sources for which no 8.4 GHz counterpart was detected. We plot the catalog in Figure 3 overlaid on the 90% containment area of the IceCube track-type neutrino events. We found 87 (96) CRATES sources at 4.8 GHz (8.4 GHz) to be located within the 90% containment area of track-type neutrinos, as summarized in Table 4. In Table 2. we summarize the average, standard deviation, median, minimum, and maximum values of the CRATES radio flux densities at 4.8 GHz and at 8.4 GHz, and separately such values for the radio ν-samples. The average flux of the CRATES ν-samples emerged as 544 mJy at 4.8 GHz, and 423 mJy at 8.4 GHz.

Figure 3. Galactic sky position (l, b) and 8.4 GHz flux density of the CRATES radio sources (colored dots) and list of the 70 track-type neutrino detection by the IceCube Neutrino Detector (black filled ellipses) compiled by Giommi et al. (2020). The maps are shown in Mollweide projection. The equator is plotted as a purple continuous line. TXS 0506+056 and PKS 1502+106 are marked on the map.
Download figure:
Standard image High-resolution imageTable 4. Excerpt of the Neutrino Source Candidates from CRATES Catalog of Flat-spectrum Radio Sources (n = 100, out of 14,467 at 8.4 GHz)
| IDν | tν | R.A.ν | Decl.ν | IDC | R.A.C | Decl.C | S4.8 | S8.4 | Morph. |
|---|---|---|---|---|---|---|---|---|---|
| (MJD) | (deg) | (deg) | (deg) | (deg) | (mJy) | (mJy) | |||
| (1) | (2) | (3) | (4) | (5) | (6) | (7) | (8) | (9) | (10) |
| IC-100710A | 55387.54 |

|

| J203332+214613 | 308.38 | 21.77 | 777 | 321.6 | P |
| J203445+205949 | 308.69 | 21.00 | 149 | 88.0 | P | ||||
| J203718+213103 | 309.32 | 21.51 | 74 | 50.0 | P | ||||
| IC-100925A | 55464.90 |

|

| J174304+132633 | 265.76 | 13.44 | 96 | 51.7 | P |
| IC-110521A | 55702.77 |

|

| J154534+200654 | 236.39 | 20.11 | 125 | 94.9 | P |
| J154541+204930 | 236.43 | 20.82 | 75 | 73.1 | P | ||||
| J155122+200316 | 237.84 | 20.05 | 198 | - | N | ||||
| IC-110610A | 55722.43 |

|

| J180812+350104 | 272.05 | 35.02 | 140 | 89.3 | P |
| IC-110930A | 55834.45 |

|

| J175138-052032 | 267.91 | −4.66 | 117 | 99.6 | P |
Note. Neutrino ID (1), detection time (2), arrival direction of neutrino (90% containment), (3, 4), ID of the CRATES radio source (5), its position (6, 7), its detected flux at 4.8 GHz (8) and 8.4 GHz (9) observing frequencies, and morphology type (10): N = no detection at 8.4 GHz, P = point source, S = short jet (≤1ʺ for VLA maps), L = long jet (>1ʺ). The full table is available in electronic format here.
Only a portion of this table is shown here to demonstrate its form and content. A machine-readable version of the full table is available.
Download table as: DataTypeset image
3. Randomness Test of the ν-samples
In this section we investigate whether the selection method based on track-type IceCube neutrinos chooses random ν-samples or ν-samples with flux properties significantly different from the full catalogs.
The null hypothesis states that a ν-sample represents a sample randomly chosen from the full catalog, while the alternative hypothesis states that the average observed flux of a ν-sample is a rather special value characteristic to the selection based on the neutrinos.
First we took the angular error of the 70 neutrinos, randomly generated their R.A. coordinates (with 0.1 decimal precision), repeated the source search described in Section 2.1, calculated the average flux contained by the gamma sources, and repeated this process 10,000 times. We did not scramble the decl. of the neutrinos because of the strong variation of the sensitivity of IceCube with decl. Integrating the probability density functions (PDFs) from the observed averages to infinity, we get the probability of the corresponding ν-sample being random under the null hypothesis. We repeated the same process for the Swift-XRT 2SXPS catalog, and for the CRATES catalog at 4.8 GHz and 8.4 GHz.
We repeated the tests for different values of the signalness. For example, when we set the signalness to be 0.6, each of the neutrinos has 60% probability of being of astrophysical origin relative to the total background rate. Then the chance of a neutrino entering a cross-match equals the actual signalness of the test. We plot the resulting p-values as a function of the signalness in Figure 4. It seems that on increasing the signalness of the neutrinos, the p-values of the Fermi-LAT 4FGL-DR2 and CRATES catalogs first decrease then fluctuate about constant values. On increasing the signalness, however, the p-value of the Swift-XRT 2SXPS decreases continuously without reaching a constant significance level.

Figure 4. Plot of p-values between the neutrinos and various samples as a function of signalness (signalness = 1 means every IceCube neutrino in the sample has an astrophysical origin; signalness = 0.1 means the chance of the neutrinos having astrophysical origin is 10%).
Download figure:
Standard image High-resolution imageWe found that there is a reasonable, though not conclusive, connection between the neutrinos and the Fermi-LAT 4FGL-DR2 gamma sources (p ≈ 0.016 for 50% signalness, with corresponding significance of ∼2.1σ), as well as between the neutrinos and the CRATES radio sources at 4.8 GHz and 8.4 GHz observational frequencies (p ≈ 0.025 and p ≈ 0.019, respectively, corresponding to significances of ∼2.0σ and ∼2.1σ, both for 50% signalness). We note that the 50% signalness (s = 0.5) represents the cut for which neutrino events detected before 2019 June (since when events with high signalness have been unified to Gold and Bronze channels) would probably end up in the Gold channel of IceCube's Real Time Alert System, which is why we chose this value in accordance with previous work (Giommi et al. 2020). A less significant connection emerged between the track-type neutrinos and the Swift-XRT 2SXPS catalog (p ≈ 0.11 for 50% signalness, with corresponding significance ∼1.2σ). On increasing the signalness of the neutrinos to 100%, however, the significance of the subsample derived from the Swift-XRT 2SXPS catalog being the origin of the neutrinos reaches a p-value of 0.04 (∼1.8σ).
In the rest of the paper we focus on the radio–neutrino argument. We will present our study focusing on the X-ray and gamma-ray regimes in a subsequent paper.
4. Investigation of Neutrino–Radio Correlations Based on the CRATES Catalog
In this section we estimate how many neutrinos can be explained with the CRATES catalog, assuming the neutrino flux is proportional to the radio flux.
4.1. Error Estimates of the Flux Density and Position of CRATES Sources
We needed the flux density uncertainties; however, this information is not directly accessible through the CRATES catalog. 10 The 4.8 GHz part of CRATES is composed mainly from the PMN and GB6 surveys. The single-dish observations of the southern sky at 4.85 GHz are available from the PMN catalog, which covers the region −87° < δ < +10°. Observations were made with the Parkes 64 m Radio Telescope. The standard error (dS) of the flux densities (S) in the PMN catalog can be calculated as (Wright et al. 1994)

where δ is the decl.. We used this equation to estimate the flux density uncertainties of the radio sources in CRATES south of δ = 0° at 4.8 GHz. The GB6 catalog of sources covers the decl. range 0° < δ < +75°, and the observations were made with the 91 m telescope at Green Bank. Since the noises and calibration errors of the map are unknown (to calculate the rms uncertainty in the corrected peak flux density and the source integrated flux density), we fitted a linear function to estimate the error in the flux density of sources in the region 0° < δ < +75° at 4.8 GHz, where CRATES is based on mostly GB6 survey. The maximum decl. of neutrinos ∼67.40° (IC-140216A) is well south of the maximal decl. covered by the GB6 catalog; we do not need to know flux density in the far north region δ > 75°.
The CLASS survey contains observations made with the VLA at A configuration at 8.4 GHz. Augusto et al. (1998) mentioned the typical error on the CLASS flux densities as 5%. Since CLASS is a parent catalog of CRATES, and most of the sources in CRATES were observed by the VLA (11,333 out of 14,467), we estimated the errors as 5% of the flux densities.
In the north region (0° < δ < +75°) the pointing errors of GB6 source positions are estimated as (Gregory et al. 1996)


which dominate the position uncertainties for strong sources (Sp > 50 mJy). In the region of equatorial and far south latitudes (–87° < δ < 0°), the errors of PMN source positions are estimated as (Griffith & Wright 1993)


At 8.4 GHz, CRATES is largely based on two surveys, the CLASS survey in the north and the (unpublished) PMN-CA survey in the south. The equatorial south was surveyed for gravitational lenses, and X-band data are available in this region. In the CLASS region 0 < δ < +75°, ∣b∣ < 10° the typical angular resolution error is about 0 2 (Myers et al. 2003). In the south the PMN-CA survey quotes a typical position error of 06 in each coordinate for the PMN-CA data.
4.2. Number Counts of CRATES Sources in the z-samples
Our first goal was to find the luminosity down to which our sample is complete at a given redshift, which we call "z-sample." To construct a complete z-sample, we defined the parameter C(L, z) = No (L, z)/Np (L, z), where No (L, z) (Np (L, z)) is the observed (predicted) number of sources in a given luminosity and redshift bin.
We found the redshift of 3467 CRATES sources in the Simbad database using the positional uncertainties summarized in Section 4.1, and by running Astropy queries (Astropy Collaboration et al. 2013, 2018). When more objects were found within the error bars, the object closest to the CRATES position was assumed (less than 0.5% of cases). The majority of these sources are quasars (2262 sources), BL Lac objects (486), and blazars (97). The maximum of their observed number counts happens between z ≈ 0.75 and z ≈ 2 (see Figure 5). It is important to note that nearby blazars such as the Markarian sources, galaxies with extraordinary UV brightness compared to normal galaxies, are much closer to us: their redshift ranges from 0.0009 to 1.912 with median value 0.0238, situating them as residents of typically the Local Universe. The First Byurakan Survey (Markarian) Catalog of UV-Excess Galaxies (first paper, and extended list, see Markarian 1967; Markarian et al. 1989) includes the next classes of objects (with their abundance in brackets): galaxy (1251), starburst galaxy (94), Seyfert type 2 (65), galaxy H ii region (26), LINER (17), QSO (13), Seyfert type 1.5 (12), and BL Lac object (3). As can be seen from this list, only 16 objects out of 1469—13 QSOs and three BL Lac objects—are classic radio-loud objects. Therefore, despite their closeness, one does not expect Markarian sources to be a dominant component of neutrino sources observable at radio frequencies, simply because the Markarian galaxies are typically radio-quiet objects (e.g., Biermann et al. 1980).

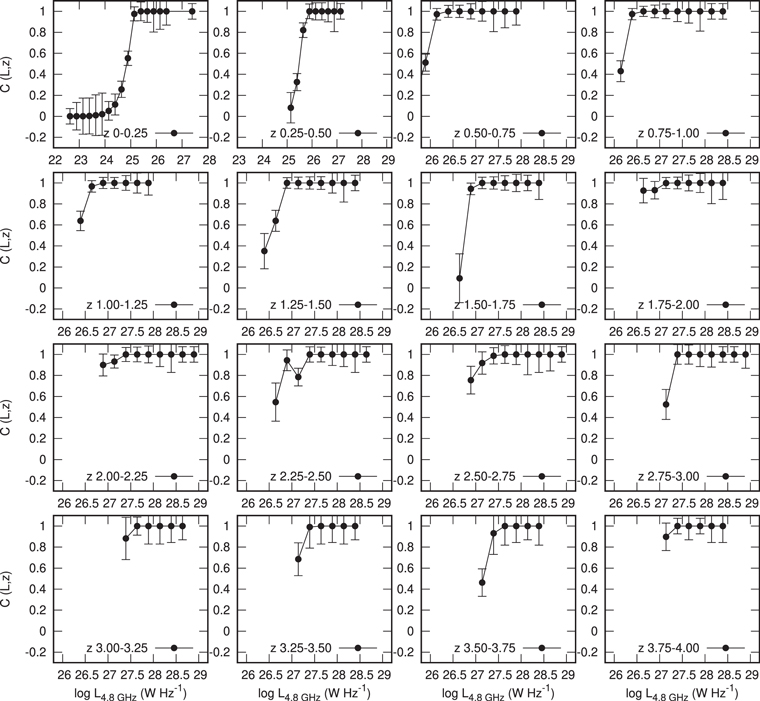
Figure 5. (a) Observed number counts in the z-sample we assembled from the CRATES catalog at 4.8 GHz. The coloring corresponds to the number of observed sources in a given bin, such that blue means a low number and red means a high number. (b) Number density in the same z-sample. The coloring corresponds to the number density of sources in a given bin, such that blue means a low density and red means a high density. The binning is  , Δz = 0.25.
Download figure:
Standard image High-resolution imageFrom the 3467 CRATES sources with collected redshifts we kept only flat-spectrum quasars (2262 sources), BL Lac objects (486), and blazars (97), since they follow similar evolution (e.g., Dunlop & Peacock 1990). These 2845 sources were used in the next analysis at the 4.8 GHz frequency.
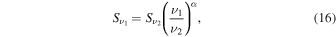
The intrinsic luminosity of a source with flux density Sν at observing frequency ν, spectral index α (with the convention Sν ∼ να ), seen at luminosity distance DL , redshift z, is
after the k-correction  . In Figure 5 we show the number counts within our z-sample with
  , Δz = 0.25 binning. There is luminosity and redshift evolution in the sample, such that the more luminous sources were more abundant in the past. We found the most sources between
  and
and  , between the redshifts z ≈ 0.5 and z ≈ 2, such that the peak falls within the bin centered at
  , zp
≈ 0.75.
, zp
≈ 0.75.
The space density of sources as a function of the luminosity and redshift can be given in the form (e.g., Ajello et al. 2012)

where ϕ(L, z) is the radio luminosity function (LF). In this equation dV/dz is the comoving volume element per unit redshift and unit solid angle (e.g., Porciani & Madau 2001), which in a flat universe is
where

c is the speed of the light, H0 = 67.66 km s−1 Mpc−1 is the Hubble parameter at z = 0, ΔΩs is the solid angle covered by the survey (= 4π for the all-sky CRATES), DL is the luminosity distance, and Ωg = 5.4 × 10⁻⁵, Ων = 1.440 × 10⁻³, Ωm = 0.310, and ΩΛ = 0.689 are the density parameters for the radiation, neutrinos, matter, and dark energy, respectively, taken from Planck Collaboration et al. (2020).
First we estimated the LF by employing the 1/Va
method of Avni & Bahcall (1980), which is the generalization of the  method of Schmidt (1968) for cases when a sufficient number of sources is available in a given survey. If N objects appear in the
  bin element (L1 < L < L2, z1 < z < z2), then the LF is
where
is the available volume of the ith source, when it is pushed to  , where the source would be on the edge of visibility given the lower flux limit of the survey (which is
  mJy at 4.8 GHz for CRATES). The LF ϕ(L, z) estimates the space density if all objects in a given population are detectable by the survey with a flux limit. The dimension of ϕ(L, z) in our study is
  . The rms error estimate of the LF in each luminosity and redshift bin is calculated by weighting each sources by its contribution (e.g., Marshall 1985):
However, if there are ten sources or fewer in a  bin, we used the tabulated upper and lower 84% confidence intervals given by Gehrels (1986), who calculated the Poissonian statistical asymmetrical errors when event rates are calculated from small numbers of observed events. These intervals correspond to the Gaussian 1σ errors such that σϕ
= ϕ × σN
/N, where σN
is the Poissonian statistical asymmetrical error on the measured number of sources. The limiting luminosity distance
bin, we used the tabulated upper and lower 84% confidence intervals given by Gehrels (1986), who calculated the Poissonian statistical asymmetrical errors when event rates are calculated from small numbers of observed events. These intervals correspond to the Gaussian 1σ errors such that σϕ
= ϕ × σN
/N, where σN
is the Poissonian statistical asymmetrical error on the measured number of sources. The limiting luminosity distance  of the ith source taking into account the CRATES flux limit at 4.8 GHz can be calculated by keeping L and setting S4.8 GHz = 65 mJy. Then the maximal redshift is calculated by solving
for zmax.
Now we estimate the completeness of the z-sample derived from the CRATES catalog that comes from our redshift search method. We compared the observed number density to the number density predicted by the 1/Va
method, which gives the space density if all sources could have been observed in the survey (with 65 mJy flux density limit). If the observed number density of sources in the jth  bin is nj
(
bin is nj
( ), the luminosity function is ϕj
(L, z), then
), the luminosity function is ϕj
(L, z), then
The completeness parameter C(L, z) ∈ [0, 1] takes into account all geometrical and statistical correction factors (e.g., the effective area of the survey) that lead to Nj,o
≠ Nj,p
, where Nj,o
(Nj,p
) is the observed (predicted) number of sources in the jth bin. In Figure A1 (see  , Δz = 0.25. In Figure 6 we show the luminosity of sources as a function of the redshift, over which we capture all sources predicted by the 1/Va
method and C(L, z) = 1. It seems that at small redshift the completeness reaches 1 for smaller luminosities, while at larger redshifts we miss the sources with smaller luminosities. We fitted a linear-exponential model in the form of
, Δz = 0.25. In Figure 6 we show the luminosity of sources as a function of the redshift, over which we capture all sources predicted by the 1/Va
method and C(L, z) = 1. It seems that at small redshift the completeness reaches 1 for smaller luminosities, while at larger redshifts we miss the sources with smaller luminosities. We fitted a linear-exponential model in the form of

to set the completeness limit in the luminosity–redshift plane. The resulting parameters are a = 1.97 ± 0.17, b = −0.309 ± 0.020, and c = 25.248 ± 0.094 ( ). Sources satisfying
  (z) constitute our complete z-sample. The final, complete z-sample at 4.8 GHz contains 1423 sources.
Figure 6. The lower limit on the luminosity of sources at 4.8 GHz as a function of the redshift.
Download figure:
Standard image High-resolution imageNext we transformed the 8.4 GHz flux densities to 4.8 flux densities, according to
then calculated the luminosities by using Equation (6) and constrained the complete sample at 8.4 GHz based on Equation (15). The complete z-sample at 8.4 GHz contains 1428 sources. We also calculated the 8.4 GHz luminosities.
We repeated the catalog-matching, taking into account only the complete 4.8 GHz and 8.4 GHz z-samples derived from the CRATES catalog, and the 70 IceCube track neutrinos from Giommi et al. (2020). We found that the error ellipse of the best-fit location of 13 neutrinos contain 14 CRATES sources at 4.8 GHz, and the error ellipse of 14 neutrinos contain 15 CRATES sources at 8.4 GHz from the z-samples. The average flux density of the neutrino-bright CRATES sources is 925 mJy (768 mJy) at 4.8 GHz (8.4 GHz) when we assume 100% signalness, and 956 mJy (762 mJy) at 4.8 GHz (8.4 GHz) when we assume 50% signalness of the neutrinos. The 50% signalness was taken into account as described in Section 3.
4.3. Does the Probability of Detecting a Neutrino Relate to the Radio Flux?
After constraining a subsample of the CRATES catalog complete in radio luminosities, we estimated how many neutrinos could be explained with this subsample at 4.8 GHz and 8.4 GHz, if the probability of detecting a neutrino is assumed to be proportional to the radio flux at these observational frequencies. With this we assume that neutrinos are emitted whenever a source is in an active stage, and assume that this probability scales with flux at radio frequencies. We also assume that, once a source is in an active stage, the probability of actually detecting it varies with the k-corrected (radio) flux  .
.
We assigned the sky coordinates of N CRATES sources from the 4.8 GHz complete z-sample to N neutrinos, keeping the (randomly assigned) angular error of the neutrinos. The probability of the assigned direction depends on the radio flux of the given radio source. The right ascension of the remaining 70 – N neutrinos was scrambled (with 0.1 decimal precision). We did the source-finding as described in Section 2, and calculated the average flux density contained within the containment area of 70 neutrinos. We repeated the same process 10,000 times, and then calculated the mean of the 10,000 sample average flux densities and its 90% confidence interval. We then vary N from  to
to  . We then repeated the whole process employing the 8.4 GHz complete z-sample.
We plot the means of the 4.8 GHz and 8.4 GHz sample average flux densities and their 90% confidence intervals in Figure 7, where we vary N from 1 to 70. We see that higher the number of neutrinos with flux density-driven directions, the higher the sample average, as more and more neutrino directions are equal to the direction of the brightest CRATES sources and the catalog-matching indeed finds these CRATES sources.

Figure 7. Sample average and 90% confidence interval of 4.8 GHz (left) and 8.4 GHz (right) CRATES sources contained by the error ellipses of the 70 neutrinos from 1000 trials (100% signalness of the neutrinos), such that the probability of the assigned direction of N neutrinos depends on the radio flux, and 70 – N neutrinos have scrambled right ascension and the original decl. (because of the strong decl.-sensitivity of the IceCube Detector).
Download figure:
Standard image High-resolution imageTaking into account the observed average flux densities (925 mJy at 4.8 GHz and 768 mJy at 8.4 GHz), we find that the CRATES catalog can explain  neutrinos at 4.8 GHz and
  neutrinos at 8.4 GHz (90% C.L.), when the probability of detecting a neutrino is assumed to be proportional to the radio flux. We repeated the test by assuming 50% astrophysical signalness of the neutrinos. In that case we found the CRATES catalog can explain
  neutrinos at 4.8 GHz and
  neutrinos at 8.4 GHz (90% C.L.).
5. Summary of Results
5.1. Gamma-Ray, X-Ray, and Radio Position Matches with IceCube Neutrino Directions and Probability of the ν-samples
In Section 2. we found 29 Fermi-LAT 4FGL DR2 gamma-ray sources (out of 5787), 61 Swift-XRT X-ray point sources (out of 9097, with S/N ≧ 10 and considering only AGN-type objects), and 87 (96) CRATES radio sources at 4.8 GHz (8.4 GHz) located within the 90% containment area of the 70 IceCube track-type neutrino events listed by Giommi et al. (2020).
We found that out of the 70 IceCube track-type neutrino events, 53 cover at least one gamma-ray, or one X-ray, or one radio source. Out of these 53 neutrinos, the error ellipse of the best-fit location of 15 neutrinos contain at least one Fermi, one Swift-XRT, and one CRATES source. The error ellipse of one neutrino contains at least one Fermi and one Swift source. The error ellipses of five neutrinos contain at least one Fermi and one CRATES source, and also the error ellipses of five neutrinos contain at least one Swift and one CRATES source. The error ellipse of one neutrino contains only Fermi-LAT, seven contain only Swift, and the error ellipses of 18 neutrinos contain only CRATES sources.
With hypothesis tests we concluded the 70 IceCube track-type neutrinos select a special sample from the Swift-XRT 2SXPS catalog at a 1.2σ significance level, when we assume 50% signalness of the neutrinos. We found that there is a reasonable connection between the neutrinos and the Fermi-LAT 4FGL-DR2 gamma-ray sources (2.1σ), as well as between the neutrinos and the CRATES radio sources at 4.8 GHz (2σ) and at 8.4 GHz (2.1σ) assuming 50% signalness.
5.2. Test of Radio Flux Dependence of Neutrino Directions Based on Complete z-samples
After constraining z-samples complete in 4.8 GHz and 8.4 GHz radio luminosities, we found that the error ellipses of 13 neutrinos, out of the 70 IceCube track neutrinos from Giommi et al. (2020), contain 14 CRATES sources at 4.8 GHz, and the error ellipses of 14 neutrinos contain 15 CRATES sources from the z-sample. Their observed average flux density is 925 mJy (768 mJy) at 4.8 GHz (8.4 GHz). We concluded that the complete z-samples derived from the CRATES catalog can explain  neutrinos at 4.8 GHz and
  neutrinos at 8.4 GHz (90% C.L.), when the probability of detecting a neutrino is assumed to be proportional to the radio flux. We found the complete z-samples derived from the CRATES catalog can explain
  neutrinos at 4.8 GHz (between 4% and 53% of the neutrinos) and
  (between 3% and 42% of the neutrinos) at 8.4 GHz (90% C.L.), when assuming 50% astrophysical signalness of the high-energy neutrinos.
6. Discussion
Aartsen et al. (2017a) presented a likelihood analysis searching for cumulative neutrino emission from blazars in the second Fermi-LAT AGN catalog (2LAC) using the 59-string (IC59), 79-string (IC79), and 86-string (IC86) configurations of the IceCube detector recorded between 2009 May and 2012 April (only track-like events). They constrained the maximum contribution of 2LAC blazars to the neutrino flux observed in the above time period to 27% or less.
Pinat et al. (2017) presented their search for extended sources of neutrino emission with seven years of IceCube data (IC40, IC59, IC70, IC86-I, IC86-II, IC86-III, IC86-IV). They found that the five maps with simulated source extents of 1°, 2°, 3°, 4°, and 5° are all consistent with the background-only hypothesis.
Hooper et al. (2019) studied one year of track data (IC86-2011), applying a spatial match between this data set, the 3LAC catalog, and the Roma BZCAT catalog. They also searched for spatial and temporal matches between the above neutrino data set and the Fermi Collaboration's All-Sky Variability Analysis. They found no evidence that blazars generate a significant flux of high-energy neutrinos, and found that no more than 5%–15% of the diffuse neutrino flux (IC86-2011) can originate from this class of objects.
Smith et al. (2021) used three years of IceCube data (IC79, IC86-2011, IC86-2012, 2010–2012) to search for evidence of neutrino emission from the AGNs in the fourth catalog of AGNs detected by the Fermi-LAT (4LAC). They found at the 95% confidence level that blazars can produce no more than 15% of IceCube's observed flux (2010–2012), and that for non-blazar AGNs it remains possible that this class of sources could produce the entirety of the diffuse neutrino flux observed by IceCube in three years.
We employed the full 4FGL-DR2 catalog (ten years of Fermi pointlike sources) to search for the sources of the 70 neutrinos. We found a ∼2σ connection between this catalog and the 70 track-type neutrino events. It has a similar meaning to the above findings: blazars, the dominant population of the 4FGL catalogs, contribute to the IceCube neutrino flux but either the contribution is subdominant or possible in-source gamma attenuation of neutrino sources complicates the picture.
What we can learn from these results is that there are indications for a correlation between the high-energy neutrinos measured with IceCube and the radio, X-ray, and GeV gamma-ray catalogs under investigation in this paper. The question now is how to proceed in order to strengthen these potential correlations to move toward a 5σ confirmation. Knowledge of the sources and from other multimessenger channels needs to be exploited: what we need to understand is how the different messengers and energy channels are correlated. As an example, when looking at the broader picture of gamma-ray versus neutrino emission, we are in this paper testing the correlation between GeV gamma rays and neutrinos. However, it is clear from different observation channels (e.g., Kun et al. 2021) that the GeV gamma-ray intensity seems to be significantly lower than what is predicted in the typical correlated intensities of high-energy gamma rays and neutrinos that arise from the decay of pions. This problem prevails when looking at the diffuse signal (Ahlers & Halzen 2015), but also when looking at potential sources such as NGC 1068 with 3σ evidence for neutrino emission in the 10 yr point-source sample (IceCube Collaboration 2020). One solution to this problem is that the secondaries are produced in an environment of high photon or gas densities. In the case of NGC 1068, it is likely that the emission happens near the corona of the accretion disk of this active galaxy (see, e.g., Eichmann et al. 2021). As for blazars, a time-dependent modeling is certainly necessary in order to understand the complex multimessenger light curves, where the evidence of two very different flaring behaviors of TXS 0506+056 is a first indication that no flare is like another (IceCube Collaboration et al. 2018b; IceCube Collaboration 2018a). Different AGN propagation codes have been developed in recent years in order to tackle this problem of time dependence, such as ATHEνA (Dimitrakoudis et al. 2012), Böttcher (Böttcher et al. 2013), Paris (Cerruti et al. 2015), AM3 (Gao et al. 2017), and CRPropa (Hoerbe et al. 2020). Most importantly, progress in the understanding of the astrophysical properties of AGNs is necessary to really be able to produce quantitative models. Knowing things like the gas and photon field distributions, and magnetic field structure and strength from astrophysical observations helps to tighten the parameter space and thus make the results of the modeling more reliable. Here, a crucial role lies in the understanding of the plasma, and acceleration and transport process of cosmic rays (Sironi & Spitkovsky 2011; Becker Tjus et al. 2022).
7. Conclusions
We examined whether there is a correlation between the list of the 70 IceCube track neutrinos compiled by Giommi et al. (2020), the gamma-ray Fermi-LAT 4FGL-DR2, the X-ray Swift-XRT 2SXPS, and the radio CRATES catalogs. By collecting redshifts of sources in the CRATES catalog and deriving subsamples complete in luminosities, we investigated whether the neutrino flux depends on the radio flux of the complete subsample. Here we list the most important conclusions from our recent work.
- 1.We found similar levels of correlation between the 70 IceCube neutrinos and gamma-ray, X-ray, and radio source catalogs. Each of these catalogs correlated with neutrino sources at 1.2σ–2.1σ.
- 2.The subsample of CRATES radio sources complete in radio luminosity can explain between 4% and 53% of the neutrinos at 4.8 GHz and between 3% and 42% of the neutrinos at 8.4 GHz (90% C.L. and 50% signalness), when the probability of detecting a neutrino is assumed to be proportional to the (k-corrected) radio flux. This result is consistent with the contribution of AGNs to IceCube's neutrinos based on individually identified sources (Bartos et al. 2021).
The next step is to disentangle the correlation between the three photon energies to understand which one is most relevant to neutrinos.
E.K. thanks the Hungarian Academy of Sciences for its Premium Postdoctoral Scholarship. J.T. and A.F. acknowledge support from the German Science Foundation DFG, via the Collaborative Research Center SFB1491: Cosmic Interacting Matters—from Source to Signal. I.B. acknowledges the support of the Alfred P. Sloan Foundation and NSF grants PHY-1911796 and PHY-2110060.
Appendix: Completeness Parameter of the Radio z-sample at 4.8 GHz
In Figure A1 we show the completeness parameter (C(L, z)) of the radio sources in different redshift bins (z) as function of the logarithm of their 4.8 GHz luminosity (logL).
Figure A1. The black dots with error bars show the completeness parameter C(L, z) in our z-sample as a function of the logarithm of the 4.8 GHz luminosity for different redshift bins (2845 sources with redshifts: 2262 quasars, 486 BL Lac objects, 97 blazars).
Download figure:
Standard image High-resolution image