


Abstract
We analyze periods with elevated >40 MeV proton intensities observed near Earth over a time span of 43 yr (1973–2016) that coincide with the passage of interplanetary (IP) shocks. Typically, elevated proton intensities result from large solar energetic particle (SEP) events. The IP shocks observed during these elevated-intensity periods may or may not be related to the origin of the SEP events. By choosing those cases when the shocks can be confidently associated with the solar eruption that generated the SEP event, we analyze the components of these SEP events that are localized in the vicinity of the shock (so-called "energetic storm particles", ESPs), focusing on those events where the ESP component exceeds 40 MeV. We examine the interdependence of these high-energy ESPs with (i) the properties of the solar eruptions that generated the shocks and the SEP events, and (ii) the parameters of the shocks at their arrival at 1 au. The solar eruptions at the origin of the shocks producing >40 MeV proton ESP intensity enhancements are within ±50° longitude of central meridian and are associated with fast coronal mass ejections (plane-of-sky speeds ≳1000 km s−1). The ESP events with the largest >40 MeV proton intensity increases tend to occur when there are structures such as intervening IP coronal mass ejections and other unrelated shocks present in the solar wind through which the shock is propagating. Among the various local shock parameters considered, only the shock speed shows a certain degree of correlation with the observed ESP intensity increase.
Export citation and abstract BibTeX RIS

Original content from this work may be used under the terms of the Creative Commons Attribution 4.0 licence. Any further distribution of this work must maintain attribution to the author(s) and the title of the work, journal citation and DOI.
1. Introduction
Energetic particle enhancements associated with the near-Earth passage of interplanetary (IP) shocks are known as "energetic storm particle" (ESP) events because of their close association with the occurrence of geomagnetic storms (Bryant et al. 1962). Energetic particles in ESP events may result from (i) local particle acceleration at the arrival of the shocks (e.g., Lee 2005; Giacalone 2012, and references therein), (ii) processes of particle acceleration in compressed turbulent regions formed behind the shocks (e.g., Van Nes et al. 1985; Fisk & Gloeckler 2012; Zank et al. 2015), and/or (iii) particles confined in the vicinity of the shocks by either magnetic field fluctuations amplified by the particles themselves (Lee 1983, 2005), turbulent field fluctuations downstream of the shocks (e.g., Zank et al. 2015), and/or intervening plasma structures such as interplanetary coronal mass ejections (ICMEs) able to restrict the propagation of particles away from the shocks (e.g., Lario & Decker 2002). Therefore, energetic particles accompanying the passage of an IP shock may not necessarily be locally accelerated by the shock as it arrives at the observing spacecraft, but may have been accelerated earlier during propagation of the IP shock from the Sun to the spacecraft.
The effects of a shock passage on the heliospheric energetic particle population are energy dependent. In general, the higher the particle energy, the less prominent the ESP enhancement is (e.g., Lario et al. 2003). But occasionally, ESP events observed at 1 au may reach proton energies of >100 MeV versus the more usual maximum energies of ≲10 MeV. Well-known examples found in the literature include the events on 1989 October 20 (Lario & Decker 2002), 1994 February 21 (Humble et al. 1995), and 2001 November 4 (Shen et al. 2008). However, these few case studies are insufficient to address basic questions about high-energy ESP events including: (i) How frequently are high-energy ESP events observed? (ii) Are there properties of the parent solar eruption that generates the IP shock that favor the observation of a high-energy ESP event? (iii) Which shock parameters determine if a high-energy ESP event may be observed? and (iv) Does the high-energy particle intensity enhancement result from local particle acceleration by the IP shock when arriving at 1 au, or does some other circumstantial element play a role in the formation of the high-energy particle intensity enhancement?
The study of high-energy ESP events also addresses a missing component in the capabilities of most current solar energetic particle (SEP) event forecasting models (e.g., Whitman et al. 2022). It has been argued that the most hazardous particle intensities in SEP events occur in association with the arrival of shocks in the form of ESP events (Reames 1999). Whereas particle intensities measured early in large SEP events (also known as the "prompt" component) tend to be bounded by a maximum-intensity plateau known as the "streaming limit" (Reames & Ng 1998), the ESP intensity enhancement may form an additional bump in the particle intensity–time profile associated with shock passage where intensities exceeding the streaming limit can be observed (Reames 1999). Note, however, that particle intensities in the prompt components of some SEP events can exceed the intensity previously identified as the streaming limit (e.g., Lario et al. 2008). To account for such events, factors have been invoked such as IP conditions that do not favor the amplification of waves able to inhibit the free streaming of particles in the prompt component of the SEP events, energetic particle confinement within intervening transient structures such as ICMEs, as well as energetic particle mirroring by plasma structures beyond the spacecraft's location (Lario et al. 2008). The presence of intervening ICMEs through which an IP shock propagates has also been suggested as a controlling factor in the formation of high-energy ESP events (e.g., Shen et al. 2008). The confinement of energetic particles previously accelerated by the approaching IP shock within these structures may have caused the intense, high-energy ESP events on 1989 October 20 and 2001 November 4, as suggested by Lario & Decker (2002) and Shen et al. (2008), respectively (see Figure 2 in Lario et al. 2009). On the other hand, the ESP event on 1994 February 21 was preceded by a well-ordered solar wind devoid of intervening IP structures (Lario & Decker 2001) but still showed a >100 MeV proton intensity increase (Humble et al. 1995).
In this study, we identify periods with elevated >40 MeV proton intensities observed near Earth during the time interval from 1973 November to 2016 December that comprises most of solar cycles 21 to 24. These periods with enhanced >40 MeV proton intensities are usually associated with the occurrence of large SEP events whose origin is temporally associated with large solar flares and/or fast and wide coronal mass ejections (CMEs). We then check for the passage of IP shocks during these elevated >40 MeV proton intensity periods. We select those cases when the shock observed at 1 au can be confidently associated with the solar eruption that generated the SEP event, allowing us to analyze the most energetic ESP components of the SEP events. We record the proton peak intensity measured during the ESP event at two different high-energy ranges (at ∼50 and 100 MeV) and estimate the size of the ESP event, defined as the peak intensity subtracted from the background intensity obtained under the assumption that no ESP intensity was present (see Mäkelä et al. 2011). We then analyze the factors that could determine whether a high-energy ESP event is observed, including the properties of the parent solar eruption associated with the origin of the IP shock, the parameters of the IP shock, and the presence of other IP structures that may have influenced the intensity of the ESP event. Our study falls within the framework of prior statistical analyses of ESP events including those providing phenomenological classifications of ESP particle signatures such as intensity–time profiles, energy spectra, and particle anisotropies (e.g., van Nes et al. 1984; Tsurutani & Lin 1985; Wenzel et al. 1985; Kallenrode 1995; Lario et al. 2003, 2005b; Cohen et al. 2005; Huttunen-Heikinmaa & Valtonen 2005; Ho et al. 2008; Richardson & Cane 2010a; Mäkelä et al. 2011; Giacalone 2012; Reames 2012; Dresing et al. 2016; Dayeh et al. 2018; Ameri et al. 2023, and references therein), and those relating ESP signatures with the properties of the solar eruptions that generate the IP shocks (e.g., Mäkelä et al. 2011; Santa Fe Dueñas et al. 2022; Ameri et al. 2023, and references therein). Most of these studies focus on low-energy (≲20 MeV nucleon−1) ESP particle signatures, whereas the extension to higher energies entails the study of the temporal and, when possible, spatial evolution of the associated SEP events and thus the isolation of the ESP components (e.g., Luhmann & Mann 2007; Chiappetta et al. 2021; Reames 2023, and references therein). However, the possible influence of unrelated IP structures on the ESP intensities over a large number of events has not been considered in a comprehensive way.
The structure of this paper is as follows. In Section 2, we describe the data sources used in this paper and the criteria used to select the events. In particular, we describe the process used to identify (and neglect) those IP shocks not directly associated with the solar eruption at which the bulk of SEPs observed in the event originated. We also describe the process used to estimate the size of the ESP events. In Section 3, we analyze the interdependence between the observation of high-energy (>40 MeV) ESP events and the properties of the solar eruptions that generate the IP shocks observed during the periods with elevated >40 MeV proton intensities. In Section 4, we analyze the interdependence between the observation of high-energy (>40 MeV) ESP events and the local properties of IP shocks. In Section 5, we summarize the main results of these analyses and address the questions proposed above. Finally, in Section 6, we summarize the main conclusions of this work.
2. Data Sources and Event Selection
An initial identification of the periods with elevated >40 MeV proton intensities was made using data from the Goddard Medium Energy (GME) instrument (McGuire et al. 1986) on board the Interplanetary Monitoring Platform-8 (IMP-8) covering the time interval from 1973 November to 2001 October. In particular, we selected periods when the 42.9–51.0 MeV proton intensities were above the instrumental background. In order to extend the analysis from 2001 October to 2006 December, we also checked for periods when the 40.5–53.5 MeV proton energy channel of the Energetic and Relativistic Nuclei and Electron (ERNE) instrument (Torsti et al. 1995) on board the Solar and Heliospheric Observatory (SOHO) was elevated above the intensity instrumental background. However, the High-Energy Detector (HED) of SOHO/ERNE is known to suffer from saturation effects when proton intensities are significantly elevated (e.g., Miteva 2017; Miteva et al. 2020), therefore limiting the analysis of the intense ESP events included in this study. For these reasons, and also because of numerous data gaps throughout the IMP-8 mission, we decided to combine the IMP-8/GME and SOHO/ERNE data with the Reference Data Set (RDS) v2.0 of the Solar Energetic Particle Environment Modeling (SEPEM) project 4 (Jiggens et al. 2018). This data set includes data from the Energetic Particle Sensor (Sauer 1993; Sellers & Hanser 1996) on board the series of Geostationary Operational Environmental Satellites (GOES) that is cross-callibrated with IMP-8/GME data corrected for the deterioration in performance, and ultimate failure, of an anticoincidence detector between 1984 and 1990, as documented by Sandberg et al. (2014). The crucial finding of Sandberg et al. (2014) was that the GOES proton channels (P2–P7), when assigned the correct mean energy values, exhibited an excellent linear correlation with data interpolated from the IMP-8/GME instrument (using only reliable GME energy channels). Therefore, we used the 45.7–66.1 MeV proton intensities from the SEPEM/RDS data set to substantiate the identification of periods with elevated >40 MeV protons.
The periods with elevated >40 MeV proton intensities tend to be associated with the occurrence of large, intense SEP events. The origin of these large SEP events is commonly associated with the occurrence of a solar eruption including both intense solar flares and fast and wide CMEs (e.g., Cane et al. 2010; Lario et al. 2020, and references therein). In order to identify the most probable origin for the periods with elevated >40 MeV proton intensities, we checked several catalogs of large SEPs (e.g., Cane et al. 1986, 2010; Chandra et al. 2013; Richardson et al. 2014; Papaioannou et al. 2016; Paassilta et al. 2017; Miteva et al. 2018; Pacheco 2019), as well as Solar-Geophysical Data Reports 5 from the National Oceanic and Atmospheric Administration (NOAA). In particular, we identified the location and classification of the Hα solar flares occurring at the origin of the SEP events as well as their GOES X-ray class. For events occurring after January 1996, we also considered the occurrence of CMEs as observed by the Large Angle Spectrometric Coronagraph (LASCO; Brueckner et al. 1995) on board SOHO and reported in the Coordinated Data Analysis Workshop (CDAW) SOHO/LASCO CME catalog, 6 paying special attention to the plane-of-sky CME speed, VCME (Yashiro et al. 2004).
The identification of IP shock passages during these periods with elevated >40 MeV proton intensities was initially based on visual inspection of available solar wind and magnetic field data from IMP-8 and spacecraft near the Sun-Earth Lagrangian L1 point. From 1973 November to 1995 January, the main source of solar wind and magnetic field data was IMP-8. 7 Because IMP-8 spent part of each orbit inside Earth's bow shock, the Solar Plasma Faraday cup experiment (PLS; Bellomo & Mavretic 1978) on IMP-8 did not provide continuous solar wind data. When solar wind data were absent, we used geomagnetic storm commencements (SCs; see, e.g., Veenadhari et al. 2012, and references therein) as well as cosmic ray Forbush decreases as proxies for the presumed arrival near Earth of IP shocks and accompanying structures (see Richardson & Cane 2012). Starting in solar cycle 23, the continuous data from the Advanced Composition Explorer (ACE) and the Wind spacecraft (when in the solar wind) were used to check for the passage of IP shocks. In particular, we inspected data from the Solar Wind Electron Proton Alpha Monitor (SWEPAM; McComas et al. 1998) and the Magnetometer Field Experiment (MAG; Smith et al. 1998) on board ACE, and the Solar Wind Experiment (SWE; Ogilvie et al. 1995) and the Magnetic Field Investigation (Lepping et al. 1995) on board Wind, together with the Proton Monitor of the Mass Time-of-flight (MTOF) sensor of the Charge, Element, and Isotope Analysis System (CELIAS; Hovestadt et al. 1995) on SOHO.
We also checked for the passage of IP shocks by inspecting catalogs of IP shocks such as the Database of Heliospheric Shock Waves generated by the University of Helsinki at ipshocks.fi (Kilpua et al. 2015), the list of shocks observed by the Proton Monitor of SOHO/CELIAS/MTOF at umtof.umd.edu/pm/FIGS.HTML, the list of ACE disturbances at www.ssg.sr.unh.edu/mag/ace/ACElists/obs_list.html, and the Harvard–Smithsonian Center for Astrophysics (CfA) Interplanetary Shock Database at www.cfa.harvard.edu/shocks/. 8 In particular, in order to characterize the properties of the shocks, we considered the shock parameters cataloged at the CfA Interplanetary Shock Database. In this catalog several methods are used to obtain the shock parameters (e.g., Abraham-Shrauner 1972; Vinas & Scudder 1986; Trotta et al. 2022). The RH08 method (see Szabo 1994 and Koval & Szabo 2008 for details) is found to provide converging physical results in most cases. The RH08 method is a nonlinear least-squares fitting technique that uses eight equations derived from the Rankine–Hugoniot (RH) continuity equations across the shock such as the mass flux conservation equation, the conservation equation for the tangential components of the momentum flux, the continuity equation for the tangential electric field, and the continuity of the normal component of the magnetic field (see also Vinas & Scudder 1986 and the supplemental material in Wilson et al. 2017 for additional details).
2.1. Shock Selection and Removal of Passing Shocks
From visual examination of solar wind plasma and magnetic field data and the catalogs of IP shocks and SCs described above, we determined whether any IP shocks were present during the periods with elevated >40 MeV proton intensities. To assess whether an IP shock originated with the solar eruption that generated the high-energy SEP event, we computed the average transit speed of the shock when traveling from the Sun to 1 au implied by this association. We also examined both the solar wind plasma and magnetic field data associated with shock passage as well as the particle intensity–time profiles during the SEP event generated by the parent solar eruption over a wide range of energies. For this purpose, we used the data sets provided by: (1) IMP-8/GME, covering proton energies from 0.88 MeV to 485 MeV, combined with measurements from the Charged Particle Measurement Experiment (CPME; Sarris et al. 1976) on board IMP-8 that covers proton energies 0.29–440 MeV (IMP-8/CPME may be susceptible to instrumental saturation effects during elevated particle intensities; e.g., Lario et al. 2001); (2) the SEPEM/RDS data set that covers proton energies from 5 to 289 MeV; (3) SOHO/ERNE/HED, covering proton energies from 13.8 to 131 MeV; and (4) low-energy ion measurements from the Low-Energy Magnetic Spectrometer (LEMS120) of the Electron Proton and Alpha Monitor (EPAM; Gold et al. 1998) on ACE that cover ion energies from 47 keV to 4.8 MeV.
By considering the longitude of the parent solar eruption for each SEP event relative to central meridian and inspecting the particle intensity–time profiles over the complete range of energies, we assessed whether both the observed IP shock and the SEP event most likely originated from the same solar eruption (based, for example, on comparison with the typical longitudinal dependence of the SEP event profiles in Figure 15 of Cane et al. 1988). Sometimes other shocks, unrelated to the solar origin of the SEP event, were observed in situ during the development of an SEP event; for example, shocks for which its transit speed inferred assuming an association with the SEP-associated eruption is inconsistent with the observed speed. These shocks may or may not produce an effect on the particles. Such shocks, named "passing shocks" by Cane et al. (2010), have been neglected in our selection of events since their local effects on the particle intensities do not constitute the ESP component of the SEP event.
An example of a passing shock is shown in Figure 1, where the top panel displays ion intensities as measured by ACE/EPAM from 47 keV to 4.80 MeV (top eight traces), and proton intensities obtained from the SEPEM/RDS data set covering the energy range 5–138 MeV (bottom nine traces) during the SEP event with onset on day 253 of 2014 (i.e., 2014/253). The red vertical lines (both solid and dashed lines) indicate the passage of IP shocks identified by the discontinuous increases of the solar wind proton speed, density, and temperature measured by ACE/SWEPAM (panels (b)–(d)), and of the magnetic field magnitude measured by ACE/MAG (panel (e)). Additionally, the passages of the two shocks were accompanied by geomagnetic storm commencements (at day 254/23:44 UT and day 255/15:53 UT, from the Service International des Indices Géomagnétiques). 9 The second shock (indicated by the solid vertical line in Figure 1) was followed by a moderate (Dst = −88 nT) geomagnetic storm as seen in the Disturbance Storm Time (Dst) index obtained from the World Data Center for Geomagnetism at the Kyoto University 10 (panel (h)). This storm was generated by southward fields (θ < 0°) in the sheath ahead of the ICME indicated by the gray shaded region 11 that was driving the shock. The SEP enhancement, extending to proton energies >40 MeV, was associated with a fast halo CME (VCME = 1267 km s−1 as reported in the CDAW LASCO CME catalog) associated with a X1.6 soft X-ray (SXR) flare at 17:27 UT on day 253 located at N14E02. Considering which of the two shocks was associated with this CME, if the shock observed on day 254 at 22:42 UT at ACE (indicated by the dashed red vertical line in Figure 1) were associated with this CME, it would have had to propagate to 1 au with an average transit speed of 1414 km s−1. However, the small increase in the solar wind parameters at shock passage and solar wind speeds of ∼460 km s−1 downstream of the shock do not support the observation of such a fast shock. Hence, we conclude that this first shock was a passing shock. In contrast, an association between the CME and the shock observed at 15:16 UT on day 255 (solid red vertical line in Figure 1) would require an average transit speed of 907 km s−1 that is more consistent with the observed strong shock. Additionally, the high-energy proton intensity–time profiles of the SEP event are similar to those of SEP events generated from longitudes close to central meridian (e.g., Cane et al. 1988). Therefore, we suspect that the shock at the end of day 254 was a passing shock unrelated to the solar eruption that generated the high-energy SEP event, whereas the IP shock on day 255 was presumably driven by the CME that erupted from the Sun on day 253, with the ICME indicated by the gray shading being the IP counterpart of this CME. ENLIL+cone modeling of this CME, available at the space weather Database Of Notifications Knowledge Information of the Community Coordinated Modeling Center, 12 also supports this conclusion, and similar modeling suggests that the first shock originated in an eruption in the same active region associated with a halo CME at 00:06 UT on day 252 (the CME time is from the CDAW CME catalog). We note that the ion intensities shown in Figure 1(a) exhibit an ESP peak around and following the passage of the second shock that extends from the lowest energies to above 40 MeV. It is also evident that the passing shock at the end of day 254 distorted the nominal evolution of the intensity–time profiles, especially at energies ≲30 MeV. It is possible that the efficiency of the second shock as a particle accelerator was altered by the preceding passing shock, apparently from the same active region, either by supplying a seed population of already accelerated ions or by providing the appropriate transport conditions to allow the particles to interact multiple times with the shock (e.g., Kallenrode & Cliver 2001).
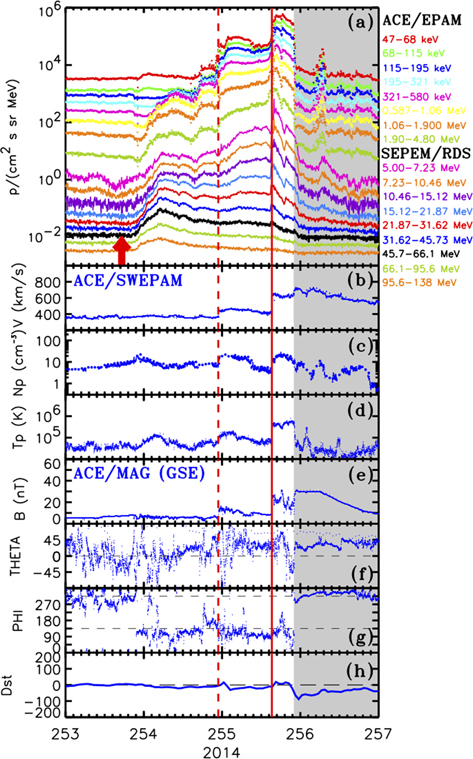
Figure 1. From top to bottom. (a) Ion intensities measured by ACE/EPAM from 47 keV to 4.80 MeV (top eight traces) and from the SEPEM/RDS data set covering the energy range 5–138 MeV (bottom nine traces). Solar wind proton (b) speed, (c) density, and (d) temperature as measured by ACE/SWEPAM. Magnetic field (e) magnitude, (f) polar angle, and (g) azimuth angle in Geocentric Solar Ecliptic (GSE) coordinates as measured by ACE/MAG. (h) Geomagnetic Dst index from wdc.kugi.kyoto-u.ac.jp/dstdir. The red arrow in panel (a) identifies the onset time of the solar flare related with the onset of the SEP event. The vertical red lines identify passages of IP shocks. The shock at the end of day 254 (dashed red vertical line) is considered to be a passing shock since it is not related to the solar eruption that generated the >40 MeV proton SEP event whereas the shock on day 255 (solid red vertical line) was most likely associated with this eruption, occurring at the time indicated by the red arrow on day 253. The gray shaded region indicates the passage of an ICME following this shock. The particle observations show an ESP event associated with the second shock extending from the lowest energies to >40 MeV that is predominantly located in the sheath between the shock and ICME.
Download figure:
Standard image High-resolution imageAdditional examples of passing shocks can be found, for example, in Figures 3 and 5 of Cane et al. (2010), and are noted in Table 1 of that paper. Passing shocks unrelated to the solar event associated with the origin of the prompt SEP particles may be observed at any time during the development of an SEP event. These shocks may or may not produce effects on the observed particle intensities. In our study, we have neglected passing shocks and have just considered those IP shocks that can be confidently associated with the solar eruption that generated the high-energy SEP event. If an intensity enhancement is observed associated with the passage of such a shock, we interpret this intensity increase as the ESP component of the SEP event.
Table 1. Selected Shock Passages Occurring During Enhanced ∼40 MeV Proton Intensities
| Cycle- | Shock Time | Parent Solar Eruption a | Vtrans | θBn | Vsc | Vsh | rn | Mms | MA |
|---|---|---|---|---|---|---|---|---|---|
| Shock No | yyyy/doy/hh:mm (SC) | doy/hh:mm Flare AR VCME | (km s−1) | (deg) | (km s−1) | (km s−1) | |||
| (1) | (2) | (3) | (4) | (5) | (6) | (7) | (8) | (9) | (10) |
| 21-00 | 1974/187/03:14 (I) | 185/13:21 S16W07 2B (plage 13043) | 1096 | 88 ± 16 | 650 ± 0027 | 158 ± 029 | 2.51 ± 0.24 | 1.87 ± 0.14 | 3.25 ± 0.69 |
| 21-01 | 1974/264/12:43 (I) | 262/22:20 N09W62 2B (plage 13225) | 1083 | 52 ± 06 | 749 ± 0039 | 192 ± 041 | 2.47 ± 0.34 | 2.13 ± 0.19 | 2.72 ± 0.60 |
| 21-02 | 1974/312/14:14 (I) | 309/15:38 S12W78 (plage 13310) | 589 | 61 ± 11 | 491 ± 0023 | 103 ± 023 | 3.14 ± 0.55 | 1.50 ± 0.10 | 1.91 ± 0.46 |
| 21-03 | 1976/092/02:55 (SC) | 088/19:05 S07E28 1B X1 AR 0690 | 521 | ⋯ | ⋯ | ⋯ | ⋯ | ⋯ | ⋯ |
| 21-04 | 1976/123/18:29 (SC) | 121/20:59 S09W47 2B X2 AR 0700 | 913 | ⋯ | ⋯ | ⋯ | ⋯ | ⋯ | ⋯ |
| 21-05 | 1977/264/20:44 (I) | 262/09:55 N05W57 3B X2 AR 0889 | 706 | 85 ± 09 | 772 ± 0060 | 103 ± 061 | 1.96 ± 0.36 | 1.22 ± 0.12 | 1.90 ± 1.13 |
| 21-06 | 1977/287/11:51 (SC) | 285/01:52 N08W03 1B X1 AR 0908 | 717 | ⋯ | ⋯ | ⋯ | ⋯ | ⋯ | ⋯ |
| 21-07 | 1977/329/12:14 (SC) | 326/09:45 N24W38 2N X1 AR 0939 | 558 | ⋯ | ⋯ | ⋯ | ⋯ | ⋯ | ⋯ |
| 21-08 | 1978/003/20:42 (I) | 001/21:47 S18E05 1B M3 AR 0967 | 886 | ⋯ | ⋯ | ⋯ | ⋯ | ⋯ | ⋯ |
| 21-09 | 1978/045/21:45 (SC) | 044/01:39 N13W24 SB M7 AR 1001 | 942 | ⋯ | ⋯ | ⋯ | ⋯ | ⋯ | ⋯ |
| 21-10 | 1978/103/19:25 (I) | 101/13:40 N19W54 2B X2 AR 1057 | 773 | 67 ± 25 | 586 ± 0041 | 094 ± 043 | 2.24 ± 0.26 | 1.23 ± 0.09 | 2.50 ± 1.16 |
Note.
a Solar flare and CME temporally associated with the origin of the >40 MeV proton SEP event and the IP shock. CME information is only available for solar cycles 23 and 24.Only a portion of this table is shown here to demonstrate its form and content. A machine-readable version of the full table is available.
Download table as: DataTypeset image
Table 1 lists the selected shocks observed during periods with elevated SEP >40 MeV proton intensities, the most likely solar origin of the shock and SEP event, and the shock parameters obtained from the CfA Interplanetary Shock Database. In particular, column (1) gives the solar cycle when the shock was observed and the number of the shock within this solar cycle. Column (2) lists the time when the shock was observed by either (I) IMP-8, (W) Wind, (A) ACE, (S) SOHO, or alternatively the time of a geomagnetic storm commencement (SC) as a proxy for shock arrival. Column (3) provides the initial time of the parent solar eruption (i.e., the onset time of either the X-ray or the Hα flare) temporally associated with the origin of the SEP event and the IP shock, as documented in Solar Geophysical Data reports, together with the site of the solar flare (latitude and longitude in Stonyhurst coordinates, where the latitude is measured from the solar equator and the longitude from central meridian with respect to Earth), the Hα classification of the associated solar flare and its GOES SXR intensity, and the number of the NOAA Active Region (AR) where the flare occurred (DSF indicates a disappearing solar filament). When a CME is also reported in the CDAW LASCO/CME catalog, we add whether the CME was halo (H) or partial halo (PH) and the estimated plane-of-sky speed VCME in units of km s–1 (no narrow CMEs were associated with the selected events). Column (4) provides the average transit speed of the shock to travel from the Sun to 1 au. Finally, columns (5) through (10) of Table 1 provide shock parameters as reported in the CfA shock database. In particular we list, when available, the angle between the upstream magnetic field and the shock normal θBn , the shock speed in the spacecraft frame of reference Vsc, the shock speed with respect to the upstream solar wind Vsh, the density compression ratio rn , the magnetosonic Mach number Mms, and the Alfvén Mach number MA . Note that the shock parameters are not available when there are no solar wind observations, e.g., from ACE during intense particle events, during spacecraft data gaps, or when IMP-8 was within the Earth's magnetosphere, especially during solar cycles 21 and 22.
2.2. Energetic Storm Particle Event Size
To determine whether a shock passage is accompanied by a >40 MeV proton intensity increase, we have used observations from the 42.9–51.0 MeV energy channel of IMP-8/GME and the 45.7–66.1 MeV energy channel of SEPEM/RDS to estimate the ESP event size following the definition provided by Mäkelä et al. (2011). This requires determining both the peak intensity during the ESP event (Ipk) and an estimate of the "background intensity" (Ibg) as if the ESP event was not present, as described in Figure 1 of Mäkelä et al. (2011). Figure 2 shows an example of how these intensities are computed using SEPEM/RDS data for the shock observed on day 286 of 1981 (i.e., 1981/286). The shock passage is indicated by the red vertical line and was observed during the decay phase of the SEP event generated by the solar eruption that was also associated with the origin of this shock. Figure 2 also includes 95.6–138 MeV proton intensities from the SEPEM/RDS data set (orange trace) as this shock displayed an intensity increase even at these energies. The thin solid straight lines indicate the background intensity assuming that the proton intensities decayed at the same rate as observed prior to the intensity enhancement associated with the ESP event. We define Ipk as the maximum intensity observed during the intensity enhancement that constitutes the ESP event (indicated by the solid circles in Figure 2), and Ibg as the background intensity inferred at the time of peak intensity (which may not be exactly at shock passage, as discussed further below) assuming that the ESP component was not present (indicated by the open diamonds in Figure 2). Mäkelä et al. (2011) define the ESP size by subtracting the background intensity from the peak intensity (i.e., Ipk − Ibg). If an ESP event does not occur during the decay of an SEP event, Ibg is estimated for a period prior to the ESP intensity enhancement. In order to determine when an intensity enhancement is significant, we require a 30% intensity increase with respect to the background intensity (i.e., Ipk/Ibg > 1.3).
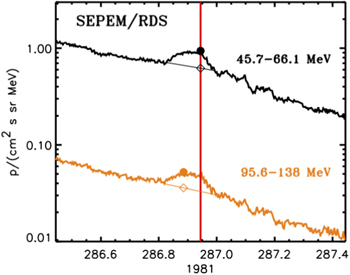
Figure 2. Example of the ESP event size computation for the 45.7–66.1 MeV (black curve) and 95.6–138 MeV (orange curve) proton energy channels of the SEPEM/RDS data set. The red vertical line indicates the passage of the IP shock. The solid dots indicate the peak intensity observed during the ESP intensity enhancement. Note that the peak intensity at 45.7–66.1 MeV occurred at shock passage whereas the peak at 95.6–138 MeV was prior to shock passage. The thin straight lines indicate the estimated intensity level in the absence of the ESP event assuming a continuation of the intensity decay before the ESP enhancement. The open diamonds then indicate the "background intensity" at the time of the corresponding peak intensity. The ESP size for each energy channel is then defined as the difference between the peak and background intensities. Based on Figure 1 of Mäkelä et al. (2011).
Download figure:
Standard image High-resolution imageTable 2 provides Ipk and Ibg for the selected shocks. In particular, column (1) provides the solar cycle and shock number from Table 1, while column (2) lists the time of shock passage and the spacecraft that observed the shock. The intensities Ibg and Ipk in the 42.9–51.0 MeV proton energy channel of IMP-8/GME (henceforth P19) are provided in columns (3) and (4). The equivalent intensities for the 92.5–107.0 MeV proton energy channel of IMP-8/GME (henceforth P23) are provided in columns (5) and (6). The value "–666" in column (4) or (6) indicates that no significant ESP increase was observed in energy channel P19 or P23, respectively. In these cases, Ibg corresponds to the intensity measured at shock passage. The intensities Ibg and Ipk in the 45.7–66.1 MeV proton energy channel of SEPEM/RDS (henceforth S6) are provided in columns (7) and (8). The equivalent intensities for the 95.6–138 MeV proton energy channel of SEPEM/RDS (henceforth S8) are in columns (9) and (10). Similarly, a value of "−666" in columns (8) and (10) indicates that no significant ESP increase was observed in energy channels S6 and S8, respectively, and Ibg is the intensity measured at shock passage. An intensity with the value "−999" indicates that Ibg and/or Ipk could not be estimated because of a data gap. Columns (11) and (12) indicate whether an ESP intensity increase was observed in association with passage of the shock in proton energy channel P19 (column (11)) or S6 (column (12)). The value "00" indicates that no ESP increase was observed, while "01" indicates that no ESP increase was observed but the proton intensity–time profile was elevated and flat. Values "10" and "12" indicate that an ESP intensity enhancement was observed. The value "10" indicates that the ESP intensity enhancement was observed apparently without interference from intervening structures (i.e., the shock arrived at the spacecraft in a relatively clean solar wind, devoid of intervening IP structures such as unrelated ICMEs and IP shocks), whereas "12" indicates that the ESP intensity increase occurred in the presence of intervening structures seen during or around passage of the shock, as described below in Section 2.3. Finally, column (13) lists, for those shocks displaying an ESP intensity increase in the S6 energy channel, the time when the peak intensity Ipk in this energy channel was observed, obtained using the 5-minute averages of the SEPEM/RDS data set. In general, peak intensities during ESP events tend to occur close to passage of the shock (see, e.g., Figure 3 in Lario et al. 2003). However, Ipk does not necessarily coincide with passage of the shock. For example, in the event shown in Figure 2, the 45.7–66.1 MeV proton intensity peak occurs at the time of the shock passage whereas the 95.6–138 MeV proton intensities maximize ∼1.4 hr prior to the arrival of the shock.
Table 2. Intensities Measured during the Passage of the Shocks Listed in Table 1
| Cycle- | Shock Time | 42.9–51.0 MeV | 92.5–107.0 MeV | 45.7–66.1 MeV | 95.6–138 MeV | Increase Class c | Increase Class c | Peak Time | ||||
|---|---|---|---|---|---|---|---|---|---|---|---|---|
| Shock No | yyyy/doy/hh:mm (S/C) | IMP-8/GME | IMP-8/GME | SEPEM | SEPEM | at P19 of | at S6 of | at S6 of | ||||
 a,
b
a,
b
| Ipk a |
 a,
b
a,
b
| Ipk a |
 a,
b
a,
b
| Ipk a |
 a,
b
a,
b
| Ipk a | IMP-8 | SEPEM | SEPEM | ||
| (1) | (2) | (3) | (4) | (5) | (6) | (7) | (8) | (9) | (10) | (11) | (12) | (13) |
| 21-00 | 1974/187/03:14 (I) | 2.13e-2 | 2.47e-1 | 1.01e-3 | 2.76e-3 | −999 | −999 | −999 | −999 | 12 | ⋯ | ⋯ |
| 21-01 | 1974/264/12:43 (I) | 2.30e-3 | 7.87e-3 | 7.63e-4 | 1.25e-3 | 1.19e-2 | −666 | 1.48e-3 | −666 | 10 | 00 | ⋯ |
| 21-02 | 1974/312/14:14 (I) | 1.25e-4 | −666 | 9.57e-4 | −666 | 1.02e-2 | −666 | 8.75e-4 | −666 | 00 | 00 | ⋯ |
| 21-03 | 1976/092/02:55 (SC) | 1.34e-4 | −666 | 8.52e-4 | −666 | 9.33e-3 | −666 | 6.33e-4 | −666 | 00 | 00 | ⋯ |
| 21-04 | 1976/123/18:29 (SC) | 7.07e-3 | −666 | 1.39e-3 | −666 | 7.85e-3 | −666 | 1.05e-3 | −666 | 00 | 00 | ⋯ |
| 21-05 | 1977/264/20:44 (I) | 2.94e-3 | −666 | 1.03e-3 | −666 | 1.33e-2 | −666 | 2.72e-3 | −666 | 00 | 00 | ⋯ |
| 21-06 | 1977/287/11:51 (SC) | 1.47e-4 | −666 | 8.93e-4 | −666 | 1.21e-2 | −666 | 2.61e-3 | −666 | 00 | 00 | ⋯ |
| 21-07 | 1977/329/12:14 (SC) | 7.14e-3 | −666 | 1.38e-3 | −666 | 1.67e-2 | −666 | 3.07e-3 | −666 | 00 | 00 | ⋯ |
| 21-08 | 1978/003/20:42 (I) | 5.25e-3 | 9.84e-3 | 1.13e-3 | 2.34e-3 | 1.27e-2 | 2.53e-2 | 2.36e-3 | 4.33e-3 | 10 | 10 | 003/21:20 |
| 21-09 | 1978/045/21:45 (SC) | 8.84e-2 | 3.20e-1 | 1.03e-3 | −666 | 2.80e-2 | 4.62e-2 | 2.57e-3 | 4.62e-3 | 10 | 10 | 045/22:30 |
| 21-10 | 1978/103/19:25 (I) | 1.60e-3 | −666 | 6.70e-4 | −666 | 9.61e-3 | −666 | 1.89e-3 | −666 | 00 | 00 | ⋯ |
Notes.
a Intensity units (cm2 s sr MeV)−1; −999 indicates a data gap; −666 in Ipk indicates no significant increase associated with the shock passage. b For those events with Ipk = −666 (i.e., class-0 events), Ibg provides the intensity measured at the shock passage (i.e., Ishock). c 00 = No increase observed in association with the shock passage. 01 = No increase on almost flat intensity profile. 10 = Clean increase without intervening IP structures. 12 = Increase modulated by prior/intervening IP structures.Only a portion of this table is shown here to demonstrate its form and content. A machine-readable version of the full table is available.
Download table as: DataTypeset image
2.3. Distinguishing between Events without (Class-10) or with (Class-12) Intervening Structures Present
Figure 3 shows two ESP events that extend above 40 MeV associated with the passage of shocks on days 1989/229 (left column) and 1989/293 (right column). The top panels show 45.7–66.1 MeV (black trace) and 95.6–138 MeV (orange trace) proton intensities from the SEPEM/RDS data set. The red arrows identify the onset of the solar flare associated with the origin of the two events. Panels (b)–(d) show the solar wind proton speed, density, and temperature observed by IMP-8/PLS, and panels (e)–(g) the magnetic field magnitude and angular orientation in Geocentric Solar Ecliptic (GSE) coordinates from the magnetic field experiment on IMP-8. Panel (h) shows the Dst index. The vertical red lines identify the passage of shocks and/or occurrence of SCs as described by Richardson et al. (1994) in the case of the event on 1989/229 and by Cane & Richardson (1995) in the case of the event on 1989/293. The gray shaded vertical bars in the right column indicate the passage of ICMEs as described by Cane & Richardson (1995). The IP shocks observed late on days 229 and 293 (indicated by solid red vertical lines) were associated with the solar eruptions that were the origin of the SEP events, whereas the shocks observed earlier on these days (indicated by dashed red vertical lines) were not related to these eruptions and are therefore classified as passing shocks. A weak SC at the time of the first vertical red line on day 229 was followed by a region of quiet magnetic field and low-temperature plasma that could possibly be related to an ICME (Richardson et al. 1994). Similarly, the first shock on day 293 was followed by a brief structure, indicated by vertical gray shading, immediately preceding the arrival of the main shock. This structure, with anomalous depressions in both solar wind proton temperature and magnetic field intensity, could be associated with an ICME (e.g., Cane & Richardson 1995; Lario & Decker 2002). In both cases, Ipk in the high-energy ESP enhancement occurred during the passage of the structure preceding arrival of the IP shock associated with the SEP event and not at shock passage. Our assumption is that these intervening structures played a role in determining the properties of the ESP event, and we therefore classify these two events as class 12 in column (12) of Table 2. Similarly, the ESP event on 2014/255 shown in Figure 1 is classified as class 12 because of the presence of the preceding shock and its possible effects on the particle intensity–time profile of the ESP event.

Figure 3. High-energy ESP events observed on day 229 (left column) and day 293 (right column) of 1989. From top to bottom: (a) 45.7–66.1 MeV (black curve) and 95.6–138 MeV (orange curve) proton intensities from the SEPEM/RDS data set. Proton solar wind (b) speed, (c) density, and (d) temperature observed by IMP-8/PLS. Magnetic field (e) magnitude, (f) polar angle, and (g) azimuth angle in GSE coordinates from the IMP-8 magnetic field experiment. (h) Geomagnetic Dst index. The red arrows in panels (a) identify the onset time of the solar flare at the origin of the SEP event. The red vertical lines indicate the passage of IP shocks or the occurrence of SCs (dashed lines for passing shocks and solid lines for the shocks associated with the origin of the SEP event). The gray shadowed vertical bars indicate the passage of ICMEs as identified by Cane & Richardson (1995). The thin straight lines in panels (a) indicate the estimated intensity level assuming a continuation of the intensity decay before the ESP event enhancement. The solid dots indicate peak intensity during the ESP enhancement, and the open diamonds the background intensity at the time of peak intensity. The purple triangle identifies the peak intensity of the prompt component of the SEP event in the S6 energy channel.
Download figure:
Standard image High-resolution imageIn contrast, Figure 4 shows two ESP events that were not preceded by any clear IP structures that could have affected the SEP event intensity–time profiles. The shock on day 1994/052 (left column in Figure 4) has been studied by several authors (e.g., Humble et al. 1995; Koi et al. 1995; Terasawa et al. 1995). It is an example of a strong IP shock with an ESP event that was observed even by ground-based neutron monitor stations, indicating that the intensity increase extended to GV protons (Humble et al. 1995). Integral channels of the High Energy Proton and Alpha Particles Detector (Sellers & Hanser 1996) on board GOES-6 also detected clear increases at energies >355 MeV and >430 MeV in association with the passage of this shock (see Figure 3 in Humble et al. 1995). In this case, peak intensity was observed very close to passage of the shock. The ESP event associated with the shock on day 238 of 1998 (right column in Figure 4) displayed an irregular intensity–time profile. The time profiles of the solar wind moments and magnetic field magnitude and orientation preceding the arrival of the IP shock do not show any evidence of the passage of any large-scale structure that could have affected the properties of the ESP event. The structure of the shock associated with this ESP event on 1998/238 was studied by Bale et al. (1999). These authors invoked shock surface rippling to explain the variability of IP type II radio bursts (see also Pulupa & Bale 2008). Although the shock seems to be isolated from intervening IP structures, the irregular intensity–time profile observed during this ESP event could be due to the effects of these large-scale shock ripples (Decker 1990). Owing to the absence of clear unrelated IP structures during this event, we classify the intensity enhancement associated with this shock passage as class-10 in column (12) of Table 2.

Figure 4. High-energy ESP events observed on day 1994/052 (left column) and 1998/238 (right column) with the same format as Figure 3. The solar wind parameters and the magnetic field vectors for the event on 1994/052 were obtained from IMP-8/PLS and the magnetic field experiment on IMP-8, whereas for the event on 1998/238 they were obtained from ACE/SWEPAM and ACE/MAG. The solid red vertical lines indicate the passage of IP shocks. The identification of the particle intensity increase indicated as the ESP event is based on the analysis of the intensity–time profiles at lower energies. The thin straight lines in the top panels indicate the estimated intensity level assuming a continuation of the intensity decay before the ESP event enhancement. The solid dots indicate the peak intensity during the ESP intensity enhancement, and the open diamonds the background intensity at the time of the peak intensity. The purple triangle identifies the peak intensity of the prompt component of the SEP event in the S6 energy channel. In these cases, the shocks were not preceded by structures that might have affected the SEP event intensity–time profiles.
Download figure:
Standard image High-resolution imageFigures 3 and 4 show that the peak intensity Ipk in the ESP event does not necessarily coincide with passage of the shock. Figure 5 shows, for those events with an intensity increase in the energy channel S6 as per our criteria described above, the number distribution of the delays between the time of shock passage listed in column (2) of Table 2 and the time when the peak intensity in the 45.7–66.1 MeV proton channel of the SEPEM/RDS data set was observed (column (13) in Table 2). The times of peak intensities have been identified using the 5-minute averages of the proton intensities provided in the SEPEM/RDS data set, whereas the shock and SC times have been identified with a 1 minute resolution. Since the SEPEM/RDS data set is based on GOES data and the shock passage times, with the exception of SC occurrences, are based on the identification of a shock using plasma and magnetic field data by either IMP-8, ACE, Wind or SOHO, we have considered the possible delay existing between the detection of the shock at the spacecraft's location and the arrival of the shock at a geostationary orbit. With this purpose, we have considered both the coordinates of the spacecraft as provided by the NASA Satellite Situation Center 13 and the transit shock speed Vtrans (listed in column (4) of Table 1) to estimate the time delay for the shock to travel to a location of 6.6 Earth radii by assuming that the shock propagated along the x-axis of the GSE coordinate system (i.e., using the flat delay method described in Baumann & McCloskey 2021). Therefore, the time delays considered in Figure 5 have been corrected for this discrepancy between the locations of the shock detection and where the particle measurements are collected. Negative times in Figure 5 indicate that the peak intensity occurs after shock passage (tpeak > tshock), whereas positive times indicate that peak intensities are observed prior to shock passage (tpeak < tshock). The distribution in the top panel is for those ESP events occurring in the absence of intervening IP structures unrelated to the shock (class 10 in column (12) of Table 2) while that in the bottom panel is for those events where unrelated IP structures might have affected the ESP event intensity–time profiles (class 12 in column (12) of Table 2). The distribution of time delays for the class-10 events is centered around zero, with a tendency for Ipk to be observed after the shock passage (for 16 events Ipk occurred before the shock passage, whereas for 20 events Ipk occurred after the shock passage, with a maximum delay of 5.46 hr for the eastern event, E82, on 1984/051, as typically observed in events generated from eastern longitudes; Cane et al. 1988; Reames 2023). In contrast, the class-12 events show a more extended distribution, with 10 events where Ipk occurred after the shock passage and 21 events where Ipk was observed before the shock passage. The maximum delay between shock passage and peak intensity was ∼6.14 hr for the class-12 event on day 1989/229 shown in the left column of Figure 3. Several factors may contribute to the delay between tpeak and tshock. These may include the spacecraft magnetically connecting to remote regions of the shock that accelerate particles more efficiently than the region encountered by the spacecraft, efficient trapping and/or acceleration of particles occurring downstream of the shock, and, in the case of class-12 events, preceding intervening structures that may help to shape the observed ESP intensities.
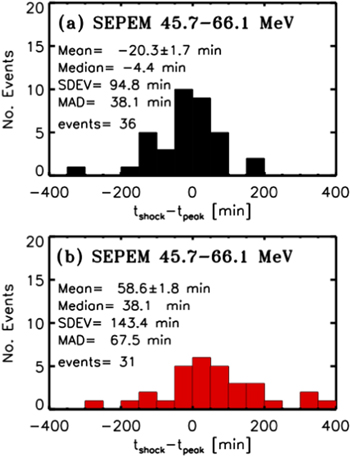
Figure 5. Number distribution of the time delays between peak intensity and shock passage for those ESP events showing a SEPEM/RDS 45.7–66.1 MeV proton intensity increase (top panel) in the absence of IP structures (class-10 events) and (bottom) with the presence of IP structures unrelated to the IP shock (class-12 events). The errors in the mean delay are computed assuming a 10 minute error in estimating individual time delays. SDEV and MAD stand for the standard deviation and the median absolute deviation, respectively.
Download figure:
Standard image High-resolution image3. Relation between Energetic Storm Particle Events and Solar Eruption Parameters
In this section, we analyze whether the properties of the solar eruption associated with the origin of the IP shock differentiate between whether or not a >40 MeV proton ESP intensity enhancement is associated with passage of the shock. Figure 6 shows the distributions of solar eruption properties for the events detailed in Tables 1 and 2 for which the 45.7–66.1 MeV proton intensity from SEPEM/RDS is used to distinguish whether or not an intensity enhancement was observed. For four of the selected IP shocks, SEPEM/RDS data were unavailable. Therefore, Figure 6 considers a total of 186 events out of the 190 events listed in Tables 1 and 2.

Figure 6. Distribution of events as a function of (first column) the peak intensity FSXR of the 1–8 Å soft X-ray (SXR) emission of the solar flare associated with the origin of the SEP event and shock; (second column) the plane-of-sky speed of the CME associated with the origin of the event as reported at cdaw.gsfc.nasa.gov/CME_list/; (third column) the average transit speed of the shock between the Sun and 1 au; and (fourth column) the longitude of the solar eruption associated with the observed shock. In each column, the top panel includes the events for which the 45.7–66.1 MeV proton intensity from SEPEM/RDS allows us to discern whether an intensity enhancement was observed, the second panel those events not showing an ESP increase in the S6 energy channel (00 or 01 in column (12) of Table 2), the third panel those events showing an ESP enhancement without any intervening structure (10 in column (12) of Table 2), and the bottom panel events where intervening structures might have played a role in the ESP intensity enhancement (12 in column (12) of Table 2). SDEV and MAD stand for the standard deviation and the median absolute deviation, respectively. The events showing >40 MeV proton ESP intensity increases tend to be associated with more intense solar flares ((c), (d)) and faster CMEs ((g), (h)) than those without such intensity increases ((b), (f)). The average transit speed of shocks without >40 MeV proton intensity increases (j) is lower than for those shocks showing intensity increases ((k), (l)). The longitudinal distribution of events associated with shocks without ESP intensity increases (n) displays a bias toward western longitudes because such shocks tend to occur during the decay of SEP events generated from western longitudes. In contrast, shocks with ESP intensity increases ((o), (p)) mostly originate from central meridian longitudes.
Download figure:
Standard image High-resolution imageThe first column of Figure 6 shows the distribution of the logarithm of the 1–8 Å SXR peak intensities (FSXR) for events for which an X-ray solar flare temporarily associated with the origin of the observed IP shock could be identified. Note that SXR flare data are not available for events prior to 1976, and for events prior to mid-1980 FSXR is provided just with a single digit. Figure 6(a) contains all events listed in Table 1 for which a solar flare has been identified. Note that the shock on day 1990/150 most likely originated behind the west limb and so an X-ray flare was not cataloged, and the shock on day 2014/051 was most likely generated by the disappearance of a solar filament (DSF in Table 1) for which a SXR flare was not reported. Therefore, Figure 6(a) includes only 182 events. For these 182 events, Figure 6(b) shows, as a function of FSXR, the distribution of those events that do not show a significant intensity enhancement in the S6 energy channel associated with passage of the shock (i.e., a class-0 event, indicated by 00 or 01 in column (12) of Table 2). Figure 6(c) shows the same distribution but for those events that show a 45.7–66.1 MeV proton ESP intensity enhancement in a relatively clean solar wind environment (i.e., a class-10 event, indicated by 10 in column (12) of Table 2), while Figure 6(d) includes those events that show a 45.7–66.1 MeV proton intensity ESP enhancement occurring with the presence of intervening structures (i.e., a class-12 event, indicated by 12 in column (12) of Table 2).
The prerequisite of the presence of >40 MeV protons leads to a FSXR distribution that tends toward flares that are much more intense (e.g., Swalwell et al. 2017) compared to the general distribution of SXR flare intensities observed over several solar cycles (e.g., Figures 5(a) and 6(a) in Lario 2012). In particular, the FSXR distribution in Figure 6(a) is centered around ∼X1 (i.e., FSXR = 10−4 W m−2) with a deficit of C-class flares and an excess of X-class flares with respect to the general SXR flare distribution. The maximum SXR flare intensity in our data set is 2.8 × 10⁻³ W m−2 (i.e., X28) associated with the eruption related to the shock on day 2003/310 (e.g., Lario et al. 2005a). Additionally, the SXR flares related to the origin of those IP shocks at 1 au without a clear >40 MeV proton intensity enhancement tend to be weaker (Figure 6(b)) than those associated with IP shocks displaying >40 MeV proton intensity enhancements (Figures 6(c)–(d)). The class-12 events, where the ESP intensity enhancement is influenced by unrelated IP structures, tend to be associated with very intense flares and none is associated with a C-class flare.
The association of the selected IP shocks with CMEs was facilitated by the nearly continuous observations from SOHO/LASCO starting at the end of 1995. Out of the 190 events in Table 1, we have been able to identify the CME related to the origin of the SEP event and the IP shock for 92 events in solar cycles 23 and 24 (four events in solar cycle 23 took place during SOHO/LASCO downtimes in 1998 August–September and in 2004 September). All the events for which we could associate a CME were associated with either halo (H) or partial halo (PH) CMEs as reported in the CDAW LASCO/CME catalog. Figure 6(e) shows the distribution of the plane-of-sky CME speeds for these 92 events. As expected, the periods with >40 MeV proton intensities are associated with eruptions with fast CMEs (e.g., Chandra et al. 2013, and references therein). The distributions of events in terms of VCME shown in Figures 6(e)–(h) contrast with the plane-of-sky CME speed distributions obtained when considering the general population of all CMEs observed by LASCO (e.g., Figure 1 in Yurchyshyn et al. 2005). The distribution of plane-of-sky speeds for the 92 events (Figure 6(e)) is centered at about ∼1400 km s−1 with an extended tail of events at high speeds, reaching a maximum speed of 3387 km s−1 for the event on 2004/316. Figure 6(f) shows that the number of class-0 events associated with a fast (>1000 km s−1) VCME is lower than that for the general distribution of events in Figure 6(e). The average plane-of-sky speed in Figure 6(f) is about ∼1386 km s−1, with a minimum value of 560 km s−1 for the event on 1999/183 generated near central meridian (E01) longitudes (which however may be underestimated due to projection effects), and the maximum is VCME = 3242 km s−1 for the event on 2005/021 generated from western (W61) longitudes for which the LASCO images were compromised by SEPs (see notes in the CDAW LASCO CME catalog). In contrast, the class-10 events (Figure 6(g)) are associated with CMEs having speeds above the VCME = 1119 km s−1 found for the central meridian (E15) event on 2000/160. Similarly, for the class-12 events (Figure 6(h)), the minimum CME speed is 938 km s−1 for the central meridian (W15) event on 1998/124, and six events were associated with CME speeds above 2000 km s−1.
The times of shock passage at 1 au (column (2) in Table 1) and the associated solar eruption (column (3) in Table 1) can be used to compute the average shock transit speed Vtrans from the Sun to ∼1 au, as listed in column (4) of Table 1. Figure 6(i) shows the distribution of Vtrans for the 186 cases for which the 45.7–66.1 MeV proton intensities from the SEPEM/RDS data set can distinguish whether or not an intensity enhancement was observed. The Vtrans distribution peaks between 600 and 800 km s−1 with a long tail of events at higher speeds, including two events in late 2003 October with exceptionally large (>2000 km s−1) transit speeds (Zurbuchen et al. 2004). Figure 6(j) shows that the Vtrans distribution for the class-0 events also peaks in the interval 600–800 km s−1 but displays a less pronounced higher-speed tail. In contrast, the shocks showing 45.7–66.1 MeV proton intensity ESP enhancements have a much flatter Vtrans distribution, extending, in the case of the class-10 events, from 577 to 1340 km s−1, and in the case of the class-12 events from 708 to 1473 km s−1 with the two exceptionally fast shocks on 2003/302 (Vtrans = 2066 km s−1) and 2003/303 (Vtrans = 2109 km s−1). On average, the IP shocks showing 45.7–66.1 MeV proton intensity ESP increases tend to have higher average transit speeds, but there is not a clear threshold value of Vtrans that distinguishes whether an IP shock will exhibit a >40 MeV proton intensity increase.
Finally, the fourth column of Figure 6 shows the longitudinal distribution of the solar eruptions that generated the 186 IP shocks for which the SEPEM/RDS data can distinguish whether an intensity enhancement was observed in the S6 channel. Negative (positive) values are for those events generated eastward (westward) of central meridian relative to Earth. As expected, the longitudinal distribution of the solar eruptions generating IP shocks observed near Earth is centered around central meridian, with the furthermost locations being E90 for the shocks on 1979/232 and 1981/283, and W120 for the shock on 1990/150 (locations beyond the west limb assume that the SEP event originated in an AR that was active during its transit over the visible Sun and had rotated over the west limb when the onset of the SEP event occurred). Figure 6(m) also exhibits a slight bias toward western longitudes, with more populated bins around well-connected longitudes ∼+50° since the prerequisite of elevated >40 MeV proton intensities favors the occurrence of SEP events generated from western longitudes (see, e.g., Figure 1 in Van Hollebeke et al. 1975). The intensity–time profiles of SEP events generated from western longitudes tend to peak shortly after the solar eruption followed by a gradual decay without any additional intensity increase at the passage of the shock (Cane et al. 1988). Therefore, the longitudinal distribution of events not showing any 45.7–66.1 MeV proton intensity ESP enhancement in Figure 6(n) is even more biased toward western longitudes. In contrast, the solar eruptions associated with those IP shocks exhibiting high-energy ESP enhancements are more centered at longitudes around central meridian. In comparison, the general longitudinal distributions of SEP events at lower energies show a double peak, one centered at well-connected longitudes and the other at longitudes around central meridian (see, e.g., Figure 4 in Smart & Shea 1996 and Figure 11 in Aran et al. 2017 for the case of >10 MeV and 7.2–10.5 MeV proton events, respectively, where the events were selected without the requirement of observing an IP shock at 1 au).
3.1. Relation between Energetic Storm Particle Event Intensities and Solar Eruption Parameters
While Figure 6 shows numerical distributions of the selected IP shocks as a function of Vtrans and parameters associated with the parent solar eruptions, it does not address possible interdependencies between these parameters and the intensities measured during the ESP events. Figure 7 shows the peak intensities Ipk for different data sets/energy ranges listed in columns (4), (6), (8), and (10) of Table 2 as a function of (left column) the longitude of the parent solar eruption as listed in column (3) of Table 1 and as a function of (right column) the shock transit speed Vtrans listed in column (4) of Table 1. The open symbols in Figure 7 indicate those IP shocks where no significant ESP intensity enhancement has been observed in the vicinity of the shock (indicated by −666 in columns (4), (6), (8), and (10) of Table 2). For these events, we plot the values Ibg indicated in columns (3), (5), (7), and (9) of Table 2, which are the actual intensities measured at the time of the shock passage (i.e., Ibg = Ishock in the case of class-0 events). The solid symbols in Figure 7 represent Ipk for those events where a significant ESP intensity enhancement has been observed in association with the passage of the shock (black for those events classified as class 10 in columns (11) and (12) of Table 2, and red for those events classified as class 12). Note that the event classification is based on the presence of IP structures in those events showing intensity increases in the IMP-8/GME 42.9–51.0 MeV or SEPEM/RDS 45.7–66.1 MeV proton intensities, and here we have maintained the same classification for the ESP events showing intensity enhancements in the 92.5–107 MeV energy channel of IMP-8/GME in Figures 7(c)–(d) and the 95.6–138 MeV energy channel of SPEM/RDS in Figures 7(g)–(h) (i.e., the same color code has been applied to each event for energy channels P19 and P23, and S6 and S8). In the right column of Figure 7, a linear least-squares fit to all the data points in each panel has been added (straight blue lines). The legend in blue gives the inferred linear dependence, the linear Pearson correlation coefficient rP , the Spearman's rank correlation rS applied to the whole set of data points and the significance of its deviation from zero p (a small p-value indicates a significant correlation; see Press et al. 2002 for definitions and computational details).
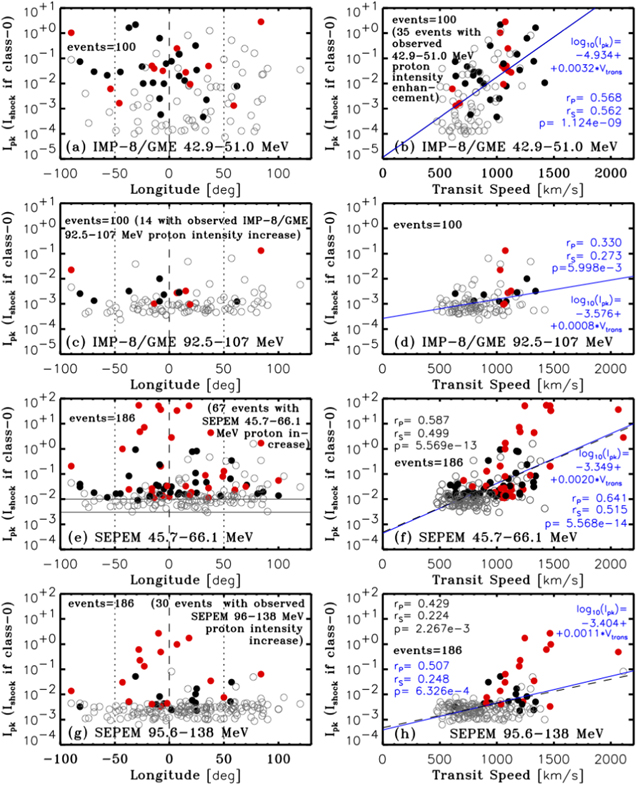
Figure 7. Proton intensities observed during passage of the IP shocks. For those events with no significant ESP intensity increase (open gray circles), the intensity at the shock is shown, while the peak intensity of the ESP event is used for those events with intensity increases (solid symbols). The panels show intensities in the 42.9–51.0 MeV IMP-8/GME, 92.5–107 MeV IMP-8/GME, 45.7–66.1 MeV SEPEM/RDS, or 95.6–138 MeV SEPEM/RDS proton channels as a function of (left) the longitude of the parent solar eruption, and (right) shock transit speed. The units on the vertical axis are particles (cm2 s sr MeV)−1. The black (red) solid symbols correspond to the events indicated by 10 (12) in columns (11) and (12) of Table 2 when using the IMP-8/GME or the SEPEM/RDS database, respectively. The thin horizontal lines in panel (e) located at the values 10−2 and 3 × 10⁻³ (cm2 s sr MeV)−1 indicate the effect of the larger instrumental backgrounds in the data sets used to create the SEPM/RDS data set compared to IMP-8/GME data. The statistics are much better for the SEPEM events, which show larger intensity increases for events near central meridian and for faster shocks. The blue straight lines in the righthand panels are linear least-squares fits obtained over all data points. The blue legends show the linear relation (all significant at p <0.01), the coefficients rP and rS , and the p-value. Panels (f) and (h) also show black dashed straight lines obtained from linear least-squares fits excluding the two fast events on 2003/302 and 2003/303 (rP , rS , and p values indicated in the black legend).
Download figure:
Standard image High-resolution imageFigure 7(a) shows that the longitude of the parent solar eruption does not regulate the 42.9–51.0 MeV proton peak intensities measured by IMP-8/GME during the selected events, i.e., a range of intensities are found at all longitudes. In contrast, Figure 7(b) shows that these intensities correlate relatively well with Vtrans, with the events with significant intensity enhancements at the shock (solid symbols) showing, on average, larger intensities than those events without significant intensity increases (open symbols). IMP-8/GME provided data for only 100 of the 190 events in Table 2, and of these 100 events only 35 displayed a significant increase in the P19 energy channel, and just 14 exhibited a significant intensity enhancement in the P23 energy channel. Figure 7(c) and (d) show, as a function of the longitude of the parent solar eruption and of Vtrans, respectively, the 92.5–107 MeV proton peak intensity measured by IMP-8/GME for these 14 events (solid symbols) together with Ishock for those events without intensity increase (open symbols). Since the P23 energy channel is affected by an elevated background dominated by penetrating galactic cosmic rays that varies over the solar cycle, most of the open symbols in Figures 7(c) and (d) cluster just below 10−3 (cm2 s sr MeV)−1. For some periods, P23 registers an even higher intensity than that measured in the P19 channel. From Figures 7(c) and (d), it is not possible to infer a clear dependence of the peak intensities in the P23 energy channel on either Vtrans or the longitude of the parent solar eruption.
Figure 7(e) shows that, using the more abundant sample of events obtained from the SEPEM/RDS data set, it is possible to identify a dependence between the longitude of the parent solar eruption and Ipk. Larger peak intensities occur for those events originating around central meridian (indicated by the vertical dashed line), and the largest peak intensities are obtained for class-12 events (red). However, the SEPEM/RDS intensities are affected by a larger background than that of IMP-8/GME, and hence the open symbols tend to cluster at intensities just below 10−2 (cm2 s sr MeV)−1. Consequently, it is possible to detect small SEP intensity increases using the P19 channel of IMP-8/GME but not using the S6 channel of SEPEM/RDS. However, IMP-8/GME does not provide usable data for large, intense events, such as during the passage of the shocks on 1989/293, 1991/083, 2000/197, and 2001/268. Also, the GME data set used for this study, extending to the official end of the IMP-8 mission in 2001 October, does not include the intense events occurring in the second half of solar cycle 23 (contact with IMP-8 was finally lost in late 2006). These include the events on 2001/310, 2003/301, and 2003/303. Such events are the most intense seen in channels S6 and S8 shown in Figures 7(e) and (g). Therefore, the possible dependence of Ipk with the longitude of the parent solar eruption evident in Figures 7(e) and (g) cannot be perceived in Figure 7(a).
Figure 7(f) shows a possible dependence between the particle intensity and Vtrans, similar to that shown in Figure 7(b) but extending to larger intensities. However, the cluster of open symbols in the bottom-left corner of the figure produces a linear regression fit (applied to all data points in Figure 7(f)) that does not reach the most intense events (note that events without a significant intensity enhancement, i.e., the open symbols in Figure 7, were given the same weight as those represented by the solid symbols in the linear least-squares fit). The analysis of the same possible dependencies when considering only those events showing an ESP intensity enhancement (i.e., the solid symbols in Figure 7) is deferred to Figure 8 below. The extremely fast events on 2003/302 and 2003/303 with Vtrans > 2000 km s−1 (Zurbuchen et al. 2004) in the upper-right corner of Figure 7(f) may have an influence in the linear regression fit shown in blue in Figure 7(f). For this reason, we have considered an alternative fit excluding these two unusual fast events, but this does not modify the inferred correlation between particle intensity and Vtrans as indicated by the coefficients in black and the linear fit (dashed black line) shown in Figure 7(f).
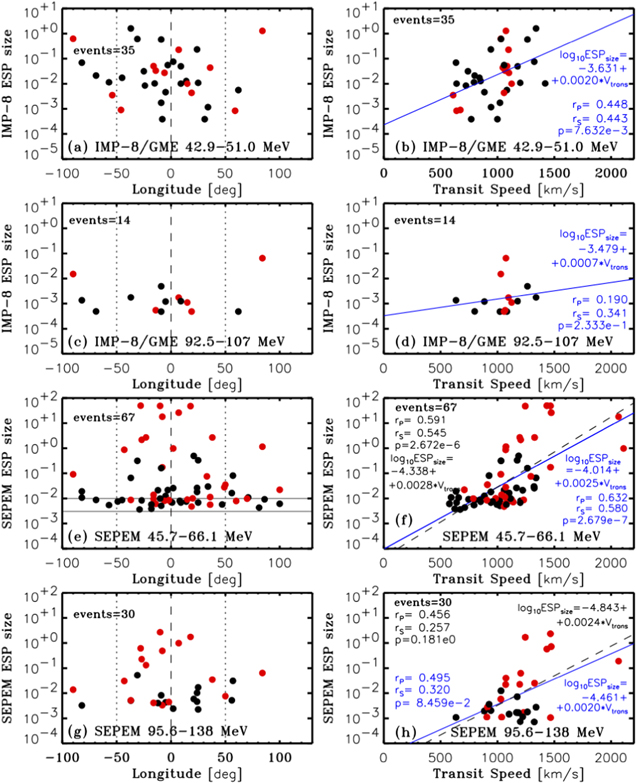
Figure 8. Sizes of the ESP enhancement for those events showing an increase (class-10 events in black and class 12 in red) in the 42.9–51.0 MeV proton energy channel of IMP-8/GME, 92.5–107 MeV proton energy channel of IMP-8/GME, 45.7–66.1 MeV proton energy channel of SEPEM/RDS, or 95.6–138 MeV proton energy channel of SEPEM/RDS as a function of (left) the longitude of the parent solar eruption, and (right) the shock transit speed. The units of the ESP size are (cm2 s sr MeV)−1. Linear least-squares fits are represented by blue straight lines in the right column when applied to all the data points in each panel. The black dashed straight lines in panels (f) and (h) show the similar fits obtained when excluding the extremely fast Vtrans values from the events in late 2003 October. The statistics are much better for the SEPEM events, which show larger ESP sizes for events near central meridian and for faster shocks.
Download figure:
Standard image High-resolution imageFinally, Figures 7(g) and (h) show the 95.6–138 MeV proton peak intensities obtained from the S8 channel as a function of the longitude of the parent solar eruption and of Vtrans, respectively. Out of the 186 events in Table 2 with available SEPEM/RDS data, an ESP intensity enhancement in the S8 channel was observed in 30 events. For four of these events (on 1989/299, 1998/238, 2001/268, and 2006/348), the peak intensity increased over the background only by a factor of ∼20%, whereas for the remaining 26 events the increase was above 30%. Figure 7(g) shows that the largest ESP intensities are observed for those events originating close to central meridian, with the class-12 events making the most prominent contribution. Figure 7(h) suggests that the dependence between Vtrans and particle intensity is weaker with increasing energy. Exclusion of the exceptionally fast events on 2003/302 and 2003/303 does not significantly change the dependence shown by the dashed black straight line in Figure 7(h).
Since the possible dependencies shown in Figure 7 between Ipk and the longitude of the parent solar eruption and Vtrans can be affected by events that did not show any significant ESP intensity increase in the vicinity of shock passage, Figure 8 shows the same distributions but excluding the class-0 events and keeping only those events with significant intensity increases (i.e., class-10 and class-12 events). Instead of plotting Ipk or the intensity measured during shock passage for the class-0 events as in Figure 7, in Figure 8 we consider the ESP size defined as Ipk − Ibg.
The panels in the right column of Figure 8 show the possible correlation between the ESP size and Vtrans for the events showing intensity enhancements. The exclusion of class-0 events, which were mostly clustered at slow transit speeds, worsens the possible correlations for the scarce IMP-8/GME data points (the correlations are only significant at p <0.01 for the energy channel P19 and insignificant for P23). Nevertheless, a significant correlation is still found for the more abundant sample of events using the S6 energy channel (Figure 8(f)). Both linear least-squares fits obtained when considering either all data points (blue straight line and blue labeled correlation coefficients in Figure 7(f)) or when excluding the two unusually fast shocks on 2003/302 and 2003/303 (dashed black straight lines in Figures 7(f) and 8(f)) are still significant (p ≪ 0). However, the correlations between Vtrans and the ESP size obtained from the 30 events with intensity increases in the S8 energy channel are still poor with or without considering the event on 2003/302.
The panels in the left column of Figure 8 show that the scarcity of events in the IMP-8/GME data does not allow us to discern any longitudinal dependence in the ESP size, whereas the most intense events detected using SEPEM/RDS data are clearly concentrated around central meridian, especially the class-12 events that show the largest ESP sizes. The events with the smallest ESP sizes fall between the two horizontal straight lines in Figure 8(e) (at intensities 3 × 10⁻³ and 10−2 (cm2 sr s MeV)−1) and spread over the whole range of longitudes. The elevated background intensities in the SEPEM/RDS data set may influence the clustering of points in this narrow intensity range. The presence of a small ESP intensity increase in these events has been confirmed by comparing with IMP-8/GME and SOHO/ERNE data that are less affected by elevated background intensities. However, IMP-8/GME and SOHO/ERNE do not provide valid data during the most intense events, so hereafter we use only the intensities obtained from the SEPEM/RDS data set.
4. Relation between Energetic Storm Particle Size and Shock Parameters
Figure 9 shows the peak intensity Ipk for those events showing an ESP intensity increase (i.e., class-10 and class-12 events represented by solid black and red symbols, respectively) and Ishock for those events without any significant intensity increase (i.e., class-0 events, represented by open symbols) as a function of (a) the shock speed VSC in the spacecraft frame of reference, (b) the shock speed Vsh in the upstream solar wind frame of reference, (c) the shock fast magnetosonic Mach number Mms, (d) the shock Alfvén Mach number MA , (e) the shock density compression ratio rn , and (f) the angle θBn between the shock normal and the upstream magnetic field direction. The number of events in each panel is determined by the availability of shock parameters in the CfA Interplanetary Shock Database (see Table 1). This availability is affected mainly by the absence of solar wind data during periods when IMP-8 was immersed in Earth's magnetosphere or during intense SEP events that affect the functioning of plasma instruments. Linear least-squares fits that consider the errors associated with the shock parameters have been applied to each set of data points in each panel (indicated by the straight blue lines; the blue legends provide the linear dependence and the respective correlation coefficients rP and rS , and the p-value).
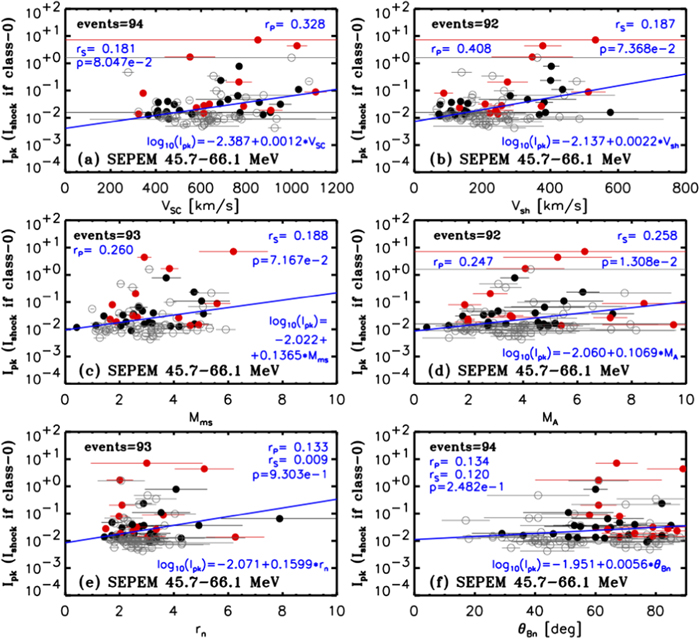
Figure 9. Peak intensity Ipk for those events showing intensity enhancements (black solid symbols for class-10 events and red solid symbols for class-12 events) and Ishock for those events not showing a significant intensity increase (open symbols) at the S6 energy channel as a function of (a) VSC, (b) Vsh, (c) Mms, (d) MA , (e) rn , and (f) θBn . The intensity units are (cm2 s sr MeV)−1. The blue straight lines in panels on the right column are linear least-squares fits obtained over all data points. The blue legends show the linear relation, the coefficients rP and rS , and the p-value.
Download figure:
Standard image High-resolution imageNo significant correlations can be inferred between the particle intensity (i.e., Ipk or Ishock) and either θBn (Figure 9(f)) or rn (Figure 9(e)). Extremely weak correlations (if any) are found between particle intensity and Mms (Figure 9(c)) or MA (Figure 9(d)). Possible correlations can be inferred for VSC (Figure 9(a)) or Vsh (Figure 9(b)), although they can be considered to be poor. Whereas most of the class-0 events cluster at low intensity values, they spread over the whole domains of θBn and MA , over a broad range of compression ratios 1 ≲ rn ≲ 4 and Mach numbers 1 ≲ Mms ≲ 6, and over a large interval of shock speeds. This spread of similar low-intensity events over a wide range of shock parameters makes it difficult to obtain strong correlations. We note that the elevated S6 intensity background may play a role in the quality of the fits especially because of the Ishock intensities assigned to the class-0 events. Additionally, most of these events are generated from western longitudes (Figure 6(n)), and occur when the SEP intensity is decaying and the local shock does not play a role. Therefore, the intensities of the class-0 events are influenced by the evolution of the SEP events rather than by the local shock parameters.
To examine the correlations when the class-0 events are removed, Figure 10 shows the ESP size for those events showing a significant intensity increase (class 10 in black and class 12 in red) as a function of (a) VSC, (b) Vsh, (c) Mms, (d) MA , (e) rn , and (f) θBn . There are still no significant correlations between the ESP size and either θBn or rn . The correlation with Mms can still be considered weak, and insignificant for MA . However, for VSC (Figure 10(a)) and Vsh (Figure 10(b)) the correlations (significant at p <0.01) improve with respect to those in Figures 9(a) and 9(b). Thus, after removing the class-0 events, the only significant correlations found between the shock parameters and the ESP size are for VSC and Vsh.

Figure 10. Size of the ESP event for those events showing intensity increase (class 10 in black and class 12 in red) at the S6 energy channel as a function of (a) VSC, (b) Vsh, (c) Mms, (d) MA , (e) rn , and (f) θBn . The intensity units are (cm2 s sr MeV)−1. The blue straight lines in panels on the right column are linear least-squares fits obtained over all data points. The blue legends show the linear relation, the coefficients rP and rS , and the p-value.
Download figure:
Standard image High-resolution imageSince VSC and Vsh would be expected, to some extent, to be related to the shock transit speed, Figure 11 examines whether there is a relation between the shock parameters and Vtrans (right column) as well as with the longitude of the parent solar eruption (left column). Again, the symbols used in Figure 11 distinguish those events with ESP particle intensity increases (solid black and red symbols for class-10 and class-12 events, respectively) or without particle intensity increases (open symbols for class-0 events). Larger shock speeds (both VSC and Vsh), as well as larger Mach numbers (both Mms and MA ) tend to be associated with events generated from close to central meridian. The compression ratios rn do not show any clear longitudinal dependence, although events with rn ≳ 4 tend to be generated from close to central meridian. No clear longitudinal dependence can be found for θBn . Figures 11(g) and (h) show a clear correlation between Vtrans and both VSC and Vsh, respectively. We find weak correlations between Vtrans and either Mms and MA (Figures 11(i)–(j)), whereas correlations between Vtrans and either rn or θBn are absent (Figures 11(k)–(l)).
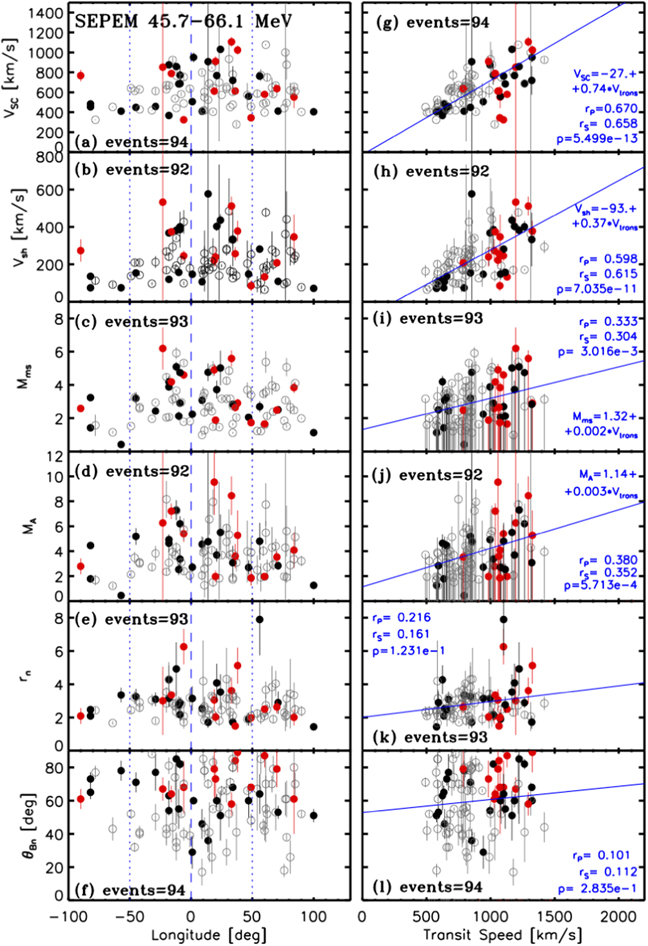
Figure 11. Possible correlations between the shock parameters (from top to bottom: VSC, Vsh, Mms, MA , rn , θBn ) and the longitude of the parent solar eruption (left column) and the shock average transit speed Vtrans (right column). The symbols in each panel are for the events classified as class 0 (open symbols), class 10 (black symbols), and class 12 (red symbols) when using the energy channel S6 of SEPEM/RDS. Linear least-squares fits are represented by the blue straight lines in the right column.
Download figure:
Standard image High-resolution imageSince Figure 11 shows that the largest shock speeds and Mach numbers tend to be associated with events generated from longitudes within ±50° of the central meridian and with large transit speeds Vtrans, it is worth considering if there is an interdependence among these parameters. Figure 12(a) shows Vtrans versus the longitude of the parent solar eruption. As expected, the shocks with the largest transit speeds are generated from longitudes close to central meridian; maximum transit speeds generally show little variation over a source longitude range of around E40–W80. As a guideline, a parabolic function (dashed blue line) is included that encloses most of the events with the notable exceptions of the unusually fast shocks in 2003 October generated from E08 and W02 (Zurbuchen et al. 2004) and the shock on 1979/232 from E90. However, the occurrence of a solar eruption near central meridian does not necessarily lead to a fast Vtrans. A reasonable expectation is that an IP shock with a fast Vtrans will result from a fast eruption. Thus, Figure 12(b) shows Vtrans versus VCME for those events where a CME could be associated with the origin of the shock. A certain degree of correlation between Vtrans and VCME is found (significant at p < 0.01), as noted previously for other samples of ICME-driven shocks (e.g., Richardson & Cane 2010b, and references therein). The correlation may be influenced by the longitude dependence of the transit speed evident in Figure 12(a) and by the fact that VCME are plane-of-sky speeds obtained from the CDAW SOHO/LASCO CME catalog, and so projection effects may influence the computation of the CME speed toward Earth (e.g., Gopalswamy & Xie 2008). The use of CME speeds obtained using stereoscopic techniques (e.g., Mays et al. 2015, and references therein) or from spacecraft in quadrature with the CME might improve these correlations.
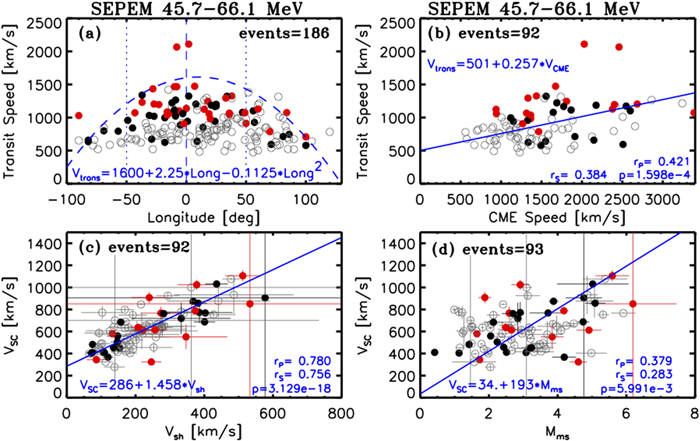
Figure 12. (a) Vtrans as a function of the longitude of the parent solar event. (b) Vtrans as a function of the plane-of-sky speed of the CME associated with the origin of the IP shock. (c) VSC as a function of Vsh. (d) VSC as a function of Mms. The symbols in each panel indicate events classified as class 0 (open symbols), class 10 (black symbols), or class 12 (red symbols) using energy channel S6 of SEPEM/RDS. The blue straight lines in panels (b)–(d) are linear least-squares fits that consider the errors associated with both variables. The blue legends provide the dependencies with the units indicated in each axis, and the correlation coefficients rP and rS , and the p-value.
Download figure:
Standard image High-resolution imageFigures 9 and 10 show that the particle intensity is better correlated with the shock speed than with Mms. Figures 12(c) and 12(d) show the correlation between VSC and Vsh and between VSC and Mms, respectively. Although there is a strong correlation between VSC and Vsh, there is not a one-to-one correspondence between the shock speeds because event-to-event variations in the solar wind found upstream of the IP shocks leads to a larger dispersion of the Vsh values than for VSC, and larger errors. Hence, the correlations found between particle intensities and the shock speed differ if VSC or Vsh is used. The correlation between VSC and Mms (Figure 12(d)) is weaker than that with Vsh, and hence the particle intensity shows a worse correlation with Mms than with VSC.
5. Discussion
This survey of IP shocks observed at 1 au during 1973–2016 generated by solar eruptions able to produce >40 MeV protons yielded 186 shocks for which it is possible to evaluate whether a particle intensity enhancement was present in the vicinity of the shock in the 45.7–66.1 MeV proton energy channel of the SEPEM/RDS data set. Of these 186 shocks, 119 (i.e., ∼64%) were not associated with a significant intensity enhancement. Of the remaining 67 IP shocks with significant intensity increases, 31 (∼46%) were accompanied by IP structures unrelated to the shock itself (such as other IP shocks and/or intervening ICMEs) that could affect the properties of the ESP event (i.e., class-12 events), whereas 36 events (∼54%) developed in a medium devoid of such structures (i.e., class-10 events).
Figure 13 shows the temporal distribution of these 186 shocks over the last ∼4 solar cycles. The ESP events with intensity enhancements meeting our selection criteria (solid symbols in Figure 13) occur much less frequently than high-energy SEP events (see, e.g., Plate 2 in Lario & Simnett 2004). The most intense ESP events tend to occur during the maximum and also decay phases of the solar cycles. In contrast, shocks with >40 MeV proton intensity increases are practically absent during solar minima. The class-12 events (red symbols in Figure 13) tend to have larger peak intensities than the class-10 events (black solid symbols in Figure 13). The observation of a class-12 event, where unrelated solar wind structures are present, usually requires the occurrence of a sequence of solar eruptions from either a single active region such as in early 1998 May (Lario et al. 2000) or several active regions, such as in late 2003 October (Lario et al. 2005a), that are most likely to occur during periods of intense activity (e.g., Ruzmaikin et al. 2011). Therefore, class-12 events usually happen during solar maximum, whereas isolated events, such as the IP shocks on 1985/116 and 1994/052, or the first event in 2006 December (2006/348), may occur during the late decay phase of a solar cycle.
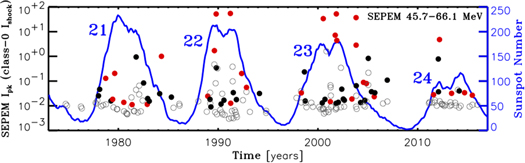
Figure 13. Temporal distribution of the proton intensities (left vertical axis) observed during the passage of the selected IP shocks for those events with no significant intensity increase (open gray circles) and of the ESP events when showing an intensity increase (solid symbols, following the convention in previous figures) obtained from the 45.7–66.1 MeV proton energy channel of SEPEM/RDS, and of the 13 months smoothed monthly sunspot number (right vertical axis) from www.sidc.be/silso/.
Download figure:
Standard image High-resolution imageThe IP shocks showing ESP intensity enhancements (class-10 and class-12 events) tend to be associated with solar events characterized by intense SXR GOES flares, usually above X1 intensity (see Figures 6(c) and (d)). The plane-of-sky speeds of the CMEs associated with IP shocks able to produce 45.7–66.1 MeV proton intensity enhancements tend to be much faster than the general distribution of CME speeds (at least for those IP shocks which could be associated with a CME; see Figures 6(g) and (h)). To examine further the relationship between CME speed and the production of ESP events, we note that Ameri et al. (2023) analyzed 116 IP shocks observed at ∼1 au during the years 1996–2015 that were generated by halo and partial-halo CMEs with plane-of-sky speeds >400 km s−1 and found that the CME speeds at the origin of the IP shocks accompanied by a 5.0–7.2 MeV proton ESP event ranged from 501 to 2861 km s−1 with an average of 1390 km s−1, whereas for those without a 5.0–7.2 MeV proton ESP event the CME speed varied from 408 km s−1 to 2285 km s−1 with an average of 913 km s−1 (see their Figure 3(a)). On the other hand, Santa Fe Dueñas et al. (2022) analyzed the speeds of CMEs associated with IP shocks with He, O, and Fe ion intensity increases in the energy range 0.1–3 MeV n−1 observed by ACE, STEREO-A, or STEREO-B (all at ∼1 au from the Sun). Instead of using the plane-of-sky CME speeds VCME, these authors considered CME speeds computed using stereoscopic techniques from multiple points of view. The distribution of CME speeds obtained by these authors (see their Figure 3) is similar to the general VCME distribution for all 186 events shown in Figure 6(e) but with a lower mean speed (1195 km s−1) compared to 1533 km s−1 in Figure 6(e). For those shocks associated with 45.7–66.1 MeV proton intensity increases, the VCME distributions in Figure 6(g) and 6(h) seem to require CME speeds above ∼1000 km s−1, extending to extreme values above 3000 km s−1. Therefore, it appears that the solar eruptions which are the origin of IP shocks able to generate ESP events at energies >40 MeV are associated with fast CMEs, whereas those shocks generating low-energy ESP intensity enhancements (i.e., 5.0–7.2 MeV protons in the study by Ameri et al. 2023 or 0.1–3 MeV n−1 ions in the study by Santa Fe Dueñas et al. 2022) may originate in association with slower CMEs.
Similarly, the distribution of Vtrans for the shocks with >40 MeV proton ESP intensity enhancements (Figures 6(k)–(l)) has a higher average speed than the shocks accompanied by 5.0–7.2 MeV proton intensity enhancements (911 km s−1; see Figure 2(a) in Ameri et al. 2023) or the shocks associated with 0.1–3 MeV n−1 ion ESP events (738 km s−1; see Figure 4 in Santa Fe Dueñas et al. 2022). This suggests that faster transit speeds are required for those shocks associated with >40 MeV proton intensity enhancements than those of lower energies. The deceleration of shocks as they propagate away from the Sun (e.g., Volkmer & Neubauer 1985) and how they accelerate particles during its transit to 1 au may also play a role in the observation at 1 au of ESP events at different energies. However, the average transit speed Vtrans of the IP shocks does not distinguish those shocks associated with >40 MeV proton intensity enhancements from those without a significant particle intensity enhancement, although the shocks with the fastest Vtrans are associated with the highest peak intensities (see Figures 7(b) and (f), which are directly comparable to Figure 7 of Santa Fe Dueñas et al. 2022). For those events showing a >40 MeV proton ESP event, we find a certain correlation between the size of the ESP event and Vtrans (see Figures 8(b) and (f)). However, this correlation becomes weaker at higher (≳90 MeV) proton energies (Figures 8(d) and (h)) because of the scarcity of events and the fact that the most intense events at these energies are class-12 events where the effects of intervening structures may have a larger effect on the production of higher particle intensities than just the Vtrans of the shock. Similar correlations between Vtrans and the peak intensity of the ESP events at lower energies were found by Ameri et al. (2023), with correlation coefficients that diminish with proton energy within the range 5.0–31.6 MeV (see their Figure 4), although these authors did not distinguish whether intervening IP structures were present.
The longitudinal distribution of the solar sources of the IP shocks with >40 MeV proton ESP intensity enhancements (Figures 6(o) and (p)) is found to be centered around central meridian but includes a wide range of longitudes from E90 to W120. These distributions are similar to the longitudinal distribution obtained for the low-energy ion ESP-associated shocks by Santa Fe Dueñas et al. (2022; see their Figure 3). The most intense, high-energy ESP events (Figures 7(e) and (g)) tend to occur within a longitude range ±50° from central meridian, similar to the result found by Santa Fe Dueñas et al. (2022) for low-energy ion events associated with fast (>1300 km s−1) CMEs (see their Figure 8).
Among the shock parameters analyzed in the present work (i.e., VSC, Vsh, Mms, MA , rn , and θBn , obtained for about 94 events), only the shock speeds VSC and Vsh display moderate correlations with either the peak intensity or ESP size (Figures 9(a)–(b) and 10(a)–(b)). The correlations between the peak intensity or the ESP size with the shock Mach numbers Mms and MA are poor or insignificant, and no correlations are found with rn and θBn . Nevertheless, there is not a specific shock speed threshold that distinguishes whether or not a shock will be accompanied by a >40 MeV proton ESP intensity increase (Figures 9(a)–(b)), and the shock speed cannot be related to a specific value for the peak intensity. These results are consistent with prior attempts to correlate ESP intensities with shock parameters. For example, Mäkelä et al. (2011) analyzed the size of ESP events observed by ACE during 1997–2006 using observations of 114–190 keV and 1.89–4.75 MeV ions from the ACE/EPAM/LEMS120 telescope (mostly dominated by protons), and found that the ESP event sizes showed only a modest correlation with the shock speed and no dependence on θBn . Reames (2012) found that the ESP 1.65–2.00 MeV amu−1 He peak intensity observed in association with the passage of 39 IP shocks by ∼1 au depended most significantly on the shock speed (rP = 0.808), whereas for the compression ratio rn the correlation was weak (rP = 0.354), and almost nonexistent (rP = 0.117) for θBn (see their Figure 8). Similarly, in the multiparameter study of 62 ESP events with 0.5–2.0 MeV n−1 He, O, and Fe ion intensity enhancements, Dayeh et al. (2018) found a moderate correlation (rP = 0.51) between the oxygen peak intensity and the shock speed, whereas for the density compression ratio rn and θBn no correlations were found (rp = 0.09 and rp = 0.07, respectively; see their Table 1). Ameri et al. (2023) found that the highest correlation between Ipk and shock parameters was found for the shock speed VSC (rP = 0.62 for 5.0–7.2 MeV protons and rP = 0.44 for 21.9–31.6 MeV protons) whereas the lowest correlation coefficients were found for the compression ratio (rP = 0.20 for 5.0–7.2 MeV protons and rP = 0.33 for 21.9–31.6 MeV protons) and θBn (rP = 0.05 for 5.0–7.2 MeV protons and rP = 0.10 for 21.9–31.6 MeV protons). All these studies indicate that, although moderate, the only correlation between the peak intensity or ESP size and the local shock parameters is found for the shock speed, though this is also only a poor predictor of the ESP peak intensity, especially at high energies.
The efficiency of a shock as a particle accelerator may depend on factors such as the parameters of the shock, the presence of an abundant seed particle population susceptible to being accelerated, and the mechanisms that allow the particles to interact multiple times with the propagating shock (e.g., Lario et al. 2005b; Guo et al. 2021, and references therein). The poor relationship between ESP events and the local shock parameters may arise because the particles observed during an ESP event may come from other regions of the shock front with different shock parameters, or even may be accelerated prior to the arrival of the shock at the spacecraft, and be confined in the vicinity of the shock forming a persistent ESP structure (e.g., Reames 2023). Also, the plasma and magnetic field measurements used to identify the passage of a shock and compute the shock parameters are single-point measurements. Therefore, parameters such as θBn or rn may be strongly affected by local irregularities of the shock and variations in the plasma and magnetic field properties of the solar wind through which the shock is propagating. To the extent that VSC and Vsh (and indirectly Mms and MA ) depend on Vtrans (right column of Figure 11), the shock speed represents more a global property of the shock (and its past history) than θBn and rn , which include a dependence on the local solar wind conditions, and hence the shock speed correlates better with the ESP intensity.
The occurrence of multiple interactions of particles with the shock may be enhanced if turbulence in the vicinity of the shock favors the scattering of particles back toward the shock or if the magnetic field configuration around the shock allows particles to return to the shock. It is possible that both situations may occur in the events that we have classified as class 12, where intervening structures such as unrelated IP shocks and/or ICMEs may have affected the development of the ESP event. This may help to account for why the class-12 events tend to have larger peak intensities and ESP sizes than the class-10 events (see Figures 8(e)–(f)), but further study of these individual events is required to assess the role of these structures on the formation of high-energy ESP events. Nevertheless, the presence of intervening structures is not a requirement for a high-energy ESP event, since some isolated IP shocks (class-10 events) can also produce (albeit weaker) >40 MeV proton intensity enhancements (see, e.g., Figure 4). Similarly, not all IP shocks propagating through solar wind with unrelated structures present produce high-energy ESP events, since some of the class-0 events also occurred in such circumstances (e.g., the events on 2000/224 and 2012/274 were associated with IP shocks preceded by magnetic clouds but no >40 MeV proton intensity increase was observed).
The role played by the seed population is difficult to evaluate since IP shocks travel for many hours (e.g., 41.5 hr for Vtrans = 1000 km s−1) through a varying background particle population that may include solar wind thermal and suprathermal ions, remnants from prior SEP events, and ions accelerated by the shock itself at earlier times. This background, which is poorly characterized observationally, will also vary from event to event. The particles observed during the ESP event may also have different origins and not be necessarily locally accelerated. To consider the possible contribution from ions accelerated by the shock at earlier times when it was still close to the Sun, we compared the peak intensity of the prompt component of the associated SEP event (Iprompt) with the intensity at the shock for the 186 events with data in the S6 energy channel of SEPEM/RDS. The purple triangles in Figures 3 and 4 exemplify how we have identified the peak intensity of the prompt component. Figure 14 compares Iprompt with (panel (a)) the intensity at shock passage for the class-0 events (open symbols) and Ipk for those events showing an ESP intensity increase (solid symbols), and (panel (b)) the ESP size for those events showing an ESP intensity increase. In both cases (Figures 14(a) and (b)), a significant correlation is found, indicating that intense SEP events facilitate the observation of elevated intensities at the shock passage, and suggesting that particles accelerated when the shock was still close to the Sun may participate in the ESP event. Similar correlations between Iprompt and the particle intensity at the shock passage have been found in previous works, although with a lower number of events at high energies (e.g., Figure 8 in Luhmann & Mann 2007 and Figure 7 in Ameri et al. 2023). However, similarly to these studies, Figure 14 uses the same energy for the intensities of the prompt component and at shock passage or in the ESP event. Consequently, these intensities cannot be used to estimate the particle acceleration efficiency of the shock because the shock may act on particles with a wide spectrum of energies. Comparing energy spectra upstream and at the time of the shock may be more appropriate (see examples in Reames 2012).

Figure 14. Peak particle intensity of the prompt component of the SEP events, obtained from the S6 energy channel of the SEPEM/RDS data set, vs. (a) the intensity measured at the time of shock passage for those events not showing any significant intensity increase (open symbols) and the peak intensity Ipk for those events showing intensity enhancements in the vicinity of shock passage (solid symbols), and (b) the ESP size for those events showing significant intensity increases (black solid symbols for class-10 events and red solid symbols for class-12 events). The intensity units are (cm2 s sr MeV)−1. The blue straight lines are linear least-squares fits to all data points. The blue legends provide the dependencies, the correlation coefficients rP and rS , and the p-value.
Download figure:
Standard image High-resolution image
6. Conclusions
The IP shocks associated with intense >40 MeV proton ESP intensity enhancements near Earth tend to be associated with solar events characterized by intense SXR flares (usually above X1 intensity), fast CMEs (plane-of-sky speed >1000 km s−1), and located at longitudes close to central meridian, although they can occur over a wide range of longitudes (see Figure 6). The largest ESP intensities are observed when intervening IP structures are present in the solar wind through which the shock is propagating (see Figures 8(e)–(f)). In particular, most of the events showing substantial increases at energies ≳95 MeV tend to occur in the presence of intervening IP structures (see Figures 8(g)–(h)). Therefore, circumstantial elements, rather than just local particle acceleration at the arrival of an isolated shock, appear to play a role in the formation of intense, high-energy ESP events. Consistent with other studies at lower energies, the local shock parameters do not seem to distinguish whether the shock is accompanied by an ESP intensity enhancement (Figure 9). Only the shock speed displays a moderate correlation with the peak ESP intensity or the ESP size, although the shock speed does not determine unequivocally the intensity measured during the ESP event.
The present study is based on near-Earth observations. Observations of shocks by Parker Solar Probe (Fox et al. 2016) and Solar Orbiter (Müller et al. 2020) in the inner heliosphere and in particular closer to the Sun than previous missions, where particle acceleration to high energies is thought to be more efficient, will provide multiple opportunities to study ESP events at different heliocentric distances, which may help to disentangle the multiple conditions and processes at play in the generation of ESP events at high energies.
Acknowledgments
We acknowledge use of the Harvard–Smithsonian Center for Astrophysics (CfA) Interplanetary Shock Database and the SOHO/LASCO CME catalog generated and maintained at the CDAW Data Center by NASA and The Catholic University of America in cooperation with the Naval Research Laboratory. SOHO is a mission of international cooperation between ESA and NASA. Data used in this paper can be downloaded from www.srl.caltech.edu/ACE/ASC/, cdaweb.gsfc.nasa.gov, and sepem.eu. We acknowledge all the science instrument teams and the SEPEM project for making their data used in this paper available. This work also benefited from discussions at the International Space Science Institute (ISSI, Bern, Switzerland) within the framework of the international team "High EneRgy sOlar partICle events analysis (HEROIC)" led by Dr. A. Papaioannou. D.L. and I.G.R. acknowledge support from NASA Living With a Star (LWS) programs NNH17ZDA001N-LWS and NNH19ZDA001N-LWS, the Goddard Space Flight Center Internal Scientist Funding Model (competitive work package) program, and the Heliophysics Innovation Fund (HIF) program. I.G.R. also acknowledges support from the ACE mission and the NASA Heliophysics Supporting Research (HSR) program NNH19ZDA001N-HSR. A.A. acknowledges the support by the Spanish Ministerio de Ciencia e Innovación (MICINN) under grant No. PID2019-105510GB-C31 and through the "Center of Excellence María de Maeztu 2020–2023" award to the ICCUB (CEX2019-000918-M), and the support through the ESA Contract No. 4000127282/19/NL/IB/gg "European Contribution to International Radiation Environment near Earth Modeling System (ecIRENE)". N.W. acknowledges the support from NASA program NNH19ZDA001N-LWS and from the Research Foundation—Flanders (FWO-Vlaanderen, fellowship No. 1184319N).
Footnotes
- 4
Available at sepem.eu.
- 5
Available at www.ngdc.noaa.gov/stp/solar/sgd.html.
- 6
Available at cdaw.gsfc.nasa.gov/CME_list/.
- 7
- 8
- 9
- 10
- 11
- 12
- 13