


Abstract
We use the Sloan Digital Sky Survey (SDSS) Quasar Data Release 12 (DR12Q), containing nearly 300,000 active galactic nuclei (AGNs), to calculate the monochromatic luminosities at 5100, 3000, and 1350 Å, derived from the broadband extinction-corrected SDSS magnitudes. After matching these sources to their counterparts from the SDSS Quasar Data Release 7 (DR7Q), we find very high correlations between our luminosities and DR7Q spectra-based luminosities with minute mean offsets (∼0.01 dex) and dispersions of differences of 0.11, 0.10, and 0.12 dex, respectively, across a luminosity range of 2.5 dex. We then estimate the black hole (BH) masses of the AGNs using the broad line region radius–disk luminosity relations and the FWHM of the Mg ii and C iv emission lines, to provide a catalog of 283,033 virial BH mass estimates (132,451 for Mg ii, 213,071 for C iv, and 62,489 for both) along with the estimates of the bolometric luminosity and Eddington ratio for 0.1 < z < 5.5 and for roughly a quarter of the sky covered by SDSS. The BH mass estimates from Mg ii turned out to be closely matched to the ones from DR7Q with a dispersion of differences of 0.34 dex across a BH mass range of ∼2 dex. We uncovered a bias in the derived C iv FWHMs from DR12Q as compared to DR7Q, which we correct empirically. The C iv BH mass estimates should be used with caution because the C iv line is known to cause problems in the estimation of BH mass from single-epoch spectra. Finally, after the FWHM correction, the AGN BH mass estimates from C iv closely match the DR7Q ones (with a dispersion of 0.28 dex), and more importantly the Mg ii and C iv BH masses agree internally with a mean offset of 0.07 dex and a dispersion of 0.39 dex.
Export citation and abstract BibTeX RIS
1. Introduction
It is now widely accepted that every active galactic nucleus (AGN) hosts an accreting supermassive black hole (BH) at its center. The matter infalling onto BH forms an extremely luminous accretion disk (e.g., Salpeter 1964; Shakura & Sunyaev 1973). Both the monochromatic and bolometric luminosity L of the disk are tightly correlated with the radius R of the broad-line region (BLR), R ∝ L1/2, as shown from the reverberation mapping studies of nearby AGNs (e.g., Kaspi et al. 2000, 2007; McLure & Jarvis 2002; Bentz et al. 2009, 2013; Fausnaugh et al. 2016). This inferred radius R (or equivalently luminosity L) can then be combined with the velocity v of the BLR gas–dust clouds, which is obtained from the width of the broadened emission lines in the AGN spectra, to estimate the BH mass via the virial theorem MBH ∝ Rv2 (e.g., Vestergaard & Peterson 2006; see Shen 2013 for a review, but also Trakhtenbrot & Netzer 2012 for an insightful comparison of different quantities used for single-epoch BH mass measurements). The luminosity of the accretion disk continuum is typically measured from the calibrated AGN spectra at preselected wavelengths (5100, 3000, and 1350 Å); however, if such a calibration is lacking it can be successfully estimated from the broadband magnitudes (Kozłowski 2015).
Pâris et al. (2017) provide the largest uniform catalog to date of 297,301 AGNs with measured widths of C iv, C iii], and/or Mg ii lines (measured as both the FWHM and the blue/red half-width at half-maximum (HWHM)), but lack the monochromatic luminosities—necessary to estimate the BH masses—the bolometric luminosities, and the Eddington ratios. In this paper, we use the prescription of Kozłowski (2015) to convert the broadband magnitudes to the monochromatic luminosities. We then derive the "virial BH masses," the bolometric luminosities, and the Eddington ratios by combining the monochromatic luminosities with the line widths via the virial theorem. We provide these quantities in a catalog form that is matched line by line to the original catalog from Pâris et al. (2017).
In Section 2, we present the methodology of estimation of both the luminosity and BH mass. We discuss plausible issues in Section 3, and the paper is summarized in Section 4.
2. Methodology
We have downloaded the DR12Q data set presented in Pâris et al. (2017). It contains 297,301 objects, for which we extracted redshifts z, absolute magnitudes Mi, FWHMs of C iv, C iii], and Mg ii lines (uncertainties are not provided), and also HWHMs of the blue and red sides for these lines, the Sloan Digital Sky Survey (SDSS) ugriz magnitudes, and their corresponding Galactic extinctions (obtained originally from Schlafly & Finkbeiner 2011).
2.1. The Luminosity
We converted the broadband ugriz magnitudes (Fukugita et al. 1996), corrected for the Galactic extinction, to the luminosities using a standard ΛCDM cosmological model with  . Each of the five luminosities was then converted to any of the three monochromatic luminosities at 5100, 3000, and 1350 Å using the prescription of Kozłowski (2015). The monochromatic luminosity is calculated as a weighted mean of up to five luminosity values from the five SDSS filters, where as weights we used the sum of squares of the luminosity uncertainty and the conversion dispersion. We provide 39,005 estimates of the monochromatic luminosity at 5100 Å, 139,686 at 3000 Å, and 229,248 at 1350 Å.
We have also downloaded the DR7Q data set, presented in Shen et al. (2011), that contains the monochromatic luminosities and BH masses obtained directly from spectra. We matched our objects (R.A. and decl.) for which we derived the monochromatic luminosities to the DR7Q data set. In Figure 1, we provide comparisons between our data and the DR7Q data set for the three luminosities. In all three cases there is a tight correlation (the Pearson coefficients are 0.96, 0.96, and 0.94) between the values obtained from the spectra and the broadband magnitudes with minute mean offsets (∼0.01 dex) and dispersions of 0.11, 0.10, and 0.12 dex, for 5100 Å, 3000 Å, and 1350 Å, respectively. Because our typical AGN is bright ( ) and distant (z ≈ 2), the AGN host contamination is absent or only weakly present in this data set, and only for very low redshifts (z < 0.3, 0.2% of our sample) may the galaxy light become comparable to that of an AGN (Assef et al. 2010; Zehavi et al. 2011).
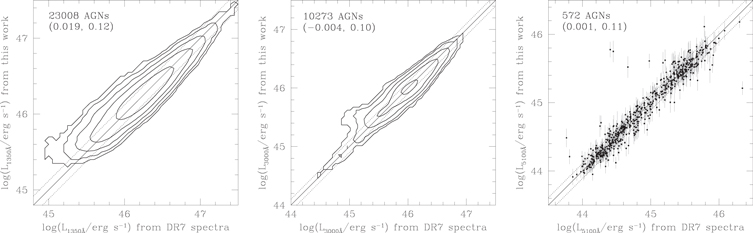
Figure 1. Comparison between the luminosities at 1350 Å (left panel), 3000 Å (middle), and 5100 Å (right) taken from the SDSS DR7Q (x-axis) and calculated from the DR12Q broadband magnitudes (y-axis). Contours show the density of objects per 0.05 × 0.05 dex bin. In brackets, we provide the mean and dispersion of differences (in that order). The solid line marks the one-to-one dependence, while the dotted lines show 1σ dispersion.
Download figure:
Standard image High-resolution imageA fraction of the dispersion in the luminosity differences is caused by the variability of the AGN itself, where we know that on timescales of months to years the flux can change by 0.2–0.3 magnitude (∼0.1 dex in luminosity) in optical bands (e.g., Ulrich et al. 1997; MacLeod et al. 2010; Schmidt et al. 2010; Kozłowski 2016).
The bolometric luminosity Lbol is derived from the monochromatic luminosities at 5100, 3000, and 1350 Å using the following bolometric corrections from Richards et al. (2006): 9.26, 5.15, and 3.81 respectively. By analogy to the calculation of the monochromatic luminosity, as the final bolometric luminosity we provide the weighted mean of the bolometric luminosities from the monochromatic luminosities, where the weights are the squared luminosity uncertainties. The Eddington luminosity LEdd can be simply obtained from LEdd = 1.26 × 1038(MBH/M⊙) erg s−1, where we first use the BH mass estimate based on the Mg ii line, and if not present then that based on C iv (derived and discussed below). The Eddington ratio is  .
.
2.2. The BH Mass
The virial BH mass is typically obtained from a single spectrum using
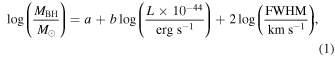
where the BH mass calibrations (a, b) are estimated empirically (e.g., McLure & Dunlop 2002; Vestergaard & Peterson 2006; Shen et al. 2011), typically against nearby reverberation-mapped AGNs (e.g., Blandford & McKee 1982; Peterson 1993; Peterson et al. 2004).
Masses based on the Mg ii line: The coefficients for Mg ii are (a, b) = (0.74, 0.62) from Shen et al. (2011). For our sample, they produce an offset of 0.056 dex in the derived BH masses as compared to the matched DR7Q sources. We therefore modify them to (a, b) = (0.796, 0.62). The same pair of values is found by the minimization of the BH mass differences in a least-squares sense on an (a, b) grid. In the left panel of Figure 2, we present the comparison between the BH masses derived from the SDSS spectra (DR7Q; x-axis) and the ones derived from this work (y-axis). The mean difference offset is by definition 0.0 dex, because the (a, b) parameters are found on a grid, while the dispersion of differences is 0.34 dex. The Pearson correlation coefficient between our DR12Q and DR7Q Mg ii-based BH mass estimates is 0.66.
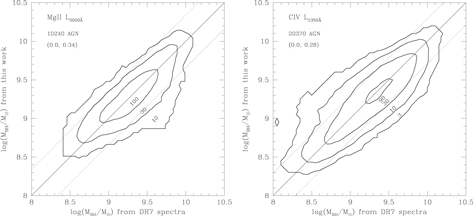
Figure 2. Comparison of the BH masses from DR7Q (x-axis) and those calculated from the broadband magnitudes (y-axis) for the Mg ii line (left panel) and the C iv line (right panel). Contours show the number of objects per 0.05 × 0.05 dex bin. In brackets, we provide the mean and dispersion of differences (in that order). The solid line marks the one-to-one dependence, while the dotted lines show 1σ dispersion.
Download figure:
Standard image High-resolution imageMasses based on the C iv line: For the C iv line, Shen et al. (2011) use (a, b) = (0.66, 0.53) from Vestergaard & Peterson (2006), but we found rather biased BH masses using DR12Q as compared to the DR7Q ones and to the ones based on the Mg ii line. We found that while the Mg ii FWHMs in DR7Q and DR12Q match one another, there is a problem with the FWHMs of C iv (Figure 3). We use the following empirically found conversion to match DR12Q C iv FWHMs to the DR7Q ones

Figure 3. Bias in the FWHM of the C iv line between the DR7Q and DR12Q. While the bulk of population should be located along the solid line, it is obvious that a bias exists between the two measurement methods. We correct the bias by fitting the linear trend to the bulk of the data marked by the dashed line and Equation (2). Contours show the density of objects per 0.05 × 0.05 dex bin.
Download figure:
Standard image High-resolution imageAfter exploring the reason why the two data releases differ in this context, which to some degree is beyond the scope of this paper, we find that the DR7Q FWHMs appear to be more reliable than the DR12Q ones. This is because Shen et al. (2011) carefully fit to spectra all the necessary ingredients (simultaneously, the continuum, the Fe template, and broad and narrow Gaussians for the lines) to measure the FWHMs that are in fact converted from the Gaussian dispersion. And the Gaussian dispersion is a more robust estimate of the BLR velocity than a straight FWHM measurement for the C iv line (Denney et al. 2013). Pâris et al. (2017), on the other hand, use principal component analysis to obtain the reported FWHMs. The C iv line is also known to be notoriously troubled by other effects such as a significant blueshift of up to thousands of km s−1 (e.g., Richards et al. 2002) and line asymmetry due to outflows (e.g., Gaskell 1982) that seem not to reverberate (Denney 2012), blurring the picture of the BH mass estimation.
From a minimization of differences between our BH masses and the ones from DR7Q, which we perform on an (a, b) grid, we find (a, b) = (0.64,0.53) to be the best choice for the C iv BH masses. In the right panel of Figure 2, we present the comparison between the C iv BH masses derived from the SDSS spectra (DR7Q; x-axis) and the ones derived from this work after correcting the FWHMs from DR12Q (y-axis). The mean offset by definition is 0.0 dex, while the dispersion is 0.28 dex. Because the C iv line is known for being problematic and/or biased in terms of the FWHM measurement (e.g., Shen et al. 2008), we caution the user of this BH mass estimate. The Pearson correlation coefficient between our DR12Q and DR7Q C iv-based BH mass estimates is 0.76.
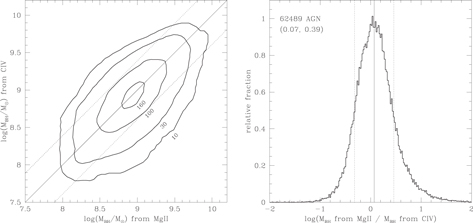
We also perform an internal comparison between the Mg ii and C iv BH masses based on DR12Q. In the left panel of Figure 4, we present the density contours, and in the right panel a histogram of differences of BH mass logarithms. We find a small offset between the two samples of 0.07 dex (Mg ii BH masses are smaller), a dispersion of 0.39 dex after pruning 3σ outliers, and a Pearson correlation coefficient between our DR12Q Mg ii and C iv BH mass estimates of 0.56.
Figure 4. Left panel: internal comparison of the Mg ii (x-axis) and C iv (y-axis; shifted here for visualization purposes by the mean offset of −0.07 dex) BH masses derived from the broadband SDSS magnitudes (converted to the monochromatic luminosity). Contours show the number of objects per 0.05 × 0.05 dex bin. The solid line marks the one-to-one dependence, while the dotted lines show 1σ dispersion. Right panel: the normalized histogram of ratios of the Mg ii to C iv BH masses. In brackets we provide the mean and dispersion of differences (in that order).
Download figure:
Standard image High-resolution image
An offset between Mg ii-based and C iv-based BH masses is also present and commented on in Shen et al. (2008). These authors find that the C iv blueshift is positively correlated with the BH mass, meaning the larger (smaller) the C iv blueshift the more overestimated (underestimated) are the C iv-based BH masses as compared to the Mg ii-based ones. From Figure 4 of Shen et al. (2008) we also identify a weak increasing trend of C iv FWHM with redshift. Because our sample consists of sources with statistically higher redshift than the sample of Shen et al. (2008), this explains why we see the positive 0.07 dex offset in C iv-based BH masses as compared to the Mg ii-based ones.
The monochromatic and bolometric luminosities, the Eddington ratio, and the BH mass estimates are provided in Table 1.
Table 1. Estimates of the Monochromatic and Bolometric Luminosities, Eddington Ratios, and BH Masses for DR12Q AGNs
| R.A. | Decl. | z | Mi | L5100 |

|
L3000 |

|
L1350 |

|
MBH from | Lbol |

|
ηEdd | |
|---|---|---|---|---|---|---|---|---|---|---|---|---|---|---|
| (deg) | (deg) | (mag) | Mg ii | C iv | ||||||||||
| 0.00806 | −0.24097 | 2.16 | −25.79 | −99.99 | −9.99 | 45.63 | 0.11 | 45.83 | 0.10 | 9.25 | 9.39 | 46.39 | 0.07 | −0.96 |
| 0.00855 | 34.67868 | 1.57 | −23.20 | −99.99 | −9.99 | 44.66 | 0.09 | 44.83 | 0.11 | 8.09 | 8.39 | 45.39 | 0.07 | −0.80 |
| 0.00898 | 15.25463 | 1.71 | −24.56 | −99.99 | −9.99 | 45.04 | 0.08 | 45.12 | 0.13 | 8.72 | 8.27 | 45.74 | 0.07 | −1.07 |
| 0.01471 | 30.57038 | 2.16 | −24.44 | −99.99 | −9.99 | 45.04 | 0.12 | 45.22 | 0.10 | 8.32 | 8.51 | 45.78 | 0.08 | −0.63 |
| 0.01644 | 26.61267 | 2.18 | −26.42 | −99.99 | −9.99 | 45.86 | 0.12 | 46.07 | 0.09 | 9.19 | 9.10 | 46.62 | 0.07 | −0.66 |
Note. One digit has been truncated from each column in this illustrative table for display purposes; L5100,  , L3000,
  , L1350,
  , Lbol and
  are the base 10 logarithms of the luminosities and their uncertainties (at 5100, 3000, 1350 Å, and bolometric) in units of erg s−1; MBH is the base 10 logarithm of the BH mass in units of M⊙ calculated via the Mg ii or C iv line; ηEdd is the base 10 logarithm of the Eddington ratio. The error code, reflecting no measurement, is −99.99 (−9.99 for the uncertainty). (The data file containing the presented results can also be obtained from: ftp://ftp.astrouw.edu.pl/pub/simkoz/SDSS-DR12Q-BH.tar.gz).
Only a portion of this table is shown here to demonstrate its form and content. A machine-readable version of the full table is available.
Download table as: DataTypeset image
3. Discussion
While McLure & Jarvis (2002) and Assef et al. (2011) find that C iv FWHM line measurements are generally consistent with those for hydrogen lines, Denney et al. (2013, 2016a, 2016b) find that the decreasing signal-to-noise ratio can significantly bias the measured C iv FWHMs and therefore BH masses. In particular, Denney et al. (2013) show that for the spectra with high signal-to-noise ratio the line dispersion, rather than FWHM, returns reliable BH estimates, and Denney et al. (2016a) identify several problems in the C iv FWHM measurements due to (1) intrinsic diversity of AGNs and (2) systematic offsets between the C iv-based and He ii- or [O ii]-based redshifts, leading to the reported biased redshifts from the SDSS/BOSS pipeline (used in DR12Q). The latter is studied by Shen et al. (2016), who point out problems with the systemic velocity shifts in AGNs and their impact on the measured redshifts. While this may appear to be a rather unimportant issue here, incorrectly measured redshifts can lead to biases in the derived luminosities, which in turn lead to biases in the BH masses.
Table 1 presents our BH mass estimates. It is important to understand that the initial DR7Q BH mass estimates are based on the relation between luminosity and BLR radius, which has an intrinsic dispersion of 0.4 dex (e.g., see Shen 2013 for a review). Because Pâris et al. (2017) do not provide uncertainties for their FWHMs, we are dealing with a systematic bias of 0.4 dex to start with, and we have only estimates on the uncertainties of the luminosity, we have decided to report estimates of the BH masses only (without uncertainties). These masses should serve as a means for statistical studies of large samples of AGNs, keeping in mind a plausible systematic offset of ∼0.4 dex, rather than for studies of individual objects.
Graham et al. (2011) pointed out another problem, namely that the BH sphere-of-influence bias in local galaxy samples with directly measured BH masses had resulted in an overestimate of the virial f-factor (ciphered in the parameter a in Equation (1)) used for measuring AGN BH masses, and they reduced f by half from ∼5.5 to ∼2.8. Shankar et al. (2016), on the other hand, suggested that the virial f-factor should be reduced further, by another factor of ∼3 (to f ≈ 1). Reducing the virial f-factor by a factor of, e.g., 5 will bring down most published AGN BH masses by a factor of 5. Therefore, one needs to remember that these masses may be systematically lower by about 0.74 dex if the current f-factors are overestimated by a factor of 5.5.
Trakhtenbrot & Netzer (2012) critically and insightfully compared different quantities used for single-epoch BH mass measurements, focusing on the ways in which Mg ii and C iv can (or cannot) be calibrated to replace Hβ-based measurements. Similarly to already mentioned studies (and to our findings here), these authors reported that the C iv line gives unreliable mass estimates, which is related to the C iv line widths not obeying the expectations from reverberation mapping and the virial assumptions.
Although we only provide statistical estimates of the AGN physical parameters, it is tempting to comment briefly on the most luminous and most massive BHs in this sample. The most luminous AGN appears to be SDSS J155152.46+191104.0 at z = 2.850 with a bolometric luminosity of 1.8 × 1048 erg s−1 or 479 trillion solar luminosities and an estimated BH mass of 24 billion solar masses. The second most luminous AGN is SDSS J142656.18+602550.8 at z = 3.186 with nearly identical parameters. The most massive appears to be SDSS J140821.67+025733.2 at z = 2.055, but it is about 10 times less luminous than the preceding two objects. It has an estimated BH mass of 196 billion solar masses. The highest mass measured consistently (below a difference of 0.5 dex) from two separate lines is 13 billion solar masses for SDSS J133335.78+164903.9 at z = 2.089.
4. Summary
In this paper, we used the 12th quasar data release from SDSS to obtain basic physical parameters for ∼280,000 AGNs, which include BH masses, monochromatic luminosity at 5100, 3000, 1350 Å, and bolometric, and the Eddington ratio. First, we estimated the monochromatic luminosities from the broadband extinction-corrected ugriz SDSS magnitudes. They were then matched to and compared with the ones derived from spectra and published in DR7Q. We find excellent correlations with the mean difference offsets of ∼0.01 dex and dispersion of ∼0.1 dex. Then, we estimate the BH masses by combining these luminosities with the broad emission line widths. For the Mg ii line we find an excellent match to the DR7Q BH masses, while for the C iv line we uncover a bias between the two data releases, DR7Q and DR12Q, due to the method used to estimate FWHMs. Nevertheless, we correct this bias empirically, after which our C iv BH masses are matched well to the ones from DR7Q. We also cross-check the Mg ii and C iv BH masses internally, and we find a mean offset of differences of 0.07 dex with a dispersion of 0.39 dex. All the obtained physical parameters of AGNs are provided in a tabular form (Table 1) matched line by line to the DR12Q catalog from Pâris et al. (2017). There are 283,033 virial BH mass estimates, of which 132,451 are for Mg ii, 213,071 are for C iv, and 62,489 are for both lines.
While there are many (some unknown) uncertainties in the quest to obtain the BH masses (the intrinsic dispersion of 0.4 dex in the BLR radius–luminosity relation, unknown uncertainties of FWHMs from DR12Q), the estimates provided in this work are better suited for statistical analyses of AGNs; in particular, they could be used in tracing correlations of the AGN variability (from large ground-based and/or space-based sky surveys) with the physical AGN parameters. Because the C iv line is typically problematic to correctly measure from spectra (both its width and centroid), is often asymmetric, and a fraction of light is unrelated to the bulk velocity motion of the BLR (and it does not reverberate), we caution the reader that the C iv line-based BH masses are simply and only best estimates from the available DR12Q catalog.
I am grateful to Prof. Alister Graham and Drs. Jan Skowron, Łukasz Wyrzykowski, and Paweł Pietrukowicz for discussions of this topic, and to the anonymous referee for comments that helped to improve this manuscript. S.K. acknowledges the financial support of the Polish National Science Center through the OPUS grant number 2014/15/B/ST9/00093 and MAESTRO grant number 2014/14/A/ST9/00121.