


Abstract
We report our first discoveries of high-redshift supernovae from the Subaru HIgh-Z sUpernova CAmpaign, the transient survey using Subaru/Hyper Suprime-Cam (HSC). We report the discovery of three supernovae at the spectroscopically confirmed redshifts of 2.399 (HSC16adga), 1.965 (HSC17auzg), and 1.851 (HSC17dbpf), and two supernova candidates with the host galaxy photometric redshifts of 3.2 (HSC16apuo) and 4.2 (HSC17dsid), respectively. In this paper, we present their photometric properties, and the spectroscopic properties of the confirmed high-redshift supernovae are presented in the accompanying paper. The supernovae with the confirmed redshifts of z ≃ 2 have the rest-ultraviolet peak magnitudes close to −21 mag, and they are likely superluminous supernovae. The discovery of three supernovae at z ≃ 2 roughly corresponds to the approximate event rate of ∼900 ± 520 Gpc−3 yr−1 with Poisson error, which is consistent with the total superluminous supernova rate estimated by extrapolating the local rate based on the cosmic star formation history. Adding unconfirmed superluminous supernova candidates would increase the event rate. Our superluminous supernova candidates at the redshifts of around 3 and 4 indicate the approximate superluminous supernova rates of ∼400 ± 400 Gpc−3 yr−1 (z ∼ 3) and ∼500 ± 500 Gpc−3 yr−1 (z ∼ 4) with Poisson errors. Our initial results demonstrate the outstanding capability of HSC to discover high-redshift supernovae.
Export citation and abstract BibTeX RIS
1. Introduction
Supernovae (SNe) are luminous explosions of stars. Because of their huge luminosities, SNe can be observed even if they are far away, and they have indeed been used to explore the distant universe. For example, SNe Ia are known to be standardizable candles (e.g., Phillips 2005). The use of SNe Ia to measure distances in the universe led to the discovery of the accelerating expansion of the universe (Riess et al. 1998; Perlmutter et al. 1999).
SNe Ia, which are explosions of white dwarfs, are usually brighter than core-collapse SNe that originate from massive stars (e.g., Richardson et al. 2014). Thus, SNe Ia have long been used to probe the distant universe (e.g., Suzuki et al. 2012). However, recent transient surveys revealed the existence of core-collapse SNe that are much brighter and bluer than SNe Ia. For example, SNe IIn gain their luminosity through the interaction between the SN ejecta and circumstellar media (e.g., Moriya et al. 2013b) and, therefore, can be brighter and bluer than normal core-collapse SNe (e.g., Fransson et al. 2014). Another example is so-called superluminous SNe (SLSNe), which can become brighter than ∼−21 mag and have blue spectra (e.g., Smith et al. 2010; Quimby et al. 2011). The mechanisms to make SLSNe very luminous are not yet fully understood, but their progenitors are believed to be massive stars (e.g., Gal-Yam 2012, 2018; Howell 2017; Moriya et al. 2018). At least some SLSNe are known to be Type IIn (e.g., Smith et al. 2010), and they are likely powered by the circumstellar interaction (e.g., Chevalier & Irwin 2011; Chatzopoulos et al. 2013; Moriya et al. 2013a). SLSNe that are not Type IIn are mostly Type I, having broad carbon and oxygen features (e.g., Quimby et al. 2011; Howell et al. 2013; Mazzali et al. 2016; Yan et al. 2017). These core-collapse SNe can be detected well beyond the reach of SNe Ia (e.g., Cooke et al. 2009, 2012; Howell et al. 2013; Pan et al. 2017; Smith et al. 2018, but see also Rubin et al. 2018) and enable us to study properties of massive stars in the early universe. Some of them may even be used as standard candles (Blinnikov et al. 2012; Quimby et al. 2013; Inserra & Smartt 2014; Scovacricchi et al. 2016; Inserra et al. 2018).
To find high-redshift SNe, it is necessary to conduct a deep and wide transient survey. Hyper Suprime-Cam (HSC, Furusawa et al. 2017; Kawanomoto et al. 2018; Komiyama et al. 2018; Miyazaki et al. 2018) on the 8.2 m Subaru telescope has a field of view of 1.8 deg2, and it is one of the best instruments in the world to conduct such a wide and deep transient survey (e.g., Tanaka et al. 2016). To make use of its unique capability, a deep and wide transient survey was conducted with HSC from 2016 November to 2017 May under the HSC Subaru Strategic Program (SSP; Aihara et al. 2018; N. Yasuda et al. 2019, in preparation). The HSC-SSP transient survey aims for detecting SNe Ia at 1.0 ≲ z ≲ 1.5, with which a better constraint on the cosmological parameters can be obtained (N. Suzuki et al. 2019, in preparation). However, the same data can also be used to find luminous core-collapse SNe at z ≳ 1.5 (e.g., Cooke 2008; Tanaka et al. 2012, 2013), and we conducted the Subaru HIgh-Z sUpernova CAmpaign (SHIZUCA). In this paper, we report our first discoveries of such high-redshift SNe beyond the redshift of 1.5 during the first half year of SHIZUCA. A similar half-year survey is planned in 2019–2020.
The rest of this paper is organized as follows. First, we provide a brief summary of the half-year transient survey in Section 2. We present high-redshift SNe at z ≃ 2, whose redshifts are confirmed by the spectroscopic follow-up observations with the Keck/Low-Resolution Imaging Spectrometer (LRIS) reported in the accompanying paper (Curtin et al. 2019, hereafter C19), in Section 3. Then, we report one supernova (SN) candidate at z ∼ 3 and another SN candidate at z ∼ 4 in Section 4. We are not able to obtain their spectra, but the photometric redshifts of their host galaxies suggest the high-redshift nature of the SNe. We discuss our results in Section 5 and conclude this paper in Section 6. The standard cosmology with H0 = 70 km s−1 Mpc−1, ΩΛ = 0.7, and ΩM = 0.3 is adopted when necessary. All observed photometry is presented in the AB magnitude system.
2. Transient Survey Overview
We briefly summarize the transient survey conducted with Subaru/HSC from 2016 November to 2017 May as a part of the HSC-SSP survey (Aihara et al. 2018). Details of the transient survey will be presented in N. Yasuda et al. (2019, in preparation).
The transient survey was performed in the HSC-SSP ultra-deep COSMOS field (Capak et al. 2007). The survey area is one field of view of HSC (1.8 deg2). The observations with each filter (Figure 1) were performed for a few epochs at around every new moon. The data are reduced with hscPipe (Bosch et al. 2018), a version of the Large Synoptic Survey Telescope (LSST) stack (Ivezic et al. 2008; Axelrod et al. 2010; Jurić et al. 2015). The astrometry and photometry are calibrated relative to the Pan-STARRS1 (PS1) 3π catalog (Schlafly et al. 2012; Tonry et al. 2012; Magnier et al. 2013). The final photometry is obtained via point-spread-function photometry in the template-subtracted images. The astrometric errors are estimated by taking the dispersions of the centroids of the transients in the subtracted images.

Figure 1. HSC filter transmissions, including the mirror reflectivity, transmissions of all the optics and filters, the atmosphere, and the response of the charge-coupled devices (CCDs) at the airmass of 1.2. The wavelength ranges covered by the filters are 4000–5450 Å (g), 5450–7000 Å (r), 7000–8550 Å (i), 8550–9300 Å (z), and 9300–10700 Å (y).
Download figure:
Standard image High-resolution imageThe main science objective of the HSC-SSP transient survey is SN Ia cosmology at 1 ≲ z ≲ 1.5, but we conduct SHIZUCA with the same data to search for SNe at z ≳ 1.5. The high-redshift SNe and SN candidates reported in this paper are selected based primarily on the COSMOS2015 photometric redshifts (Laigle et al. 2016), as well as the photometric redshifts estimated by the MIZUKI code (Tanaka 2015) that is introduced below. Some high-redshift SN candidates have follow-up spectroscopy using LRIS on the Keck I telescope at W.M. Keck Observatory (Oke et al. 1995). The Keck/LRIS spectra are reported in the accompanying paper (C19). Table 1 presents the list of the transients presented in this paper with their host galaxy properties.
Table 1. List of SNe and SN Candidates
| Host Galaxy Magnitudes in the HSC Filters | ||||||||
|---|---|---|---|---|---|---|---|---|
| HSC Name | IAU Name | Redshift | g | r | i | z | y | Sections |
| HSC16adga | SN 2016jhm | 2.399 ± 0.004a | 24.55 ± 0.03 | 24.42 ± 0.04 | 24.48 ± 0.06 | 24.29 ± 0.07 | 24.20 ± 0.13 | 3.1 |
| HSC17auzg | SN 2016jhn | 1.965 ± 0.004a | 23.88 ± 0.02 | 23.77 ± 0.02 | 23.54 ± 0.02 | 23.41 ± 0.03 | 23.58 ± 0.06 | 3.2 |
| HSC17dbpf | SN 2017fei | 1.851 ± 0.004a | 24.11 ± 0.02 | 23.91 ± 0.02 | 23.67 ± 0.03 | 23.63 ± 0.04 | 23.60 ± 0.08 | 3.3 |
| HSC16apuo | AT 2016jho |
 b
b
|
27.00 ± 0.75 | 25.31 ± 0.19 | 25.50 ± 0.35 | 24.92 ± 0.29 | 26.10 ± 0.29 | 4.1 |
| HSC17dsid | AT 2017fej |
 b
b
|
27.74 ± 0.34 | 25.07 ± 0.04 | 24.83 ± 0.04 | 24.68 ± 0.05 | 25.23 ± 0.18 | 4.2 |
Notes.
aSpectroscopically confirmed (C19). bCOSMOS2015 photometric redshift (Laigle et al. 2016).Download table as: ASCIITypeset image
3. High-redshift Supernovae at Around the Redshift of 2
In this section, we focus on three SNe at z ≃ 2, i.e., HSC16adga (z = 2.399), HSC17auzg (z = 1.965), and HSC17dbpf (z = 1.851). SN host galaxy physical properties, such as stellar mass and star formation rate (SFR), presented in this paper are estimated with the MIZUKI code (Tanaka 2015). MIZUKI estimates the photometric redshifts of galaxies by using the Bayesian priors on their physical properties. It can estimate the photometric redshifts and the galaxy properties (stellar mass and SFR) simultaneously in a self-consistent way. MIZUKI is shown to provide good estimates for the host galaxy properties with smaller dispersions than the previous methods, for example. We refer to Tanaka (2015) for more detailed descriptions of the code and its performance. The photometric redshifts and the host galaxy properties are obtained by using all the available photometry in COSMOS2015 and HSC. The probability distribution functions (PDFs) of the estimated photometric redshifts for the host galaxies of the three SNe at z ≃ 2 are presented in Figure 2. The estimated galaxy properties from MIZUKI in this section are obtained by assuming the spectroscopically confirmed redshifts. The image cutouts of the SNe are shown in Figure 3. All the SN photometric data are summarized in the Appendix.
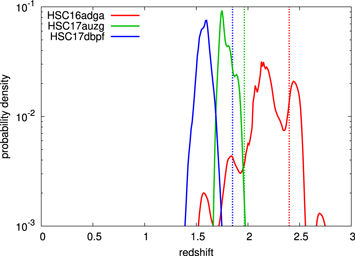
Figure 2. PDF of the photometric redshifts of the host galaxies of the spectroscopically confirmed high-redshift SNe estimated by MIZUKI using the HSC and COSMOS2015 photometry of the host galaxies. The confirmed redshifts are shown with the vertical dotted lines. The COSMOS2015 photo-z are  (HSC16adga),
  (HSC17auzg), and
  (HSC17dbpf).
Download figure:
Standard image High-resolution image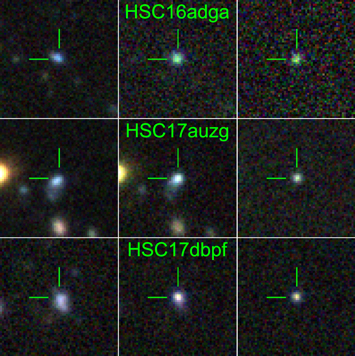
Figure 3. The images (10'' × 10'') of spectroscopically confirmed high-redshift SNe and their host galaxies. The left panels show the reference images, the middle panels show the images after the SN discovery at around the maximum brightness, and the right panels show their subtractions. Three filters (i, r, and z) are used to make the color composite. The SN locations are at the center of the images. North is up and east is left.
Download figure:
Standard image High-resolution image3.1. HSC16adga (SN 2016jhm)
HSC16adga (SN 2016jhm) was discovered shortly after the beginning of the survey at (R.A., decl.) = (10:02:20.12, +02:48:43.3). It appeared in a galaxy with the COSMOS photo-z of  and the MIZUKI photo-z peaking at 2.19 (Figure 2). The MIZUKI photo-z PDF has the second major peak at z ≃ 2.45. The SN spectroscopic redshift is z = 2.399 ± 0.004 (C19), which is consistent with the broad photometric redshift probability distribution, especially with the second peak in the PDF in Figure 2. The SN location is 0
 36 ± 010 (2.9 kpc at z = 2.399) away from the host galaxy center. We estimate the host galaxy properties by fixing the redshift (z = 2.399) using MIZUKI. It is estimated to be a star-forming galaxy with the stellar mass of
  and the SFR of
  .
.
Figure 4(a) presents the observed light curves (LCs) of HSC16adga. The original data are summarized in Table 2. Figure 5 is the rest-frame spectral energy distribution (SED) obtained with the broadband photometry at the selected epochs shown in Figure 4(a). We do not take any host galaxy extinction into account in this paper. Because at early epochs the photometric temperatures are higher than ≃20,000 K, the peak of the SEDs is not constrained by our optical photometry. Afterward, the photospheric temperatures gradually cool to ≃15,000 K (20 days) and ≃10,000 K (30 days). The temperature evolution is consistent with that of luminous SNe IIn (e.g., Fassia et al. 2000).
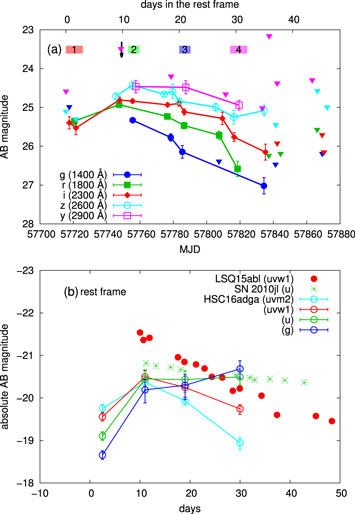
Figure 4. LCs of HSC16adga. Detections with the significance of more than 5σ are presented with the 1σ error, and triangles show the 5σ detection limits. Detections are connected with lines. (a) Observed LCs (Table 2). The top x axis shows the time after the discovery at z = 2.399. The central wavelength at z = 2.399 for each filter is shown. The regions with numbers on top indicate the epochs when the SEDs are shown in Figure 5, with which the rest-frame LCs in the panel (b) are obtained. The arrow shows when the spectrum is taken by Keck/LRIS. (b) The rest-frame ultraviolet and optical LCs of HSC16adga. The K correction is based on the blackbody SED fits presented in Figure 5. The errors include the blackbody fitting and photometric uncertainties. The LCs of Type IIn SLSN LSQ15abl (Brown et al. 2014) and the luminous Type IIn SN 2010jl are shown for comparison (Fransson et al. 2014). The time of the comparison LCs is shifted to match the LC peak of HSC16adga.
Download figure:
Standard image High-resolution image
Figure 5. Rest-frame SEDs of HSC16adga estimated by the broadband photometry in the selected epochs shown in Figure 4(a). Open triangles indicate upper limits. The SEDs from blackbody temperatures (TBB) and radii (RBB) that provide the best fit to the SEDs are shown (red solid line for the epoch 1: TBB = 36,000 K and RBB = 3.3 × 1014 cm (no degree-of-freedom (dof)), green dotted line: TBB = 19,000 K and RBB = 1.2 × 1015 cm [χ2/dof = 1.15/3], blue dotted-dashed line: TBB = 15,000 K and RBB = 1. 6 × 1015 cm [χ2/dof =0.72/3], and pink dashed line: TBB = 10,000 K and RBB = 3.4 × 1015 cm [χ2/dof = 0.02/2]).
Download figure:
Standard image High-resolution imageUsing the results of the blackbody SED fitted to the broadband photometry, we estimate the rest-frame ultraviolet (the uvm2 and uvw1 filters from Swift) and optical (the u band filter from the Sloan Digital Sky Survey and the g band from HSC) LCs as shown in Figure 4(b). The u band magnitude of HSC16adga is similar to that of SN 2010jl, although the LC of HSC16adga is probably still rising. The g band magnitude is getting more luminous, and it is about to reach −21 mag. Although HSC16adga does not reach exactly −21 mag in optical, which was used to define SLSNe under one criterion (Gal-Yam 2012), it is currently known that many SLSNe, which are spectroscopically classified nowadays, do not reach −21 mag in optical (e.g., De Cia et al. 2018; Quimby et al. 2018). These facts, as well as the proximity to −21 mag, lead us to claim that HSC16adga is likely a SLSN.
3.2. HSC17auzg (SN 2016jhn)
HSC17auzg (SN 2016jhn) was first detected on 2016 December 23 at (R.A., decl.) = (09:59:00.42, +02:14:20.8) in the z band (Figure 3). It appeared in a galaxy with the COSMOS photo-z of  and the MIZUKI photo-z centering at 1.78 (Figure 2). The spectroscopic follow-up observations confirmed the redshift of 1.965 ± 0.004 (C19). The spectroscopic redshift is at the upper limit allowed by the photometric redshift PDF. The SN is at 078 ± 005 (6.5 kpc at z = 1.965) away from the host galaxy center. The host galaxy is estimated to have the stellar mass of
  and the SFR of
  by MIZUKI using the spectroscopically confirmed redshift.
The LCs of HSC17auzg are shown in Figure 6 (see Table 3 for the data). After the first detection, its brightness continued to increase for about 3 months in the z band, while the rise times in the bluer bands are shorter (Figure 6(a)). The SED evolution obtained by the broadband photometry is presented in Figure 7. The blackbody temperatures evolve from above ≃21,000 K to ≃11,000 K in about 40 days. The corresponding blackbody radii are ≃7 × 1014 cm to ≃2 × 1015 cm.

Figure 6. LCs of HSC17auzg. Detections with the significance of more than 5σ are presented with the 1σ error, and triangles show the 5σ detection limits. Detections are connected with lines. (a) Observed LCs (Table 3). The top x axis shows the time after the discovery at z = 1.965. The central wavelength at z = 1.965 for each filter is shown. The regions with numbers on top indicate the epochs when the SEDs are shown in Figure 7, with which the rest-frame LCs in the panel (b) are obtained. The arrow shows when the spectrum is taken by Keck/LRIS. (b) The rest-frame ultraviolet and optical LCs of HSC17auzg. The K correction is based on the blackbody SED fits presented in Figure 7. The errors include the blackbody fitting and photometric uncertainties. The LCs of Type IIn SLSN 2006gy (Smith et al. 2007) and Type IIn SLSN LSQ15abl (Brown et al. 2014) are shown for comparison. The time of the comparison LCs is shifted to match HSC17auzg. The magnitude of LSQ15abl is shifted by 1 mag so that the LC shape can be easily compared with that of HSC17auzg.
Download figure:
Standard image High-resolution image
Figure 7. Rest-frame SEDs of HSC17auzg estimated by the broadband photometry in the selected epochs shown in Figure 6(a). The SEDs from several blackbody temperatures and radii that provide the best fit to the SEDs are shown (red thick solid line: TBB = 21,000 K and RBB = 7.2 × 1014 cm [χ2/dof = 0.42/2], green dotted line: TBB = 17,000 K and RBB = 1.3 ×1015 cm [χ2/dof = 0.09/3], blue dotted-dashed line: TBB = 15,000 K and RBB = 1.7 × 1015 cm [χ2/dof = 0.26/3], pink dashed line: TBB = 13,000 K and RBB = 2.2 × 1015 cm [χ2/dof = 0.91/3], and cyan thin solid line: TBB = 11,000 K and RBB = 2.4 × 1015 cm [χ2/dof = 0.44/3]).
Download figure:
Standard image High-resolution imageFigure 6(b) shows the rest-frame ultraviolet and optical LCs of HSC17auzg, which are obtained by using the blackbody SEDs in Figure 7. The LCs are compared with those of SLSN IIn 2006gy (e.g., Smith et al. 2007) and Type IIn SLSN LSQ15abl (Brown et al. 2014). Although the rest-frame ultraviolet LCs of SN 2006gy do not exist, its optical LC rising rate is found to be consistent with HSC17auzg. The LC declining rate of HSC17auzg is consistent with that of LSQ15abl. The peak absolute magnitudes in the wavelength range presented in the figure do not reach −21 mag, which classically separates SLSNe from the other SNe by one definition (Gal-Yam 2012). However, it is currently known that SLSNe do not necessarily reach −21 mag (e.g., De Cia et al. 2018; Quimby et al. 2018). The LCs in the bluer bands are found to start declining earlier, and the LCs in the redder optical bands may actually keep rising in HSC17auzg (Figure 6(b)). Therefore, we believe that HSC17auzg is likely a SLSN.
3.3. HSC17dbpf (SN 2017fei)
The third spectroscopically confirmed high-redshift SN is HSC17dbpf (SN 2017fei) at (R.A., decl.) = (09:58:33.42, +01:59:29.7). It appeared in a galaxy with the COSMOS photo-z of  and the MIZUKI photo-z centering at 1.58 (Figure 2). The redshift of HSC17dbpf is confirmed to be 1.851 ± 0.004 with the spectroscopic follow-up observation (C19). Our spectroscopic redshift is higher than that estimated by the MIZUKI code, but it is in the 1σ error range of the photometric redshift estimated by COSMOS. The SN location is 058 ± 008 (4.9 kpc at z = 1.851) away from the host galaxy center. MIZUKI estimates the host galaxy stellar mass of
  and the SFR of
  .
.
The LCs of HSC17dbpf are reported in Figure 8. The original data are in Table 4. HSC17dbpf has the LC that evolves more rapidly than the other two high-redshift SNe we found. The rest-frame SED evolution of HSC17dbpf is presented in Figure 9. The blackbody temperature in the first epoch is not well constrained, but the steep rise in the SED indicates a high temperature above 30,000 K. The blackbody temperature evolves to ≃14,000 K on the second epoch and then goes down to ≃11,000 K on the third epoch. The early high temperature is consistent with that found in SN 2003ma (Rest et al. 2011) and Type I SLSNe (e.g., Nicholl & Smartt 2016). However, Type I SLSN spectra below around 3000 Å often deviate from a blackbody (e.g., Yan et al. 2017, 2018).
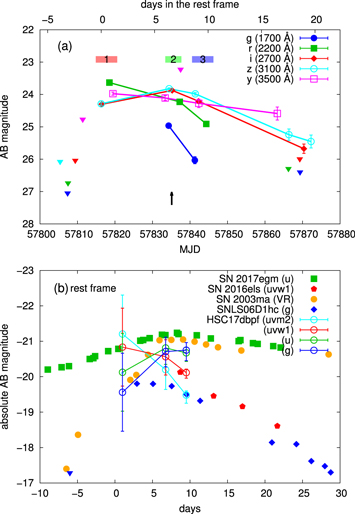
Figure 8. LCs of HSC17dbpf. Detections with the significance of more than 5σ are presented with the 1σ error, and triangles show the 5σ detection limit. Detections are connected with lines. (a) Observed LCs (Table 4). The top x axis shows the time after the discovery at z = 1.851. The central wavelength at z = 1.851 for each filter is shown. The regions with numbers on top indicate the epochs when the SEDs are shown in Figure 9, with which the rest-frame LCs in the panel (b) are obtained. The arrow shows when the spectrum is taken by Keck/LRIS. (b) The rest-frame ultraviolet and optical LCs of HSC17dbpf. The K correction is based on the blackbody SED fits presented in Figure 9. The errors include the blackbody fitting and photometric uncertainties. The LCs of Type I SLSNe 2017egm (Bose et al. 2018) and 2016els (Brown et al. 2014), the rapidly rising Type IIn SLSN 2003ma (Rest et al. 2011), and the luminous SN SNLS06D1hc (Arcavi et al. 2016) are shown for comparison. The time of the comparison LCs is shifted to match HSC17bdpf.
Download figure:
Standard image High-resolution image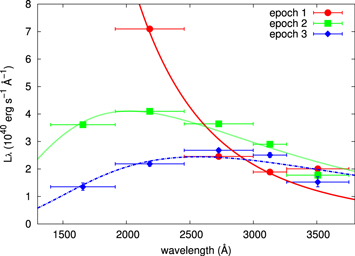
Figure 9. Rest-frame SEDs of HSC17dbpf estimated by the broadband photometry in the selected epochs shown in Figure 8(a). The SEDs from several blackbody temperatures and radii that provide the best fit to the SEDs are shown (red solid line: TBB = 98,000 K and RBB = 2.6 × 1014 cm [χ2/dof = 1.06/2], green dotted line: TBB = 14,000 K and RBB = 2.0 × 1015 cm [χ2/dof = 0.33/3], and blue dotted-dashed line: TBB = 11,000 K and RBB = 2.9 × 1015 cm [χ2/dof = 0.36/3]).
Download figure:
Standard image High-resolution imageFigure 8(b) presents the ultraviolet and optical LCs of HSC17dbpf in the rest frame. The rest-frame LCs are obtained by using the blackbody SEDs shown in Figure 9. The peak absolute magnitudes are consistent within the uncertainty to −21 mag. The ultraviolet magnitudes of HSC17dbpf are similar to those of some Type I SLSNe, and it is also likely that the LCs in the redder optical bands are still rising. Therefore, we claim that HSC17dbpf is a SLSN. The rapid LC rise is consistent with that of Type IIn SLSN 2003ma, although our rest-frame absolute magnitude estimates have large errors at the beginning. Such a rapid rise is not found in optical LCs of Type I SLSNe, but the rest-ultraviolet LCs of Type I SLSNe to compare are lacking. It is also interesting to note that the rapid evolution is consistent with the rapidly evolving transients from the Dark Energy Survey recently reported by Pursiainen et al. (2018), as well as those found by our previous HSC survey (Tanaka et al. 2016). The recent discovery of the Type I SLSN 2017egm at z = 0.031 (e.g., Nicholl et al. 2017a; Bose et al. 2018) provided an opportunity to obtain the rest-ultraviolet photometry of the Type I SLSN, but the rise is slower than that of HSC17dbpf (Bose et al. 2018). The rapid rise is also found in some SNe in the luminosity range between SNe and SLSNe (Arcavi et al. 2016), but HSC17dbpf is brighter (Figure 8(b)). The rapid decline of HSC17dbpf is consistent with that of Type I SLSN 2016els, although the rise of this SN was not observed (Brown et al. 2014).
3.4. Other z ∼ 2 SN Candidates
We have reported spectroscopically confirmed z ≃ 2 SNe so far. As presented at the beginning of this section, the z ∼ 2 candidates are selected based on the photometric redshift of the transients' host galaxies. We obtained about 10 SLSN candidates at 1.5 ≲ z ≲ 2.5 with this method, but we often did not have opportunities to conduct spectroscopic follow-up observations for them because of weather conditions and telescope availability. The priorities for spectroscopic follow-up observations on a given night, which is not target of opportunity but classically scheduled in the case of the Keck follow-up observations, are decided by the LC information, the apparent magnitudes of the candidates, and the uncertainties in the photometric redshift estimates. We first select SN candidates with at least a few epochs of LC information to see if they are consistent with being SNe. Then, we sort the candidates with host galaxy photometric redshifts. The higher-redshift SN candidates with small redshift uncertainties had higher priority for the spectroscopic follow-up. Then, we made the final decision based on the apparent magnitudes, which should be brighter than ∼25.5 mag for the Keck/LRIS follow-up or ∼24.5 mag for Gemini/GMOS-S follow-up to take a spectrum in a few hours. For example, HSC16apuo had the highest priority to follow for a while, but bad weather prevented us from taking its spectrum when it was bright enough. The remaining candidates and their LCs will be reported elsewhere after the completion of the survey.
4. High-redshift Supernova Candidates beyond the Redshift of 3
We additionally report two high-redshift SN candidates, one at z ∼ 3 and the other at z ∼ 4, to demonstrate the capability of the SHIZUCA. Neither the SN spectra nor the host galaxy spectra are taken so far.18 However, their host galaxy photometric redshifts suggest the high-redshift nature of the SN candidates. Figure 10 shows the images of these high-redshift SN candidates. For the z ∼ 4 SN candidate (HSC17dsid), we show the image cutouts of all the observed epochs in Figure 16. Figure 11 presents the host galaxy photometric redshifts obtained by MIZUKI. Their SEDs and the best-fit host galaxy synthetic spectra are shown in Figure 12.
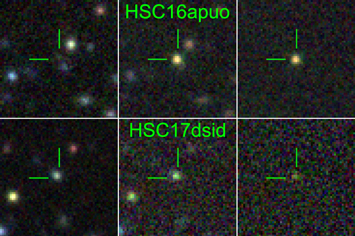
Figure 10. The images (10'' × 10'') of high-redshift SN candidates. The left panels show the reference images, the middle panels show images after the SN discovery, and the right panels show their subtractions. Three filters (i, r, and z) are used to make the color composite. The SN locations are at the center of the images. For HSC17dsid, the image cutouts for all the epochs are available in the Appendix. North is up and east is left.
Download figure:
Standard image High-resolution image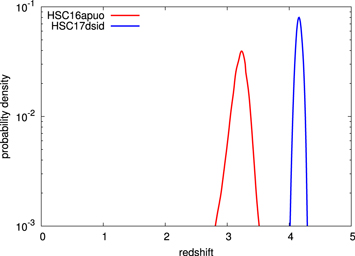
Figure 11. Photometric redshifts of the host galaxies of the high-redshift SN candidates estimated by MIZUKI using the HSC and COSMOS2015 photometry of the host galaxies (Figure 12). The COSMOS2015 photo-z are  (HSC16apuo) and
  (HSC17dsid).
Download figure:
Standard image High-resolution image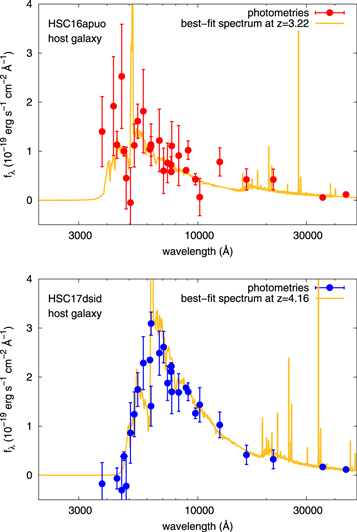
Figure 12. SEDs of the host galaxies of our high-redshift SN candidates with the best-fit synthesized galaxy spectra obtained by MIZUKI. The photometric data are from HSC and COSMOS2015.
Download figure:
Standard image High-resolution image4.1. HSC16apuo (AT 2016jho)
HSC16apuo (AT 2016jho) was discovered at (R.A., decl.) = (10:01:29.42, +02:28:33.8) on 2016 December 23 in a galaxy with the COSMOS photo-z of  (Figure 10). It appeared 056 ± 005 away from the host galaxy center, which is located in the southwest of HSC16apuo. The corresponding physical distance is at z = 3 is 4.3 kpc. The PDF of the photometric redshift of the host galaxy estimated by MIZUKI is shown in Figure 11. The most probable redshift is 3.22, but the PDF has the relatively extended distribution ranging from z ≃ 2.8 to 3.5. The SED of the host galaxy is presented in Figure 12. The relatively large photometric uncertainties lead to the uncertainty in the photometric redshift, but its faintness and the small flux below ∼4000 Å support the photometric redshift of around 3 and reject the low redshift possibilities. The estimated stellar mass and SFR of the host galaxy are
  and the SFR of
  , respectively. The best-fit SED model presented in Figure 12 has χ2/dof = 26.80/30. Assuming z = 3, the SN is brighter than −21 mag at the peak (Figure 13; see Table 5 for photometry data).
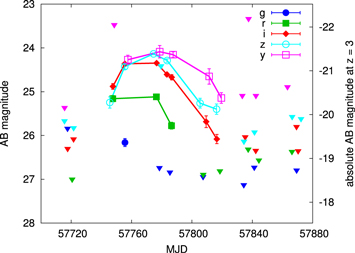
Figure 13. LCs of HSC16apuo (Table 5). Detections with the significance of more than 5σ are presented with the 1σ error, and triangles show the 5σ detection limit. Detections are connected with lines. The right axis shows the expected absolute magnitude at z = 3 that includes the simple K correction of  (Hogg et al. 2002).
Download figure:
Standard image High-resolution imageAlthough HSC16apuo appears to be at the edge of this galaxy, there is another galaxy at 19 toward the northwest. The photometric redshift of this galaxy is degenerate, and it could be either z ∼ 0.5 or 3.
4.2. HSC17dsid (AT 2017fej)
HSC17dsid (AT 2017fej) is the most distant SN candidate found in the survey so far. It was discovered at (R.A., decl.) = (10:02:58.12, +02:13:04.1) on 2017 April 26 in a galaxy with the COSMOS photo-z of  (Figure 10). The SN location is 016 ± 007 away (1.1 kpc at z = 4) from the host galaxy center. The PDF of the photometric redshift of the host galaxy estimated by MIZUKI is shown in Figure 11. The most probable redshift is 4.16. The PDF has a narrow distribution and HSC17dsid is likely at z ∼ 4. The host galaxy SED presented in Figure 12 clearly shows the signature of the Lyman break at ∼5000 Å, which strongly supports the host redshift of z ∼ 4. The stellar mass and SFR of the host galaxy are estimated to be
  and
and  , respectively. The best-fit SED model presented in Figure 11 has χ2/dof = 22.39/30.
The LC of HSC17dsid is shown in Figure 14 (see also Figure 16). HSC17dsid was discovered at the end of our transient survey period. However, additional photometry was obtained by Gemini/GMOS-S on 2017 May 31 (UT) with the i band (these data are reduced following standard procedures; open diamond in Figure 14). Because HSC17dsid was much brighter than the host galaxy (24.8 mag in the i band) when it was observed with Gemini, we did not perform the image subtraction for the Gemini photometry, and we use the aperture photometry. We also had an opportunity to take another z band image with HSC on 2017 June 20 (UT). Assuming z = 4, HSC17dsid reaches −22.7 mag at 1600 Å in about 10 days. It is brighter than the ultraviolet-brightest SLSN currently known (Gaia16apd, Nicholl et al. 2017b; Yan et al. 2017), which could be due to a smaller metallicity and thus lower extinction from the ejecta.
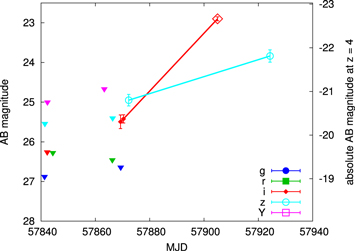
Figure 14. LCs of HSC17dsid (Figure 16). Detections with the significance of more than 5σ are presented with the 1σ error, and triangles show the 5σ detection limit. The i band observation with Gemini/GMOS-S is shown with the red open diamond shape. Detections are connected with lines. The right axis shows the expected absolute magnitude at z = 4 that includes the simple K correction of  (Hogg et al. 2002).
Download figure:
Standard image High-resolution image5. Discussion
5.1. Comparison with Other High-redshift SLSNe
Two SLSNe have been reported in the literature that are at the similar redshifts to our SLSNe: DES15E2mlf at z = 1.861 (Pan et al. 2017) and DES16C2nm at z = 1.998 (Smith et al. 2018). Their peak optical magnitudes are at around 23 mag, which is brighter than the peak magnitudes of our SLSNe (∼24 mag). They are found in the shallower transient survey, and HSC allowed us to find fainter SLSNe.
Our high-redshift SLSNe are fainter in the rest-frame ultraviolet wavelengths that we directly observe, as well as in the rest-frame optical bands whose luminosity is estimated in the previous section. While DES15E2mlf and DES16C2nm are brighter than −22 mag in optical, our SLSNe basically remain fainter than −22 mag in the rest-frame optical. The rest-frame optical peak magnitudes of SLSNe are usually between −19 mag and −22 mag (e.g., Nicholl et al. 2017a; De Cia et al. 2018; Lunnan et al. 2018). Therefore, our survey is capable of finding SLSNe with peak magnitudes fainter than −21 mag, while the previous surveys could only observe the most luminous end of the high-redshift SLSN populations.
5.2. Approximate Event Rates
We roughly estimate the event rates of SLSNe at high redshifts based on the three spectroscopically confirmed SNe and SN candidates we present here. Because the complete selection of high-redshift SN candidates from the survey has not yet been finished, our rate estimates are approximate. We have at least a few more good SN candidates at z ∼ 2 whose redshifts are not spectroscopically confirmed. The actual number depends on the choice of criteria, which include detection sigma and number of filters exceeding the threshold, LC evolution, color evolution, interpolation over missing epochs and missing filter information, etc. In addition, our high-redshift SN candidates are selected based on the photometric redshifts of the host galaxies, and we have not completed our investigation into how our selection methods affect our discoveries. For example, we may have missed SLSNe without apparent host galaxies or with faint ones (see also Section 5.3 for related discussion). These remaining candidates and final rate estimates will be presented elsewhere.
The event rate can be expressed as  where T is the survey period, V is the comoving volume, zi is the redshift of an event, and εi is the detection efficiency of an event (e.g., Prajs et al. 2017). We assume εi ∼ 1 here for simplicity. The actual efficiency is clearly less than 1 because we could not confirm the redshifts of many high-redshift SLSN candidates, and this makes our rates only approximate. The survey period is set as T ∼ 0.5 yr. Assuming a typical limiting magnitude of 26.5 mag, SNe evolving with absolute magnitudes brighter than ≃−20 mag can be detected up to z ∼ 4.5.
We estimate the event rates in the redshift ranges 1.5 ≲ z ≲2.5, 2.5 ≲ z ≲ 3.5, and 3.5 ≲ z ≲ 4.5. We confirmed three SLSNe at 1.5 ≲ z ≲ 2.5. Summing up the three events, we find the approximate event rate of ∼900 ± 520 Gpc−3 yr−1 using Poisson error. This rate is consistent with the expected total SLSN rate at 1.5 ≲ z ≲ 2.5 obtained by extrapolating the total SLSN rate at z ∼ 0.2 based on the cosmic star formation history (Figure 15).

Figure 15. Total SLSN rate estimates. The approximate rates from this study, which are very roughly estimated based on the equation  (see text), are presented with Poisson errors. Our z ∼ 2 rate (red) is based on the spectroscopically confirmed SLSNe, and those at z ∼ 3 and 4 (green) are based on the spectroscopically unconfirmed SLSN candidates. The total SLSN rates estimated in the previous studies (Cooke et al. 2012; Quimby et al. 2013) are also shown. The rate of Cooke et al. (2012) is a lower limit. We also show the Type I SLSN rate estimated by Prajs et al. (2017) for reference (dotted brown line; see also McCrum et al. 2014), but the Type I SLSN rate at z ∼ 0.2 is only about 10% of the total SLSN rate (Quimby et al. 2013). The hatched region shows the total SLSN rates that are extrapolated from the rate at z ∼ 0.16 (Quimby et al. 2013) based on the cosmic star formation history (Madau & Dickinson 2014). We extrapolate the 1σ range of the rate at z ∼ 0.16, which is indicated with the hatched region.
Download figure:
Standard image High-resolution imageWe obtained at least one SLSN candidate at 2.5 ≲ z ≲ 3.5 and another SLSN candidate at 3.5 ≲ z ≲ 4.5. The approximate total SLSN rate based on these candidates are ∼400 ±400 Gpc−3 yr−1 (2.5 ≲ z ≲ 3.5) and ∼500 ± 500 Gpc−3 yr−1 (3.5 ≲ z ≲ 4.5) including the Poisson error. The approximate rates are already consistent with the high-redshift SLSN rate estimated by Cooke et al. (2012) (Figure 15). We note that Cooke et al. (2012) argue that their rate estimate is a lower limit.
The approximate event rates estimated in this section are summarized in Figure 15. We repeat that the estimates for the event rates presented here are still very approximate. A complete study of the high-redshift SN rates from the HSC-SSP transient survey will be presented elsewhere after the completion of the survey.
5.3. Host Galaxy Properties
The host galaxies of the high-redshift SNe and SN candidates reported here have ∼−21 mag in the rest ultraviolet and are relatively massive galaxies (∼1010 M⊙). Meanwhile, high-redshift (z > 1) SLSNe have been classified as Type I SLSNe and are typically found in less massive galaxies (∼109–8 M⊙) (e.g., Schulze et al. 2018). The SFRs of our host galaxies (∼10 M⊙ yr−1) are also higher than those of the other SLSN host galaxies (∼1 M⊙ yr−1), but their specific SFRs (∼10−9 yr−1) are similar to those found in the other SLSN host galaxies (e.g., Schulze et al. 2018). The MIZUKI code is shown to give galaxy property estimates that are consistent with the other methods, and this difference is not likely to originate from systematic uncertainties (Tanaka 2015).
Previous high-redshift SLSN discoveries are limited to Type I SLSNe, which are found to preferentially appear in low-metallicity environments (e.g., Howell et al. 2013; Pan et al. 2017; Smith et al. 2018). However, the galaxy mass–metallicity relation at z ≃ 2 shows that galaxies with ∼1010 M⊙ at z ≃ 2 are as metal-poor as the ∼108–109 M⊙ hosts in the local universe (e.g., Erb et al. 2006; Steidel et al. 2014; Sanders et al. 2015), where Type I SLSNe are found (e.g., Chen et al. 2017). Indeed, high-redshift Type I SLSNe are sometimes found in such massive galaxies with ∼1010 M⊙ (Cooke et al. 2012; Perley et al. 2016; Schulze et al. 2018). Type II SLSN host galaxies have large diversities (e.g., Neill et al. 2011), and our high-redshift SLSN host properties are consistent with being both Type II and Type I host galaxies.
We note, however, that our preference to find SLSNe in relatively massive galaxies could be partly due to our method of selecting high-redshift SN candidates, i.e., using photometric redshifts of the host galaxies. Brighter galaxies would have better estimates of photometric redshifts, and we tend to follow high-redshift SN candidates with better photometric redshifts to secure our high-redshift SN discoveries. Further systematic investigations are required to conclude the host galaxy properties of the high-redshift SLSNe.
6. Conclusions
We have reported our initial high-redshift SN discoveries from the SHIZUCA conducted from 2016 November to 2017 May at the COSMOS field. We have shown three SNe at the redshifts around 2, i.e., HSC16adga at z = 2.399 ± 0.004, HSC17auzg at z = 1.965 ± 0.004, and HSC17dbpf at z = 1.851 ± 0.004. In this paper, we reported their photometric properties, and their spectroscopic observations are presented in the accompanying paper (C19). These high-redshift SNe are first selected based on their host galaxies' photometric redshifts, and then the redshifts are confirmed by spectroscopy. They are likely SLSNe because of their proximity to −21 mag in the rest-frame ultraviolet bands that we observed. At least three SLSNe detections at z ≃ 2 in our survey using only the spectroscopically confirmed events indicate an approximate SLSN event rate of ∼900 ± 520 Gpc−3 yr−1 at z ≃ 2 including the Poisson error.
In addition to the spectroscopically confirmed SNe at z ≃ 2, we reported one SN candidate at z ∼ 3 and another SN candidate at z ∼ 4. Their redshifts are estimated by the photometric redshifts of their host galaxies. The photometric redshifts are based on the photometry of the about 30 bands available in the COSMOS field, as well as our HSC photometry. Estimated approximate event rates from the detections are ∼400 ± 400 Gpc−3 yr−1 (z ∼ 3) and ∼500 ±500 Gpc−3 yr−1 (z ∼ 4) with the Poisson errors.
The high-redshift SNe and SN candidates reported in this paper are still based on our initial analysis, but we can already see the amazing capability of Subaru/HSC to find high-redshift SNe. We have not finished the complete search for high-redshift SNe in our data. In addition, a further transient survey is planned at the SXDS field in 2019–2020. We will obtain more high-redshift SNe from these observations. The complete samples of high-redshift SNe from the HSC-SSP transient survey will be presented after the completion of the survey.
This research is supported by the Grants-in-Aid for Scientific Research of the Japan Society for the Promotion of Science (16H07413, 17H02864) and by JSPS Open Partnership Bilateral Joint Research Project between Japan and Chile. J.C. acknowledges the Australian Research Council Future Fellowship grant FT130101219. L.G. was supported in part by the US National Science Foundation under Grant AST-1311862. Support for G.P. is provided by the Ministry of Economy, Development, and Tourism's Millennium Science Initiative through grant IC120009, awarded to The Millennium Institute of Astrophysics, MAS. G.P. also acknowledges support by the Proyecto Regular FONDECYT 1140352. This research is partly supported by Japan Science and Technology Agency CREST JPMHCR1414. Parts of this research were conducted by the Australian Research Council Centre of Excellence for All-sky Astrophysics (CAASTRO), through project number CE110001020.
The Hyper Suprime-Cam (HSC) collaboration includes the astronomical communities of Japan and Taiwan, and Princeton University. The HSC instrumentation and software were developed by the National Astronomical Observatory of Japan (NAOJ), the Kavli Institute for the Physics and Mathematics of the Universe (Kavli IPMU), the University of Tokyo, the High Energy Accelerator Research Organization (KEK), the Academia Sinica Institute for Astronomy and Astrophysics in Taiwan (ASIAA), and Princeton University. Funding was contributed by the FIRST program from the Japanese Cabinet Office; the Ministry of Education, Culture, Sports, Science and Technology (MEXT); the Japan Society for the Promotion of Science (JSPS); the Japan Science and Technology Agency (JST); the Toray Science Foundation; NAOJ; Kavli IPMU; KEK; ASIAA; and Princeton University.
The Pan-STARRS1 Surveys (PS1) have been made possible through contributions of the Institute for Astronomy, the University of Hawaii, the Pan-STARRS Project Office, the Max Planck Society and its participating institutes, the Max Planck Institute for Astronomy, Heidelberg and the Max Planck Institute for Extraterrestrial Physics, Garching, Johns Hopkins University, Durham University, the University of Edinburgh, Queen's University Belfast, the Harvard-Smithsonian Center for Astrophysics, the Las Cumbres Observatory Global Telescope Network Incorporated, the National Central University of Taiwan, the Space Telescope Science Institute, the National Aeronautics and Space Administration under grant No. NNX08AR22G issued through the Planetary Science Division of the NASA Science Mission Directorate, the National Science Foundation under grant No. AST-1238877, the University of Maryland, and Eotvos Lorand University (ELTE).
This paper makes use of software developed for the Large Synoptic Survey Telescope. We thank the LSST Project for making their code available as free software at http://dm.lsst.org.
Based on data collected at the Subaru Telescope and retrieved from the HSC data archive system, which is operated by the Subaru Telescope and Astronomy Data Center at the National Astronomical Observatory of Japan.
Based in part on data obtained at the Gemini Observatory via the time exchange program between Gemini and the Subaru Telescope processed using the Gemini IRAF package (program ID: S17A-056, GS-2017A-Q-13). The Gemini Observatory is operated by the Association of Universities for Research in Astronomy, Inc., under a cooperative agreement with the NSF on behalf of the Gemini partnership: the National Science Foundation (United States), the National Research Council (Canada), CONICYT (Chile), Ministerio de Ciencia, Tecnología e Innovación Productiva (Argentina), and Ministério da Ciência, Tecnologia e Inovação (Brazil).
This research has made use of the NASA/IPAC Extragalactic Database (NED), which is operated by the Jet Propulsion Laboratory, California Institute of Technology, under contract with the National Aeronautics and Space Administration.
Facilities: Subaru/HSC - , Gemini/GMOS-S - .
Software: MIZUKI (Tanaka 2015), hscPipe (Bosch et al. 2018).
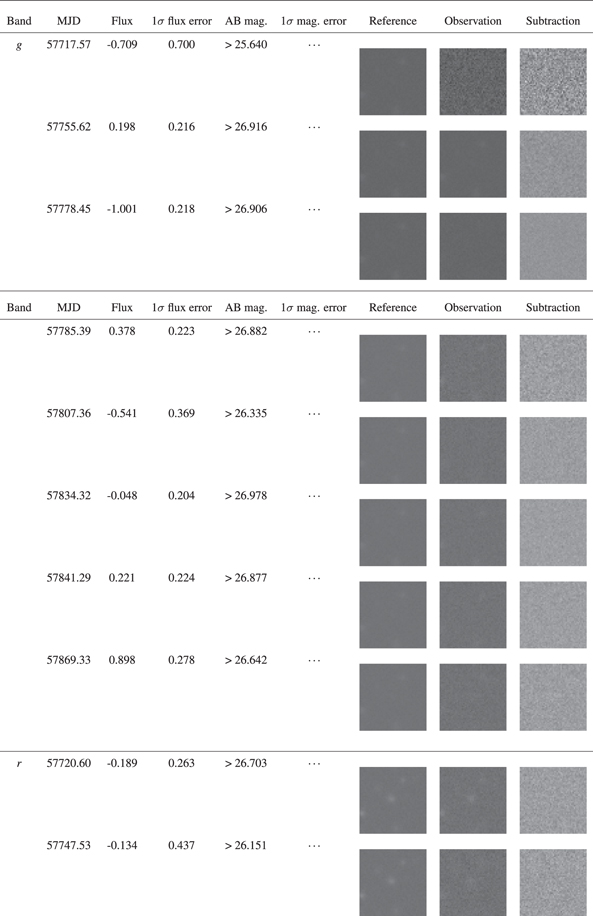
Appendix: Log of Photometry
We summarize photometric information of the transients presented in this paper in Tables 2–5 and Figure 16. One count in flux corresponds to 27 mag. For HSC17dsid, we also show all the image cutouts from HSC because the images in Figure 10 may not be clear enough to identify the detection. The image size is 86 × 86 (51 pixel × 51 pixel).
Table 2. HSC16adga (SN 2016jhm)
| Band | Modified Julian Date (MJD) | Flux | 1σ Flux Error | AB mag. | 1σ mag. Error |
|---|---|---|---|---|---|
| g | 57717.56 | 4.286 | 1.281 | >24.984 | ⋯ |
| 57755.61 | 4.655 | 0.185 | 25.330 | 0.043 | |
| 57778.45 | 3.097 | 0.266 | 25.773 | 0.093 | |
| 57785.39 | 2.198 | 0.327 | 26.145 | 0.162 | |
| 57807.37 | 1.129 | 0.352 | >26.386 | ⋯ | |
| 57834.31 | 0.983 | 0.191 | 27.019 | 0.211 | |
| 57841.29 | 0.892 | 0.327 | >26.466 | ⋯ | |
| 57869.33 | −0.426 | 0.422 | >26.189 | ⋯ | |
| r | 57720.60 | 4.554 | 0.367 | 25.354 | 0.087 |
| 57747.53 | 6.734 | 0.390 | 24.929 | 0.063 | |
| 57776.40 | 5.092 | 0.261 | 25.233 | 0.056 | |
| 57786.45 | 4.099 | 0.319 | 25.468 | 0.084 | |
| 57807.48 | 3.260 | 0.318 | 25.717 | 0.106 | |
| 57818.52 | 1.471 | 0.265 | 26.581 | 0.195 | |
| 57837.26 | 1.174 | 0.403 | >26.239 | ⋯ | |
| 57844.33 | 1.807 | 0.422 | >26.189 | ⋯ | |
| 57866.25 | 0.655 | 0.746 | >25.571 | ⋯ | |
| i | 57717.62 | 4.380 | 0.632 | 25.396 | 0.157 |
| 57721.54 | 3.871 | 0.612 | 25.530 | 0.172 | |
| 57747.61 | 7.520 | 0.551 | 24.810 | 0.080 | |
| 57755.53 | 7.327 | 0.345 | 24.838 | 0.051 | |
| 57776.54 | 6.709 | 0.303 | 24.933 | 0.049 | |
| 57783.43 | 6.925 | 0.433 | 24.899 | 0.068 | |
| 57786.59 | 5.664 | 0.407 | 25.117 | 0.078 | |
| 57809.40 | 4.862 | 0.713 | 25.283 | 0.159 | |
| 57816.47 | 3.119 | 0.327 | 25.765 | 0.114 | |
| 57835.26 | 2.184 | 0.414 | 26.152 | 0.206 | |
| 57842.27 | 1.609 | 0.540 | >25.922 | ⋯ | |
| 57869.26 | 1.021 | 0.659 | >25.705 | ⋯ | |
| 57870.35 | 2.062 | 0.437 | >26.151 | ⋯ | |
| z | 57715.54 | 0.251 | 1.150 | >25.101 | ⋯ |
| 57721.59 | 4.698 | 0.960 | >25.297 | ⋯ | |
| 57745.56 | 8.227 | 0.644 | 24.712 | 0.085 | |
| 57755.45 | 10.688 | 0.902 | 24.428 | 0.092 | |
| 57774.50 | 8.625 | 0.380 | 24.661 | 0.048 | |
| 57779.53 | 9.211 | 1.600 | 24.589 | 0.189 | |
| 57783.56 | 7.309 | 0.414 | 24.840 | 0.062 | |
| 57805.37 | 6.359 | 0.587 | 24.992 | 0.100 | |
| 57816.30 | 5.014 | 0.821 | 25.250 | 0.178 | |
| 57834.43 | 5.865 | 0.734 | 25.079 | 0.136 | |
| 57841.41 | 3.088 | 0.838 | >25.444 | ⋯ | |
| 57866.36 | 3.020 | 1.871 | >24.572 | ⋯ | |
| 57872.26 | 4.808 | 1.274 | >24.990 | ⋯ | |
| 57924.28 | 5.025 | 3.407 | >23.922 | ⋯ | |
| y | 57715.62 | 0.397 | 1.855 | >24.582 | ⋯ |
| 57748.54 | 15.618 | 5.070 | >23.490 | ⋯ | |
| 57757.52 | 10.330 | 1.545 | 24.465 | 0.162 | |
| 57778.62 | 0.598 | 2.643 | >24.197 | ⋯ | |
| 57787.46 | 10.169 | 1.569 | 24.482 | 0.168 | |
| 57811.40 | 4.843 | 1.733 | >24.656 | ⋯ | |
| 57819.45 | 6.652 | 0.758 | 24.943 | 0.124 | |
| 57833.37 | 5.724 | 1.245 | >25.015 | ⋯ | |
| 57837.49 | −10.941 | 6.880 | >23.159 | ⋯ | |
| 57842.35 | 7.829 | 2.245 | >24.375 | ⋯ | |
| 57863.28 | 8.006 | 2.423 | >24.292 | ⋯ | |
Note. Nondetections are 5σ limits.
Download table as: ASCIITypeset image
Table 3. HSC17auzg (SN 2016jhn)
| Band | MJD | Flux | 1σ Flux Error | AB mag. | 1σ mag. Error |
|---|---|---|---|---|---|
| g | 57717.57 | 0.636 | 0.519 | >25.965 | ⋯ |
| 57755.62 | 5.269 | 0.178 | 25.196 | 0.037 | |
| 57778.45 | 6.749 | 0.241 | 24.927 | 0.039 | |
| 57785.39 | 5.611 | 0.269 | 25.127 | 0.052 | |
| 57807.37 | 4.862 | 0.263 | 25.283 | 0.059 | |
| 57834.32 | 3.475 | 0.191 | 25.648 | 0.060 | |
| 57841.29 | 3.467 | 0.257 | 25.650 | 0.081 | |
| 57869.33 | 1.546 | 0.248 | 26.527 | 0.174 | |
| r | 57720.60 | −0.342 | 0.202 | >26.989 | ⋯ |
| 57747.53 | 2.389 | 0.377 | 26.054 | 0.171 | |
| 57776.41 | 9.246 | 0.217 | 24.585 | 0.025 | |
| 57786.45 | 9.127 | 0.235 | 24.599 | 0.028 | |
| 57807.48 | 8.712 | 0.261 | 24.650 | 0.032 | |
| 57818.52 | 8.686 | 0.235 | 24.653 | 0.029 | |
| 57837.26 | 6.485 | 0.318 | 24.970 | 0.053 | |
| 57844.33 | 4.864 | 0.286 | 25.283 | 0.064 | |
| 57866.25 | 3.003 | 0.355 | 25.806 | 0.128 | |
| i | 57717.62 | 0.672 | 0.368 | >26.338 | ⋯ |
| 57721.55 | 0.648 | 0.447 | >26.127 | ⋯ | |
| 57747.61 | 2.426 | 0.466 | 26.038 | 0.209 | |
| 57755.51 | 4.749 | 0.232 | 25.308 | 0.053 | |
| 57776.55 | 9.451 | 0.269 | 24.561 | 0.031 | |
| 57783.43 | 10.661 | 0.388 | 24.430 | 0.040 | |
| 57786.58 | 9.828 | 0.476 | 24.519 | 0.053 | |
| 57809.41 | 11.621 | 0.421 | 24.337 | 0.039 | |
| 57816.48 | 11.767 | 0.246 | 24.323 | 0.023 | |
| 57835.27 | 10.867 | 0.447 | 24.410 | 0.045 | |
| 57842.27 | 9.276 | 0.321 | 24.582 | 0.038 | |
| 57869.27 | 4.634 | 0.490 | 25.335 | 0.115 | |
| 57870.35 | 4.646 | 0.376 | 25.332 | 0.088 | |
| z | 57715.55 | −0.893 | 0.605 | >25.798 | ⋯ |
| 57721.60 | 0.513 | 0.589 | >25.827 | ⋯ | |
| 57745.57 | 2.618 | 0.579 | >25.846 | ⋯ | |
| 57755.45 | 6.968 | 0.602 | 24.892 | 0.094 | |
| 57774.52 | 11.399 | 0.270 | 24.358 | 0.026 | |
| 57779.52 | 13.194 | 1.935 | 24.199 | 0.159 | |
| 57783.56 | 12.050 | 0.474 | 24.298 | 0.043 | |
| 57805.36 | 14.520 | 0.514 | 24.095 | 0.038 | |
| 57816.31 | 15.976 | 0.482 | 23.991 | 0.033 | |
| 57834.43 | 14.081 | 0.410 | 24.128 | 0.032 | |
| 57841.41 | 12.330 | 0.559 | 24.273 | 0.049 | |
| 57866.36 | 10.028 | 0.716 | 24.497 | 0.077 | |
| 57872.26 | 7.896 | 0.724 | 24.756 | 0.099 | |
| 57924.28 | 2.283 | 2.563 | >24.231 | ⋯ | |
| y | 57715.62 | −3.266 | 0.963 | >25.294 | ⋯ |
| 57748.53 | −0.606 | 5.343 | >23.433 | ⋯ | |
| 57757.51 | 8.846 | 1.197 | 24.633 | 0.147 | |
| 57778.62 | 10.340 | 2.520 | >24.249 | ⋯ | |
| 57787.47 | 11.019 | 0.919 | 24.395 | 0.091 | |
| 57811.39 | 10.573 | 2.091 | 24.440 | 0.215 | |
| 57819.47 | 15.617 | 0.635 | 24.016 | 0.044 | |
| 57833.38 | 16.761 | 0.989 | 23.939 | 0.064 | |
| 57837.49 | 19.342 | 5.434 | >23.415 | ⋯ | |
| 57842.35 | 15.230 | 1.214 | 24.043 | 0.087 | |
| 57863.28 | 9.082 | 1.420 | 24.605 | 0.170 | |
Note. Nondetections are 5σ limits.
Download table as: ASCIITypeset image
Table 4. HSC17dbpf (SN 2017fei)
| Band | MJD | Flux | 1σ Flux Error | AB mag. | 1σ mag. Error |
|---|---|---|---|---|---|
| g | 57717.57 | 0.038 | 0.749 | >25.566 | ⋯ |
| 57755.61 | −0.067 | 0.166 | >27.202 | ⋯ | |
| 57778.45 | 0.559 | 0.227 | >26.863 | ⋯ | |
| 57785.39 | 0.054 | 0.268 | >26.682 | ⋯ | |
| 57807.37 | 0.114 | 0.191 | >27.050 | ⋯ | |
| 57834.31 | 6.518 | 0.183 | 24.965 | 0.031 | |
| 57841.29 | 2.437 | 0.243 | 26.033 | 0.108 | |
| 57869.33 | 0.060 | 0.348 | >26.399 | ⋯ | |
| r | 57720.60 | −0.422 | 0.249 | >26.762 | ⋯ |
| 57747.53 | −0.131 | 0.346 | >26.405 | ⋯ | |
| 57776.40 | −0.137 | 0.218 | >26.906 | ⋯ | |
| 57786.45 | −0.019 | 0.221 | >26.892 | ⋯ | |
| 57807.48 | −0.208 | 0.255 | >26.736 | ⋯ | |
| 57818.52 | 22.222 | 0.278 | 23.633 | 0.014 | |
| 57837.26 | 12.834 | 0.310 | 24.229 | 0.026 | |
| 57844.33 | 6.848 | 0.282 | 24.911 | 0.045 | |
| 57866.24 | 0.819 | 0.384 | >26.292 | ⋯ | |
| i | 57717.62 | −0.802 | 0.386 | >26.286 | ⋯ |
| 57721.55 | 0.487 | 0.467 | >26.079 | ⋯ | |
| 57747.62 | −0.030 | 0.499 | >26.007 | ⋯ | |
| 57755.51 | −0.843 | 0.286 | >26.612 | ⋯ | |
| 57776.55 | −0.049 | 0.263 | >26.703 | ⋯ | |
| 57783.43 | −0.346 | 0.405 | >26.234 | ⋯ | |
| 57786.57 | −0.154 | 0.573 | >25.857 | ⋯ | |
| 57809.41 | −0.090 | 0.485 | >26.038 | ⋯ | |
| 57816.47 | 12.005 | 0.259 | 24.302 | 0.023 | |
| 57835.26 | 17.798 | 0.425 | 23.874 | 0.026 | |
| 57842.27 | 13.090 | 0.354 | 24.208 | 0.029 | |
| 57869.27 | 2.364 | 0.506 | >25.992 | ⋯ | |
| 57870.35 | 3.385 | 0.453 | 25.676 | 0.145 | |
| z | 57715.55 | 0.050 | 0.643 | >25.732 | ⋯ |
| 57721.60 | 0.463 | 0.789 | >25.510 | ⋯ | |
| 57745.56 | 0.274 | 0.648 | >25.724 | ⋯ | |
| 57755.45 | −0.961 | 0.752 | >25.562 | ⋯ | |
| 57774.50 | −0.062 | 0.253 | >26.745 | ⋯ | |
| 57783.55 | 0.327 | 0.425 | >26.182 | ⋯ | |
| 57805.37 | −0.036 | 0.469 | >26.075 | ⋯ | |
| 57816.31 | 12.154 | 0.548 | 24.288 | 0.049 | |
| 57834.43 | 18.671 | 0.461 | 23.822 | 0.027 | |
| 57841.41 | 16.124 | 0.580 | 23.981 | 0.039 | |
| 57866.36 | 5.048 | 0.825 | 25.242 | 0.177 | |
| 57872.26 | 4.154 | 0.766 | 25.454 | 0.200 | |
| 57924.28 | 3.222 | 2.895 | >24.098 | ⋯ | |
| y | 57715.62 | −1.708 | 1.030 | >25.220 | ⋯ |
| 57748.53 | −7.152 | 5.735 | >23.356 | ⋯ | |
| 57757.52 | 3.738 | 1.216 | >25.040 | ⋯ | |
| 57778.62 | −0.099 | 2.208 | >24.393 | ⋯ | |
| 57787.48 | 0.118 | 0.914 | >25.350 | ⋯ | |
| 57811.40 | −0.344 | 1.561 | >24.769 | ⋯ | |
| 57819.46 | 16.211 | 0.745 | 23.975 | 0.050 | |
| 57833.38 | 14.346 | 0.974 | 24.108 | 0.074 | |
| 57837.49 | 26.400 | 6.482 | >23.223 | ⋯ | |
| 57842.35 | 12.303 | 1.476 | 24.275 | 0.130 | |
| 57863.28 | 9.221 | 1.714 | 24.588 | 0.202 | |
Note. Nondetections are 5σ limits.
Download table as: ASCIITypeset image
Table 5. HSC16apuo (AT 2016jho)
| Band | MJD | Flux | 1σ Flux Error | AB mag. | 1σ mag. Error |
|---|---|---|---|---|---|
| g | 57717.56 | −0.277 | 0.582 | >25.840 | ⋯ |
| 57755.61 | 2.165 | 0.182 | 26.161 | 0.091 | |
| 57778.45 | 1.180 | 0.255 | >26.736 | ⋯ | |
| 57785.39 | −0.060 | 0.232 | >26.839 | ⋯ | |
| 57807.37 | −0.392 | 0.211 | >26.942 | ⋯ | |
| 57834.32 | −0.226 | 0.178 | >27.127 | ⋯ | |
| 57841.29 | 0.343 | 0.257 | >26.728 | ⋯ | |
| 57869.33 | −0.681 | 0.242 | >26.793 | ⋯ | |
| r | 57720.60 | −0.063 | 0.200 | >27.000 | ⋯ |
| 57747.53 | 5.452 | 0.360 | 25.159 | 0.072 | |
| 57776.42 | 5.664 | 0.228 | 25.117 | 0.044 | |
| 57786.45 | 3.087 | 0.221 | 25.776 | 0.078 | |
| 57807.48 | 0.621 | 0.221 | >26.892 | ⋯ | |
| 57818.52 | 0.119 | 0.238 | >26.811 | ⋯ | |
| 57837.26 | 0.426 | 0.376 | >26.315 | ⋯ | |
| 57844.33 | 0.031 | 0.299 | >26.563 | ⋯ | |
| 57866.25 | 0.149 | 0.358 | >26.368 | ⋯ | |
| i | 57717.62 | −0.770 | 0.381 | >26.300 | ⋯ |
| 57721.55 | 0.006 | 0.466 | >26.082 | ⋯ | |
| 57747.62 | 7.054 | 0.425 | 24.879 | 0.065 | |
| 57755.51 | 11.355 | 0.303 | 24.362 | 0.029 | |
| 57776.55 | 11.516 | 0.271 | 24.347 | 0.026 | |
| 57783.43 | 9.073 | 0.344 | 24.606 | 0.041 | |
| 57786.59 | 8.552 | 0.468 | 24.670 | 0.059 | |
| 57809.41 | 3.356 | 0.414 | 25.685 | 0.134 | |
| 57816.47 | 2.330 | 0.225 | 26.081 | 0.105 | |
| 57835.26 | 1.747 | 0.487 | >26.034 | ⋯ | |
| 57842.27 | 1.172 | 0.366 | >26.344 | ⋯ | |
| 57869.26 | 1.004 | 0.604 | >25.800 | ⋯ | |
| 57870.35 | 1.014 | 0.363 | >26.353 | ⋯ | |
| z | 57715.55 | 0.771 | 0.683 | >25.667 | ⋯ |
| 57721.60 | 0.482 | 0.590 | >25.825 | ⋯ | |
| 57745.56 | 5.031 | 0.592 | 25.246 | 0.128 | |
| 57755.45 | 10.683 | 0.530 | 24.428 | 0.054 | |
| 57774.51 | 13.982 | 0.249 | 24.136 | 0.019 | |
| 57779.53 | 10.738 | 2.171 | >24.411 | ⋯ | |
| 57783.55 | 12.158 | 0.418 | 24.288 | 0.037 | |
| 57805.37 | 4.962 | 0.510 | 25.261 | 0.112 | |
| 57816.31 | 4.369 | 0.478 | 25.399 | 0.119 | |
| 57834.43 | 1.976 | 0.444 | >26.134 | ⋯ | |
| 57841.41 | 2.062 | 0.540 | >25.922 | ⋯ | |
| 57866.36 | 1.890 | 0.745 | >25.572 | ⋯ | |
| 57872.26 | 2.513 | 0.714 | >25.618 | ⋯ | |
| 57924.28 | 1.959 | 3.274 | >23.965 | ⋯ | |
| y | 57715.62 | 0.027 | 0.903 | >25.363 | ⋯ |
| 57748.53 | 7.992 | 5.155 | >23.472 | ⋯ | |
| 57757.51 | 12.356 | 1.171 | 24.270 | 0.103 | |
| 57778.62 | 14.631 | 1.915 | 24.087 | 0.142 | |
| 57787.47 | 13.750 | 0.839 | 24.154 | 0.066 | |
| 57811.39 | 8.701 | 1.407 | 24.651 | 0.176 | |
| 57819.47 | 5.529 | 0.615 | 25.143 | 0.121 | |
| 57833.37 | 3.701 | 1.161 | >25.090 | ⋯ | |
| 57837.49 | 16.544 | 5.861 | >23.333 | ⋯ | |
| 57842.35 | 1.683 | 1.162 | >25.090 | ⋯ | |
| 57863.28 | 6.796 | 1.397 | >24.890 | ⋯ | |
Note. Nondetections are 5σ limits.
Download figure:
Standard image High-resolution image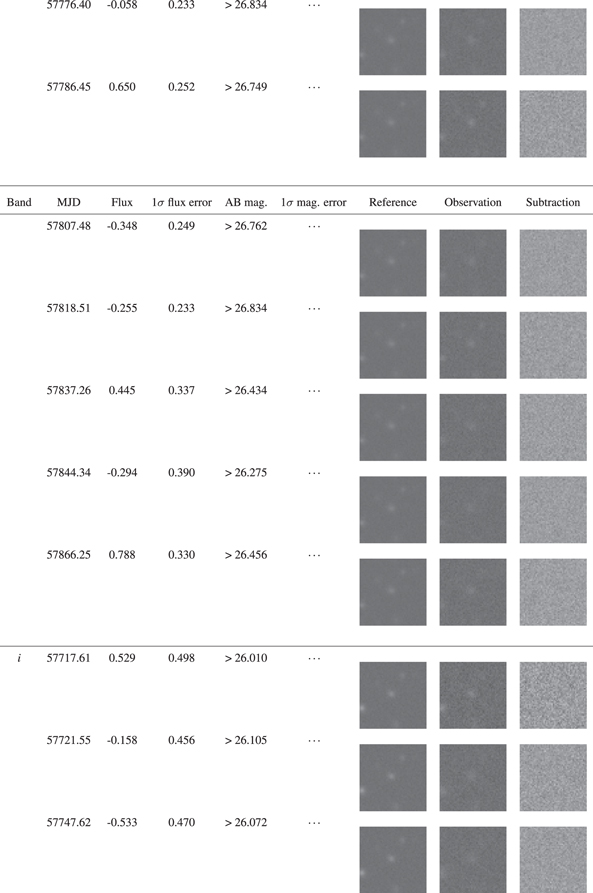
Download figure:
Standard image High-resolution image
Download figure:
Standard image High-resolution image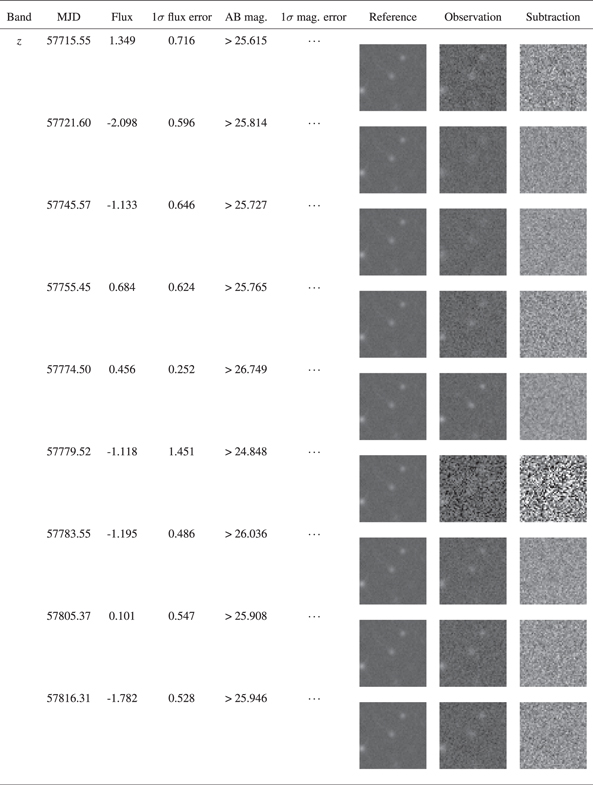
Download figure:
Standard image High-resolution image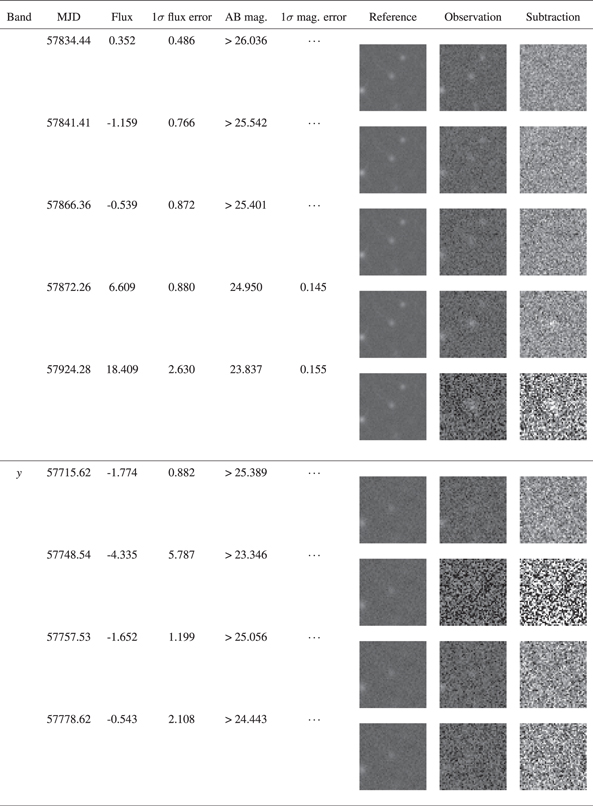
Download figure:
Standard image High-resolution image
Figure 16. HSC17dsid (AT 2017fej). Nondetections are 5σ limits. a denotes observations with Gemini/GMOS-S.
Download figure:
Standard image High-resolution image
Footnotes
- 18
While this paper had been finalized, we had an opportunity to take the host galaxy spectrum of HSC17dsid. It will be presented in a future paper.