


Abstract
This paper documents the seventeenth data release (DR17) from the Sloan Digital Sky Surveys; the fifth and final release from the fourth phase (SDSS-IV). DR17 contains the complete release of the Mapping Nearby Galaxies at Apache Point Observatory (MaNGA) survey, which reached its goal of surveying over 10,000 nearby galaxies. The complete release of the MaNGA Stellar Library accompanies this data, providing observations of almost 30,000 stars through the MaNGA instrument during bright time. DR17 also contains the complete release of the Apache Point Observatory Galactic Evolution Experiment 2 survey that publicly releases infrared spectra of over 650,000 stars. The main sample from the Extended Baryon Oscillation Spectroscopic Survey (eBOSS), as well as the subsurvey Time Domain Spectroscopic Survey data were fully released in DR16. New single-fiber optical spectroscopy released in DR17 is from the SPectroscipic IDentification of ERosita Survey subsurvey and the eBOSS-RM program. Along with the primary data sets, DR17 includes 25 new or updated value-added catalogs. This paper concludes the release of SDSS-IV survey data. SDSS continues into its fifth phase with observations already underway for the Milky Way Mapper, Local Volume Mapper, and Black Hole Mapper surveys.
Export citation and abstract BibTeX RIS

Original content from this work may be used under the terms of the Creative Commons Attribution 4.0 licence. Any further distribution of this work must maintain attribution to the author(s) and the title of the work, journal citation and DOI.
1. Introduction
The Sloan Digital Sky Surveys (SDSS) have been almost continuously observing the skies for over 20 yr, since the project began with a first phase in 1998 (SDSS-I; York et al. 2000). SDSS has now completed four phases of operations (with a fifth ongoing; see Section 8). Since 2017, SDSS has had a dual hemisphere view of the sky, observing from both Las Campanas Observatory (LCO), using the du Pont Telescope and the Sloan Foundation 2.5 m Telescope (Gunn et al. 2006) at Apache Point Observatory (APO). This paper describes data taken during the fourth phase of SDSS (SDSS-IV; Blanton et al. 2017), which consisted of three main surveys: the Extended Baryon Oscillation Spectroscopic Survey (eBOSS; Dawson et al. 2016), Mapping Nearby Galaxies at APO (MaNGA; Bundy et al. 2015), and the APO Galactic Evolution Experiment 2 (APOGEE-2; Majewski et al. 2017). Within eBOSS, SDSS-IV also conducted two smaller programs: the SPectroscopic IDentification of ERosita Sources (SPIDERS; Clerc et al. 2016; Dwelly et al. 2017) and the Time Domain Spectroscopic Survey (TDSS; Morganson et al. 2015). SDSS-IV also continued the SDSS Reverberation Mapping (RM) program to measure black hole masses out to redshifts z ∼ 1–2 using single-fiber spectra. Finally, the use of dual observing modes with the MaNGA and APOGEE instruments (Drory et al. 2015; Wilson et al. 2019) facilitated the development of the MaNGA Stellar Library (MaStar; Yan et al. 2019), which observed stars using the MaNGA fiber bundles during APOGEE-led bright-time observing.
This suite of SDSS-IV programs was developed to map the universe on a range of scales, from stars in the Milky Way and nearby satellites in APOGEE-2, to nearby galaxies in MaNGA, and out to cosmological scales with eBOSS. SPIDERS provided follow-up observations of X-ray-emitting sources, especially from eROSITA (Merloni et al. 2012; Predehl et al. 2014), and TDSS and SDSS-RM provided a spectroscopic view of the variable sky.
The final year's schedule for SDSS-IV was substantially altered due to the COVID-19 pandemic. Originally, the SDSS-IV observations were scheduled to end at APO on the night of 2020 June 30 and at LCO on the night of 2020 September 8. Closures in response to COVID-19 altered this plan. APO closed on the morning of 2020 March 24, and the 2.5 m Sloan Foundation Telescope reopened for science observations the night of 2020 June 2. The summer shutdown ordinarily scheduled in July and August was delayed, and instead SDSS-IV observations continued through the morning of 2020 August 24. LCO closed on the morning of 2020 March 17, and the du Pont Telescope reopened for science observations the night of 2020 October 20. The du Pont Telescope was used almost continuously for SDSS-IV through the morning of 2021 January 21. These changes led to different sky coverages than were originally planned for SDSS-IV but still allowed it to achieve or exceed all of its original goals.
This paper documents the seventeenth data release (DR17) from SDSS overall, and is the fifth and final annual release from SDSS-IV (following DR13: Albareti et al. 2017; DR14: Abolfathi et al. 2018; DR15: Aguado et al. 2019; and DR16: Ahumada et al. 2020). With this release, SDSS-IV has completed the goals set out in Blanton et al. (2017).
A complete overview of the scope of DR17 is provided in Section 2, and information on how to access the data can be found in Section 3. We have separate sections on MaNGA (Section 5), MaStar (Section 6), and APOGEE-2 (Section 4), and while there is no new main eBOSS survey or TDSS data in this release, we document releases from SPIDERS and the eBOSS-RM program as well as eBOSS-related value-added catalogs (VACs) in Section 7. We conclude with a summary of the current status of SDSS-V, now in active operations, along with describing plans for future data releases (Section 8).
2. Scope of DR17
SDSS data releases have always been cumulative, and DR17 follows that tradition, meaning that the most up-to-date reduction of data in all previous data releases are included in DR17. The exact data products and catalogs of previous releases also remain accessible on our servers. However, we emphatically advise users to access any SDSS data from the most recent SDSS data release, because data may have been reprocessed using updated data reduction pipelines, and catalogs may have been updated with new entries and/or improved analysis methods. Changes between the processing methods used in DR17 compared to previous data releases are documented on the DR17 version of the SDSS website, https://www.sdss.org/dr17, as well as in this article.
This data release itself includes over 46 million new files totaling over 222 TB. Although many of these files replace previous versions, the total volume of all SDSS files including all previous versions now exceeds 623 TB on the Science Archive Server (SAS). The growth of the volume of data on the SAS since DR8 (which was the first data release of SDSS-III) is shown in Figure 1.
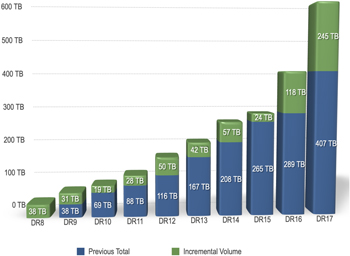
Figure 1. The growth in data volume hosted by the SDSS Science Archive Server (SAS) since DR8. For a more detailed break down of data volume, see https://sdss.org/dr17/data_access/volume.
Download figure:
Standard image High-resolution imageTable 1 shows the growth of SDSS-IV data separated by survey and target types across our five annual data releases. These numbers are a mixture of counts of unique spectra and unique objects and, while correct to the best of our ability, can be subject to change based on which quality control flags are implemented. We also summarize this information below:
- 1.APOGEE-2 is including 879,437 new infrared spectra. 154 These data come from observations taken from MJD 58,302 to MJD 59,160 (i.e., from 2018 July 2 to 2020 November 7) for APOGEE-2 North (APOGEE-2N) at APO and from MJD 58,358 to MJD 59,234 (2018 August 29 to 2021 January 20) for APOGEE-2 South (APOGEE-2S) at LCO, and the new spectra comprise both the observations of 260,594 new targets and the additional epochs on targets included in previous DRs. The majority of the targets are in the Milky Way, but DR17 also contains observations of stars in the Large and Small Magellanic Clouds and eight dwarf spheroidal satellites as well as integrated light observations of both M33 and M31. Notably, DR17 contains 408,118 new spectra taken with the APOGEE-S spectrograph at LCO; this brings the total APOGEE-2S observations to 671,379 spectra of 204,193 unique stars. DR17 also includes all the previously released APOGEE and APOGEE-2 spectra for a cumulative total of 2,659,178 individual spectra, all of which have been rereduced with the latest version of the APOGEE data reduction and analysis pipeline (J. Holtzman et al. 2022, in preparation). In addition to the reduced spectra, element abundances and stellar parameters are included in this data release. APOGEE-2 is also releasing a number of VACs, which are listed in Table 2.
- 2.MaNGA and MaStar are releasing all scientific data products from the now-completed surveys. This contains a substantial number of new galaxy and star observations respectively, along with updated products for all the observations previously released in DR15 and before. These updated data products include modifications to achieve subpercent accuracy in the spectral line-spread function (LSF), revised flux calibration, and Data Analysis Pipeline (DAP) products that now use stellar templates constructed from the MaStar observations to model the MaNGA galaxy stellar continuum throughout the full optical and near-infrared (NIR) wavelength range. MaNGA reached its target goal of observing more than 10,000 nearby galaxies, as well as a small number of non-galaxy targets, while bright-time observations enable MaStar to collect spectra for almost 30,000 stars through the MaNGA instrument. MaNGA is also releasing a number of VACs (Table 2).
- 3.There is no change in the main survey eBOSS data released since DR16, when a total of 1.4 million eBOSS spectra were released, completing its main survey goals. However, a number of VACs useful for cosmological and other applications are released in DR17. The TDSS survey also released its complete data set in DR16. However, ongoing eBOSS-like observations of X-ray sources under the SPIDERS program and continued monitoring of quasars under the SDSS-RM program are released in DR17.
- 4.DR17 also includes data from all previous SDSS data releases. All MaNGA, BOSS, eBOSS, APOGEE, and APOGEE-2 spectra that were previously released have all been reprocessed with the latest reduction and analysis pipelines. eBOSS main survey data were last released in DR16 (Ahumada et al. 2020), and SDSS-III MARVELS spectra were finalized in DR12 (Alam et al. 2015). SDSS Legacy Spectra were released in their final form in DR8 (Aihara et al. 2011), and the SEGUE-1 and SEGUE-2 surveys had their final reductions released with DR9 (Ahn et al. 2012). The SDSS imaging had its most recent release in DR13 (Albareti et al. 2017), when it was recalibrated for eBOSS imaging purposes.
Table 1. SDSS-IV Spectroscopic Data in All Releases (DR13–DR17)
| Target Category | DR13 | DR14 | DR15 | DR16 | DR17 |
|---|---|---|---|---|---|
| APOGEE-2 | |||||
| Main Red Star Sample | 109,376 | 184,148 | 184,148 | 281,575 | 372,458 |
| AllStar Entries | 164,562 | 277,371 | 277,371 | 473,307 | 733,901 |
| APOGEE-2S Main Red Star Sample | ⋯ | ⋯ | ⋯ | 56,480 | 96,547 |
| APOGEE-2S AllStar Entries | ⋯ | ⋯ | ⋯ | 102,200 | 204,193 |
| APOGEE-2S Contributed AllStar Entries | ⋯ | ⋯ | ⋯ | 37,409 | 92,152 |
| NMSU 1-meter AllStar Entries | 894 | 1018 | 1018 | 1071 | 1175 |
| Telluric AllStar Entries | 17,293 | 27,127 | 27,127 | 34,016 | 45,803 |
| MaNGA | |||||
| All Cubes | 1390 | 2812 | 4824 | 4824 | 11273 |
| Main Galaxy Sample: | |||||
| PRIMARY_v1_2 | 600 | 1278 | 2126 | 2126 | 4621 |
| SECONDARY_v1_2 | 473 | 947 | 1665 | 1665 | 3724 |
| COLOR-ENHANCED_v1_2 | 216 | 447 | 710 | 710 | 1514 |
| Other Targets a | 31 | 121 | 324 | 324 | 1420 |
| MaStar (MaNGA Stellar Library) | |||||
| All Cubes | 0 | 0 | 3321 | 3321 | 24,130 |
| eBOSS | |||||
| LRG Samples | 32,968 | 138,777 | 138,777 | 298,762 | 298,762 |
| ELG Samples | 14,459 | 35,094 | 35,094 | 269,889 | 269,889 |
| Main QSO Sample | 33,928 | 188,277 | 188,277 | 434,820 | 434,820 |
| Variability Selected QSOs | 22,756 | 87,270 | 87,270 | 185,816 | 186,625 |
| Other QSO Samples | 24,840 | 43,502 | 43,502 | 70,785 | 73,574 |
| TDSS Targets | 17,927 | 57,675 | 57,675 | 131,552 | 131,552 |
| SPIDERS Targets | 3133 | 16,394 | 16,394 | 36,300 | 41,969 |
| Reverberation Mapping | 849 b | 849 b | 849 b | 849 b | 849 b |
| Standard Stars/White Dwarfs | 53,584 | 63,880 | 63,880 | 84,605 | 85,105 |
Notes.
a Data cubes not in any of the three main galaxy samples, including both ancillary program targets and non-galaxy data cubes. b The number of RM targets remains the same, but the number of visits increases.Download table as: ASCIITypeset image
Table 2. New or Updated Value-added Catalogs (DR16+ Where Noted; Otherwise New or Updated for DR17)
| Name (See Section for Acronym Definitions) | Sections | Reference(s) |
|---|---|---|
| APOGEE-2 | ||
| Open Cluster Chemical Abundances and Mapping Catalog | Section 4.4.1 | Frinchaboy et al. (2013), Donor et al. (2018, 2020), |
| (OCCAM) | N. Myers et al. (2022, in preparation) | |
| Red-Clump (RC) Catalog | Section 4.4.1 | Bovy et al. (2014) |
| APOGEE-Joker | Section 4.4.1 | A. Price-Whelan et al. (2022, in preparation) |
| Double-lined Spectroscopic Binaries in APOGEE Spectra | Section 4.4.1 | Kounkel et al. (2021) |
| StarHorse for APOGEE DR17 + Gaia EDR3 | Section 4.4.2 | Queiroz et al. (2020) |
| AstroNN | Section 4.4.2 | Leung & Bovy (2019a, 2019b), Mackereth et al. (2019a) |
| APOGEE Net: A Unified Spectral Model | Section 4.4.3 | Olney et al. (2020), Sprague et al. (2022) |
| APOGEE on FIRE Simulation Mocks | Section 4.4.4 | Sanderson et al. (2020), Nikakhtar et al. (2021) |
| MaNGA | ||
| NSA Images (DR16+) | Section 5.5.1 | Blanton et al. (2011), Wake et al. (2017) |
| SWIFT VAC (DR16+) | Section 5.5.1 | Molina et al. (2020) |
| Galaxy Zoo: 3D | Section 5.5.2 | Masters et al. (2021) |
| Updated Galaxy Zoo Morphologies (SDSS, UKIDSS, and DESI) | Section 5.5.2 | Hart et al. (2016), Walmsley et al. (2022) |
| Visual Morphologies from SDSS + DESI Images (DR16+) | Section 5.5.2 | Vázquez-Mata et al. (2021) |
| PyMorph DR17 Photometric Catalog | Section 5.5.2 | Domínguez Sánchez et al. (2021) |
| Morphology Deep Learning DR17 Catalog | Section 5.5.2 | Domínguez Sánchez et al. (2021) |
| PCA VAC (DR17) | Section 5.5.3 | Pace et al. (2019a, 2019b). |
| Firefly Stellar Populations | Section 5.5.3 | Goddard et al. (2017), Neumann et al. (2022) |
| Pipe3D | Section 5.5.3 | Sánchez et al. (2016, 2018) |
| H i-MaNGA DR3 | Section 5.5.4 | Masters et al. (2019), Stark et al. (2021) |
| The MaNGA AGN Catalog | Section 5.5.5 | Comerford et al. (2020) |
| Galaxy Environment for MaNGA (GEMA) | Section 5.5.6 | Argudo-Fernández et al. (2015) |
| Spectroscopic Redshifts for DR17 | Section 5.5.7 | Talbot et al. (2018), M. Talbot et al. (2022, in preparation) |
| Strong Gravitational Lens Candidate Catalog | Section 5.5.8 | M. Talbot et al. (2022, in preparation) |
| MaStar | ||
| Photometry Crossmatch | Section 6.4 | R. Yan et al. (2022, in preparation) |
| Stellar Parameters | Section 6.5 | R. Yan et al. (2022, in preparation) |
| eBOSS | ||
| ELG (DR16+) | Section 7.1.1 | Raichoor et al. (2017, 2021) |
| LRG (DR16+) | Section 7.1.1 | Prakash et al. (2016), Ross et al. (2020) |
| QSO (DR16+) | Section 7.1.1 | Myers et al. (2015), Ross et al. (2020) |
| DR16 Large-scale Structure Multi-tracer EZmock Catalogs | Section 7.1.2 | Zhao et al. (2021) |
| DR16Q Catalog (DR16+) | Section 7.1.3 | Lyke et al. (2020) |
| Lyα Catalog (DR16+) | Section 7.1.4 | du Mas des Bourboux et al. (2020) |
| Strong Gravitational Lens Catalog (DR16+) | Section 7.2.1 | Talbot et al. (2021) |
| ELG-LAE Strong Lens Catalog | Section 7.2.2 | Shu et al. (2016) |
| Cosmic Web Environmental Densities from MCPM | Section 7.2.3 | Burchett et al. (2020) |
Download table as: ASCIITypeset image
A numerical overview of the total content of DR17 is given in Table 1. An overview of the VACs that are new or updated in DR17 can be found in Table 2; adding these to the VACs previously released in SDSS, the total number of VACs in SDSS as of DR17 is now 63 (DR17 updates 14 existing VACs and introduces 11 new ones). DR17 also contains the VACs that were first published in the mini data release DR16+ on 2020 June 20. DR16+ did not contain any new spectra, and consisted of VACs only. Most of the VACs in DR16+ were based on the final eBOSS DR16 spectra, and these include large-scale structure and quasar catalogs. In addition, DR16+ contained three VACs based on the DR15 MaNGA sample. The DR16+ VACs can be found in Table 2, and are described in more detail in the sections listed there.
3. Data Access
There are various ways to access the SDSS DR17 data products, and an overview of all these methods is available on the SDSS website https://www.sdss.org/dr17/data_access/, and in Table 3. In general, the best way to access a data product will depend on the particular data product and what the data product will be used for. We give an overview of all different access methods below, and also refer to tutorials and examples on data access available at https://www.sdss.org/dr17/tutorials/.
Table 3. Summary of Methods for Accessing SDSS Data
| Name | Brief Description |
|---|---|
| SAS | Science Archive Server—direct access to reduced images and spectra, and downloadable catalog files |
| SAW | Science Archive Webservers—for visualisation of images and 1D spectra |
| CAS | Catalog Archive Server—for optimized access to searchable catalog data from a database management system |
| SkyServer | web app providing visual browsing and synchronous query access to the CAS |
| Explore | a visual browsing tool in SkyServer to examine individual objects |
| Quicklook | a more succinct version of the Explore tool in SkyServer |
| CasJobs | batch (asynchronous) query access to the CAS |
| SciServer | science platform for server-side analysis. Includes browser-based and Jupyter notebook access to SkyServer, CasJobs, and Marvin |
| Marvin | a webapp and Python package to access MaNGA data |
| SpecDash | a SciServer tool to visualize 1D spectra with standalone and Jupyter notebook access |
| Voyages | an immersive introduction to data and access tools for K–12 education purposes |
Download table as: ASCIITypeset image
For those users interested in the reduced images and spectra of the SDSS, we recommend that they access these data products through the SDSS-SAS (https://data.sdss.org/sas/). These data products were all derived through the official SDSS data reduction pipelines, which are also publicly available through SVN or GitHub (https://www.sdss.org/dr17/software/). The SAS also contains the VACs that science team members have contributed to the data releases (see Table 2), as well as raw and intermediate data products. All files available through the SAS have a data model that explains their content (https://data.sdss.org/datamodel/). Data products can be downloaded from the SAS either directly through browsing or by using methods such as wget, rsync, and Globus Online (see https://www.sdss.org/dr17/data_access/bulk, for more details and examples). For large data downloads, we recommend the use of Globus Online. Since SDSS data releases are cumulative, in that data products released in earlier data releases are included in DR17, and will have been processed by the latest available pipelines, we reiterate that users should always use the latest data release, as pipelines have often been updated to improve their output and fix previously known bugs.
The Science Archive Webservers (SAW) provides visualizations of most of the reduced images and data products available on the SAS. The SAW offers the option to display spectra with their model fits, and to search spectra based on a variety of parameters (e.g., observing program, redshift, and coordinates). These searches can be saved as permalinks, so that they can be consulted again in the future and can be shared with collaborators. All SAW webapps are available from https://dr17.sdss.org/, and allow for displaying and searching of images (SDSS-I/II), optical single-fiber spectra (SDSS-I/II, SEGUE, BOSS, and eBOSS), infrared spectra (APOGEE-1 and APOGEE-2), and MaStar stellar library spectra. Images and spectra can be downloaded through the SAW, and previous data releases are available back to DR8. The SAW also offers direct links to SkyServer Explore pages (see below).
The MaNGA integral-field data is not incorporated in the SAW due to its more complex data structure, and can instead be accessed through Marvin (https://dr17.sdss.org/marvin/; Cherinka et al. 2019). Marvin not only offers visualization options through its web interface but also allows the user to query the data and analyze the data products remotely through a suite of Python tools. Marvin also offers access to various MaNGA VACs, as described in Section 5.5. Marvin's Python tools are available through pip-install, and installation instructions as well as tutorials and examples are available here: https://sdss-marvin.readthedocs.io/en/stable/. No installation is required to use Marvin's Python tools in SciServer, as described later in this section and in Section 5.3.
Catalogs of derived data products are available on the SAS, but can be accessed more directly through the Catalog Archive Server (CAS; Thakar et al. 2008). These include photometric and spectroscopic properties, as well as some VACs. The SkyServer webapp (https://skyserver.sdss.org) allows for visual inspection of objects using, e.g., the QuickLook and Explore tools, and is also suitable for synchronous SQL queries in the browser. Tutorials and examples explaining the SQL syntax and how to query in SkyServer are available at http://skyserver.sdss.org/en/help/docs/docshome.aspx. For DR17, the SkyServer underwent a significant upgrade, which includes a completely redesigned user interface as well as migration of the back end to a platform independent, modular architecture. Although SkyServer is optimal for smaller queries that can run in the browser, for larger ones, we recommend using CASJobs (https://skyserver.sdss.org/casjobs). CASJobs allows for asynchronous queries in batch mode, and offers the user free storage space for query results in a personal database (MyDB) for server-side analysis that minimizes data movement (Li & Thakar 2008).
SkyServer and CASJobs are now part of the SciServer science platform (Taghizadeh-Popp et al. 2020; https://www.sciserver.org), which is accessible with free registration on a single-sign-on portal, and offers server-side analysis with Jupyter notebooks in both interactive and batch mode, via SciServer Compute. SciServer is fully integrated with the CAS, and users will be able to access the data and store their notebooks in their personal account (shared with CASJobs). SciServer offers data and resource sharing via its Groups functionality that greatly facilitates its use in the classroom, to organize classes with student, teacher, and teaching assistant privileges. Several SciServer Jupyter notebooks with use cases of SDSS data are available through the SDSS education webpages (https://www.sdss.org/education/), some of which have been used by SDSS members in college-level-based courses as an introduction to working with astronomical data. SciServer has prominently featured in the "SDSS in the Classroom" workshops at AAS meetings.
Users can now analyze the MaNGA DR17 data in SciServer, using the Marvin suite of Python tools. SciServer integration enables users to use the access and analysis capabilities of Marvin without having a local installation. In the SciServer Compute system, 155 the MaNGA data set is available as an attachable MaNGA data volume, with the Marvin toolkit available as a loadable Marvin compute image. Once loaded, the Marvin package along with a set of Marvin Jupyter example notebooks and tutorials are available on the compute platform.
With DR17, we are also releasing in SciServer a new feature called SpecDash (Taghizadeh-Popp 2021) to interactively analyze and visualize one-dimensional optical spectra from SDSS Legacy and eBOSS surveys, and soon from APOGEE as well. SpecDash is available both as a stand-alone website 156 and as a Jupyter notebook widget in SciServer.
Users can load and compare multiple spectra at the same time, smooth them with several kernels, overlay error bars, spectral masks, and lines, and show individual exposure frames, sky background, and model spectra. For analysis and modeling, spectral regions can be interactively selected for fitting the continuum or spectral lines with several predefined models. All spectra and models shown in SpecDash can be downloaded, shared, and then uploaded again for subsequent analysis and reproducibility. Although the web-based version shares the same functionality as the Jupyter widget version, the latter has the advantage that users can use the SpecDash Python library to programmatically load any kind of 1D spectra, and analyze or model them using their own models and kernels.
All tools and data access points described above are designed to serve a wide range of users from undergraduate level to expert users with significant programming experience. In addition, Voyages 157 provides an introduction to astronomical concepts and the SDSS data for less experienced users, and can also be used by teachers in a classroom setting. The Voyages activities were specifically developed around pointers to K–12 US science standards, and a Spanish language version of the site is available at https://voyages.sdss.org/es/.
4. APOGEE-2: Full Release
The central goal of APOGEE is to map the chemodynamics of all the structural components of the the Milky Way via near-twin, multiplexed NIR high-resolution spectrographs operating simultaneously in both hemispheres (APOGEE-N and APOGEE-S spectrographs respectively; both described in Wilson et al. 2019). DR17 constitutes the sixth release of data from APOGEE, which has run in two phases (APOGEE-1 and APOGEE-2) spanning both SDSS-III and SDSS-IV. As part of SDSS-III, the APOGEE-1 survey operated for approximately 3 yr from 2011 August to 2014 July using the 2.5 m Sloan Foundation Telescope at APO. At the start of of SDSS-IV, APOGEE-2 continued its operations in the northern hemisphere by initiating a ∼6 yr survey (APOGEE-2N). Thanks to unanticipated on-sky efficiency, APOGEE-2N operations concluded in 2020 November with an effective ∼7.5 yr of bright-time observations, with many programs expanded from their original 6 yr baseline. In 2017 April, operations began with the newly built APOGEE-S spectrograph and associated fiber plugplate infrastructure on the 2.5 m Irénée du Pont Telescope at LCO; APOGEE-2S observations concluded in 2021 January. A full overview of the APOGEE-1 scientific portfolio and operations was given in Majewski et al. (2017), and a parallel overview for APOGEE-2 is forthcoming (S. Majewski et al. 2022, in preparation).
The APOGEE data in DR17 encompass all SDSS-III APOGEE-1 and SDSS-IV APOGEE-2 observations acquired with both instruments from the start of operations at APO in SDSS-III (2011 September) through the conclusion of SDSS-IV operations at APO and LCO (in 2020 November and 2021 January, respectively). Compared to the previous APOGEE data release (DR16), DR17 contains roughly two additional years of observations in both hemispheres; this doubles the number of targets observed from APOGEE-2S (see Table 1).
DR17 contains APOGEE data and information for 657,135 unique targets, with 372,458 of these (57%) as part of the main red star sample that uses a simple selection function based on dereddened colors and magnitudes (for more details, see Zasowski et al. 2013, 2017). The primary data products are as follows: (1) reduced-visit and visit-combined spectra, (2) radial-velocity measurements, (3) atmospheric parameters (eight in total), and (4) individual element abundances (up to 20 species). Approximately 2.6 million individual visit-spectra are included in DR17; 399,505 sources have three or more visits (54%), and 35,009 sources (5%) have ten or more visits.
The final APOGEE survey map is shown in Figure 2, where each circle represents a single field that is color-coded by survey phase: APOGEE-1 (cyan), APOGEE-2N (blue), or APOGEE-2S (red). The difference in field of view (FOV) between APOGEE-N and APOGEE-S is visible by the size of the symbol, with each APOGEE-S field spanning 2.8 deg2 and APOGEE-N spanning 7 deg2 (for the instrument descriptions, see Wilson et al. 2019). Those fields with any new data in DR17 are encircled in black; the new data can be either fields observed for the first time or fields receiving additional epochs. The irregular high Galactic-latitude coverage is largely due to piggyback co-observing with MaNGA during dark time. Notably, these cooperative operations resulted in observations of an additional 162,817 targets, or 22% of the total DR17 targets (∼30% of targets in APOGEE-2), which is a comparable number of targets as were observed in all of APOGEE-1.
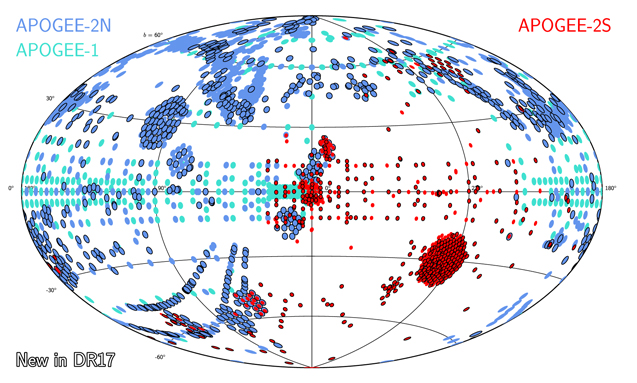
Figure 2. The DR17 final APOGEE sky coverage shown in Galactic coordinates with fields color-coded by the survey phase in which the field was observed: APOGEE-1 (cyan), APOGEE-2N (blue), and APOGEE-2S (red). The fiber plugplates used with the APOGEE-N spectrograph have a 7 square degree field of view while those used with the APOGEE-S spectrograph have a 2.8 square degree field of view. Those fields with any new observations in DR17 are highlighted with a black outline.
Download figure:
Standard image High-resolution imageA different visualization of the final field plan is given in Figure 3, where now each field is color-coded by the number of unique stars targeted in each field. APOGEE plates have 300 fibers, but APOGEE targeting uses a cohorting strategy by which exposure is accumulated over many visits for the faintest targets in a field, while brighter targets are swapped in and out over time (for a schematic see Zasowski et al. 2013, Figure 1 therein). Moreover, some fields were included in multiple programs, like those in the Kepler footprint, and as many as 1600 unique targets were accommodated in a single 7 deg2 APOGEE-2N field over the full span of the APOGEE-1 and APOGEE-2 observing programs.
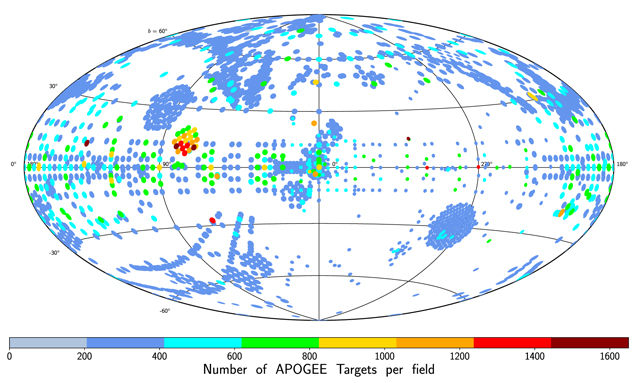
Figure 3. A sky map in Galactic coordinates showing the number of stars per APOGEE field. The disk is targeted with a more or less systematic grid of pointings within ∣b∣ < 15 deg. For ℓ < 30 deg, there is more dense coverage of the bulge and inner Galaxy. The circle sizes reflect the different field of view of APOGEE-N and APOGEE-S. The dense coverage at the North Galactic Cap is due to co-observing with the MaNGA survey, which contributed 22% of the targets in DR17.
Download figure:
Standard image High-resolution imageExtensive descriptions of the target selection and strategy are found in Zasowski et al. (2013) for APOGEE-1 and in Zasowski et al. (2017) for APOGEE-2. Details about the final target selection schemes used for APOGEE-2N and APOGEE-2S, which evolved over time, are presented in Beaton et al. (2021) and Santana et al. (2021), respectively.
4.1. DR17 Sample Highlights
DR17 represents the culmination of the APOGEE-2 program (and, indeed, all of APOGEE) and presents a number of large, focused subsamples that are worth noting briefly. DR17 contains over 18,000 targets in the TESS Northern Continuous Viewing Zone (CVZ) and over 35,000 targets in the TESS Southern CVZ (Ricker et al. 2016). In DR17, there are over 35,000 targets that are part of 13 of the Kepler K2 Campaigns and over 20,000 in the primary Kepler field. In total, over 100,000 targets are also found in high-cadence, space-based photometry programs. Among all scientific targeting programs, there are more than 13,000 targets that have more than 18 individual epochs, spanning all parts of the Galaxy.
DR17 includes extensive APOGEE coverage for numerous star clusters, including 29 open clusters, 35 globular clusters (GCs), and 18 young clusters. However, detailed membership characterization identifies at least one possible member in as many as 126 open clusters and 48 GCs, after accounting for targets in the contributed and ancillary science programs (N. Myers et al. 2022, in preparation; R. Schiavon et al. 2022, in preparation). Thus, some observations exist in DR17 for approximately 200 star clusters spanning a range of ages and physical properties.
In addition, DR17 contains measurements of resolved stars from ten dwarf satellite galaxies of the Milky Way (including the dwarf spheroidal systems Boötes I, Sextans, Carina, Fornax, Sculptor, Sagittarius, Draco, and Ursa Minor, as well as the Large and Small Magellanic Clouds); 14,000 of the over 20,000 targets toward dwarf satellites are in the Magellanic System. In addition, DR17 contains integrated light observations of star clusters in Fornax, M31, and M33 and of the central regions of M31 and of its highest-surface brightness dwarf satellites.
4.2. APOGEE DR17 Data Products
The basic procedure for the processing and analysis of APOGEE data is similar to that from previous data releases (Abolfathi et al. 2018; Holtzman et al. 2018; Jönsson et al. 2020), but a few notable differences are highlighted here. More details are presented in J. Holtzman et al. (2022, in preparation).
4.2.1. Spectral Reduction and Radial-velocity Determinations
Nidever et al. (2015) describe the original reduction procedure for APOGEE data, and the various APOGEE Data Release papers present updates (Abolfathi et al. 2018; Holtzman et al. 2018; Jönsson et al. 2020; J. Holtzman et al. 2022, in preparation). For DR17, at the visit reduction level, a small change was made to the criteria by which pixels are flagged as being potentially affected by poor sky subtraction.
The routines for the combination of the individual visit-spectra were rewritten for DR17 to incorporate a new radial-velocity analysis, called Doppler (Nidever et al. 2021). Doppler performs a least squares fit to a set of visit-spectra, solving simultaneously for basic stellar parameters (Teff,  , and [M/H]) and the radial velocity (RV) for each visit. The fitting is accomplished by using a series of Cannon (Ness et al. 2015; Casey et al. 2016) models to generate spectra for arbitrary choices of stellar parameters across the Hertzsprung-Russell diagram (from 3500 K to 20,000 K in Teff); the Cannon models were trained on a grid of spectra produced using Synspec (e.g., Hubeny & Lanz 2017; Hubeny et al. 2021) with Kurucz model atmospheres (Kurucz 1979; Castelli & Kurucz 2003; Munari et al. 2005). The primary outputs of Doppler are the RVs; while the stellar parameters from Doppler are stored, they are not adopted as the final values (see "ASPCAP," Section 4.2.2 below). The Doppler routine produces slightly better results for RVs in most cases, as judged by scatter across repeated visits of stars. Details will be given in J. Holtzman et al. (2022, in preparation), but, for example, for ∼85,000 stars that have more than three visits, VSCATTER< 1 km s−1, TEFF< 6000 K, and no additional data since DR17; the median VSCATTER is reduced from 128 to 96 m s−1.
In addition to the new methodology, the RVs for faint stars were improved. This was accomplished by making an initial combination of the visit-spectra using only the barycentric correction. This initial combination provided a combined spectrum from which an RV was determined. The RV for each individual visit was then determined separately, but was required to be within 50 km s−1 of the original estimate. This yielded a higher fraction of successful RVs for faint stars, as judged by looking at targets in the nearby dwarf spheroidal galaxies.
4.2.2. Atmospheric Parameter and Element Abundance Derivations
Stellar parameters and abundances are determined using the APOGEE Stellar Parameters and Chemical Abundance Pipeline (ASPCAP; García Pérez et al. 2016) that relies on the FERRE optimization code (Allende Prieto et al. 2006). 158
The basic methodology of ASPCAP remained the same for DR17 as in previous releases, but new synthetic spectral grids were created. These took advantage of the new, non-local thermodynamic equilibrium (NLTE) population calculations by Osorio et al. (2020) for four elements: Na, Mg, K, and Ca; as discussed in Osorio et al. (2020), the H-band abundance differences between LTE and NLTE were always less than 0.1 dex. Adopting these calculations, however, required the adoption of a different spectral synthesis code from that used in the last several APOGEE data releases: for DR17, the Synspec code (e.g., Hubeny & Lanz 2017; Hubeny et al. 2021) was adopted for the primary analysis instead of the Turbospectrum code (Alvarez & Plez 1998; Plez 2012) used in previous releases. This was not a straightforward choice because, while Synspec allows the NLTE levels to be used, it calculates the synthetic spectra under the assumption of plane parallel geometry, which becomes less valid for the largest giant stars. On the other hand, the Turbospectrum can use spherical geometry, but does not accommodate NLTE populations to be specified.
DR17 uses multiple subgrids to span from Teff = 3000 K (M dwarf) to Teff = 20,000 K (BA), with  ranges from 0 to 5 (3 to 5 for the BA grid). The full details of these grids and the reliability of the parameters as a function of stellar type are provided in J. Holtzman et al. (2022, in preparation). Modifications to the linelists used for the syntheses are described in Smith et al. (2021), which is an augmentation to prior linelist work for APOGEE (Shetrone et al. 2015; Hasselquist et al. 2016; Cunha et al. 2017).
The ASPCAP results from the new Synspec grid are the primary APOGEE DR17 results, and the majority of users will likely be satisfied with the results in this catalog; only this primary catalog will be loaded into the CAS. However, unlike prior releases, DR17 also includes supplemental analyses constructed using alternate libraries that have different underlying physical assumptions. The different analyses in DR17 are provided in separate summary files and include the following:
- 1.the primary library using Synspec including NLTE calculations for Na, Mg, K, and Ca (with files on the SAS under dr17/synspec_rev1); 159
- 2.one created using Synspec, but assuming LTE for all elements (files under dr17/synspec_lte);
- 3.another created using Turbospectrum 20 (files under dr17/turbo20), using spherical geometry for
 ;
; - 4.one created with Turbospectrum, but with plane parallel geometry (files under dr17/turbo20_pp) for all stars.

All of the libraries use the same underlying MARCS stellar atmospheres for stars with Teff < 8000 K, computed with spherical geometry for  . A full description of these spectral grids will be presented in J. Holtzman et al. (2022, in preparation), and a focused discussion on the differences between the libraries and the physical implications will be presented in Y. Osorio et al. (2022, in preparation). In summary, however, the differences are subtle in most cases. We encourage those using the APOGEE DR17 results to clearly specify the catalog version that they are using in their analyses.
160
. A full description of these spectral grids will be presented in J. Holtzman et al. (2022, in preparation), and a focused discussion on the differences between the libraries and the physical implications will be presented in Y. Osorio et al. (2022, in preparation). In summary, however, the differences are subtle in most cases. We encourage those using the APOGEE DR17 results to clearly specify the catalog version that they are using in their analyses.
160
For DR17, we present 20 elemental abundances: C, C i, N, O, Na, Mg, Al, Si, S, K, Ca, Ti, Ti ii, V, Cr, Mn, Fe, Co, Ni, and Ce. In DR16, we attempted to measure the abundances of Ge, Rb, and Yb, but given the poor results for extremely weak lines, we did not attempt these in DR17. While we attempted measurements of P, Cu, Nd, and 13C in DR17, these were judged to be unsuccessful. Overall, the spectral windows used to measure the abundances were largely unchanged, but several additional windows were added for cerium, such that the results for Ce appear to be significantly improved over those in DR16.
As in DR16, both the raw spectroscopic stellar parameters as well as the calibrated parameters and abundances are provided. Calibrated-effective temperatures are determined by a comparison to photometric-effective temperatures, as determined from the relations of González Hernández & Bonifacio (2009), using stars with low reddening. Calibrated surface gravities are provided by comparison to a set of surface gravities from asteroseismology (Serenelli et al. 2017; M. Pinsonneault et al. 2022, in preparation) and isochrones (Berger et al. 2020). For DR17, the surface gravity calibration was applied using a neural network, unlike previous data releases where separate calibrations were derived and applied for different groups (red giants, red clump, and main sequence) of stars. The new approach eliminates small discontinuities that were previously apparent, and is described in more detail in J. Holtzman et al. (2022, in preparation). For the elemental abundances, calibration just consists of a zero-point offset (separately for dwarfs and giants), determined by setting the median abundance [X/M] of solar metallicity stars in the solar neighborhood with thin disk kinematics such that [X/M] = 0.
Additional details on the ASPCAP changes are described in J. Holtzman et al. (2022, in preparation).
4.2.3. Additional Data
Several other modifications were made for DR17.
- 1.The summary data files for APOGEE that are available on the SAS now include data from the Gaia Early Data Release 3 (EDR3) for the APOGEE targets (Gaia Collaboration et al. 2016, 2021). Positional matches were performed by the APOGEE team. More specifically, the following data are included:
- (a)Gaia EDR3 identifiers (Gaia Collaboration et al. 2021),
- (b)Gaia EDR3 parallaxes and proper motions (Lindegren et al. 2021),
- (c)Gaia EDR3 photometry (Riello et al. 2021),
- (d)Gaia EDR3 radial-velocity (RV) measurements (Seabroke et al. 2021),
- (e)Distances and uncertainties following Bailer-Jones et al. (2021).
- 2.Likely membership for a set of open clusters, GCs, and dwarf spheroidal galaxies, as determined from position, RV, proper motion, and distance, is provided in a MEMBERS column. More specifically, initial memberships were computed based on position and the literature RVs, and these are then used to determine the proper-motion (PM) and distance criteria. Literature RVs were taken from the following:
- (a)APOGEE-based mean RVs for the well-sampled "calibration clusters" in Holtzman et al. (2018),
- (b)
- (c)mean RVs for dwarf spheroidal galaxies from McConnachie (2012).
- 3.Some spectroscopic binary identification is provided through bits in the STARFLAG and ASPCAPFLAG bitmasks. A more comprehensive analysis of spectroscopic binaries is provided in a VAC (see Section 4.4.1 below).
We encourage those utilizing these data in our summary catalogs to cite the original references as given above.
4.3. Data Quality
The overall quality of the DR17 results for RVs, stellar parameters, and chemical abundances is similar to that of previous APOGEE data releases (full evaluation will be provided in J. Holtzman et al. 2022, in preparation). 162 As in DR16, uncertainties for stellar parameters and abundances are estimated by analyzing the scatter in repeat observations of a set of targets.
Users should be aware that deriving consistent abundances across a wide range of parameter space is challenging, so some systematic features and trends arise. Users should be careful when comparing abundances of stars with significantly different stellar parameters. Also, the quality of the abundance measurements varies between different elements, across parameter space, and with signal-to-noise ratio (S/N).
Some regions of parameter space present larger challenges than others. In particular, it is challenging to model the spectra of the coolest stars and, while abundances are derived for the coolest stars in DR17, there seem to be significant systematic issues for the dwarfs with Teff < 3500 K, such that, although we provide calibrated results in the PARAM array, we do not populate the "named tags." Separately, for warm/hot stars (Teff > 7000), information on many abundances is lacking in the spectra, and uncertainties in the model grids at these temperatures may lead to systematic issues with the DR17 stellar parameters.
As a demonstration of the quality and scientific potential of the data, Figure 4 shows a set of [Mg/Fe] versus [Fe/H] diagrams for different three-dimensional spatial zones within the disk of the Milky Way, restricted to giant stars with 1 <  < 2.5 to minimize potential systematics or sampling bias. Spectrophotometric distances to individual stars are determined from VACs
163
and then are used with stellar positions to determine the Galactocentric radius (RG
) and height above the plane (z) for each individual star; this highlights the scientific potential enabled via the analyses in the VACs. The color-coding indicates the orbital eccentricity based on calculations from GalPy (Bovy 2015) using Gaia EDR3 proper motions (Gaia Collaboration et al. 2021) and APOGEE DR17 RVs. Figure 4 is a merging of the similar visualizations previously presented in Hayden et al. (2015) and Mackereth et al. (2019b), such that the spatial zones of the former are merged with the dynamical inference of the latter. The stars of the solar neighborhood (middle panel, 7 < RG
< 9) show two distinct chemical sequences, commonly referred to as the low- and high- [α/Fe] sequences that are also somewhat dynamically distinct (apparent in the color-coding by orbital eccentricity). The inner Galaxy, however, is dominated by high-eccentricity (bulge-like orbits) stars on the high-[α/Fe] sequence just as the outer galaxy is dominated by low-eccentricity (near circular orbits) stars on the low-[α/Fe] sequence, with some slight dependence on z. The relative contributions of low-eccentricity versus high-eccentricity and low-[α/Fe] versus high-[α/Fe] sequences shift throughout the Galaxy. These spatial, chemical, and dynamical groupings provide evidence for various disk-formation and disk-evolution scenarios (e.g., as discussed in Hayden et al. 2015; Mackereth et al. 2019b, among others) that add complexity and nuance to the canonical schemes.
< 2.5 to minimize potential systematics or sampling bias. Spectrophotometric distances to individual stars are determined from VACs
163
and then are used with stellar positions to determine the Galactocentric radius (RG
) and height above the plane (z) for each individual star; this highlights the scientific potential enabled via the analyses in the VACs. The color-coding indicates the orbital eccentricity based on calculations from GalPy (Bovy 2015) using Gaia EDR3 proper motions (Gaia Collaboration et al. 2021) and APOGEE DR17 RVs. Figure 4 is a merging of the similar visualizations previously presented in Hayden et al. (2015) and Mackereth et al. (2019b), such that the spatial zones of the former are merged with the dynamical inference of the latter. The stars of the solar neighborhood (middle panel, 7 < RG
< 9) show two distinct chemical sequences, commonly referred to as the low- and high- [α/Fe] sequences that are also somewhat dynamically distinct (apparent in the color-coding by orbital eccentricity). The inner Galaxy, however, is dominated by high-eccentricity (bulge-like orbits) stars on the high-[α/Fe] sequence just as the outer galaxy is dominated by low-eccentricity (near circular orbits) stars on the low-[α/Fe] sequence, with some slight dependence on z. The relative contributions of low-eccentricity versus high-eccentricity and low-[α/Fe] versus high-[α/Fe] sequences shift throughout the Galaxy. These spatial, chemical, and dynamical groupings provide evidence for various disk-formation and disk-evolution scenarios (e.g., as discussed in Hayden et al. 2015; Mackereth et al. 2019b, among others) that add complexity and nuance to the canonical schemes.
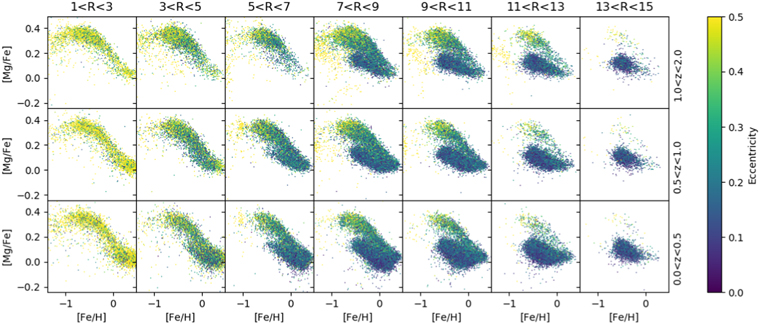
Figure 4. A series of [Mg/Fe] vs. [Fe/H] plots from APOGEE DR17 for different zones in the Milky Way. Distances from the DistMass VAC are used to determine Galactocentric radius (RG ) and height above the plane (z). Points are color-coded by orbital eccentricities as computed with GalPy (Bovy 2015) using Gaia EDR3 proper motions and APOGEE RVs.
Download figure:
Standard image High-resolution image4.4. APOGEE Value-added Catalogs
There are a large number of APOGEE-associated VACs in DR17. In what follows, we provide brief descriptions of each VAC along with references where the reader can find more detail. Broadly speaking, APOGEE VACs can be split into characterizing special subsamples, like binary stars, open clusters, and photometric variables, those that calculate stellar or orbital parameters for all (or most) of the APOGEE target stars (e.g., Starhorse, APOGEEnet, and others). We also document the release of a mock catalog of APOGEE based on a hydrodynamical simulation.
4.4.1. VACs Describing Categories of Objects in APOGEE
The first set of APOGEE VACs describes special categories of objects in APOGEE data and in most cases provides additional information/characteristics for these objects. They are as follows:
- 1.Open Cluster Chemical Abundances and Mapping Catalog (OCCAM): The goal of OCCAM is to leverage the APOGEE survey to create a large, uniform catalog of open cluster chemical abundances and use these clusters to study Galactic-chemical evolution. The catalog contains the average chemical abundances for each cluster and the membership probability estimates for APOGEE stars in the cluster area. We combine PM and RV measurements from Gaia EDR3 (Gaia Collaboration et al. 2021) with RV and metallicity measurements from APOGEE to establish the cluster membership probabilities for each star observed by APOGEE. The VAC includes 26,699 stars in the areas of 153 cataloged disk clusters. Detailed descriptions of the OCCAM survey, including targeting and the methodology for membership determinations, are presented in Frinchaboy et al. (2013), Donor et al. (2018), and Donor et al. (2020). This third catalog from the OCCAM survey includes 44 new open clusters, including many in the southern hemisphere and those targeted specifically in GC-size (RGC ) ranges with little coverage in the DR16 catalog (specific targeting described in Beaton et al. 2021; Santana et al. 2021). Average RV, PM, and abundances for reliable ASPCAP elements are provided for each cluster, along with the visual quality determination. Membership probabilities based individually upon PM, RV, and [Fe/H] are provided for each star; stars are considered 3σ members if they have probability >0.01 in all three membership dimensions. 164 The results and caveats from this VAC will be discussed thoroughly in N. Myers et al. (2022, in preparation).
- 2.APOGEE Red-clump (RC) Catalog: DR17 contains an updated version of the APOGEE red-clump (APOGEE-RC) catalog. This catalog is created in the same way as the previous DR14 and DR16 versions of the catalog, with a more stringent cut compared to the original version of the catalog (Bovy et al. 2014). The catalog contains 50,837 unique stars, about 30% more than in DR16. The catalog is created using the spectrophotometric technique first presented in Bovy et al. (2014) that results in a rather pure sample of red-clump stars (e.g., minimal contamination from red-giant-branch, secondary-red-clump, and asymptotic-giant-branch stars that have similar CMD and H-R positions). Bovy et al. (2014) estimated a purity of ∼95%. The narrowness of the RC locus in color-metallicity-luminosity space allows distances to the stars to be assigned with an accuracy of 5%–10%, which exceeds the precision of spectrophotometric distances in other parts of the H-R diagram. We recommend users adopt the most recent catalog (DR17) for their analyses; additional discussion on how to use the catalog is given in Bovy et al. (2014). While the overall data model is similar to previous versions of the catalog, the proper motions are from Gaia EDR3 (Gaia Collaboration et al. 2021; Lindegren et al. 2021).
- 3.APOGEE-Joker: The APOGEE-Joker VAC contains posterior samples for the binary-star orbital parameters (Keplerian orbital elements) for 358,350 sources with three or more APOGEE visit-spectra that pass a set of quality cuts as described in A. Price-Whelan et al. (2022, in preparation). The posterior samples are generated using The Joker, a custom Monte Carlo sampler designed to handle the multi-modal likelihood functions that arise when inferring orbital parameters with sparsely sampled or noisy RV time data (Price-Whelan et al. 2017). This VAC deprecates the previous iterations of the catalog (Price-Whelan et al. 2018, 2020). For 2819 stars, the orbital parameters are well constrained, and the returned samples are effectively unimodal in period. For these cases, we use the sample(s) returned from The Joker to initialize standard MCMC sampling of the Keplerian parameters using the time-series optimized MCMC code known as exoplanet 165 (Foreman-Mackey et al. 2021) and provide these MCMC samples. For all stars, we provide a catalog containing metadata about the samplings, such as the maximum a posteriori (MAP) parameter values and sample statistics for the MAP sample. A. Price-Whelan et al. (2022, in preparation) describe the data analysis procedure in more detail, and define and analyze a catalog of ≳40,000 binary-star systems selected using the raw orbital parameter samples released in this VAC.
- 4.Double-lined Spectroscopic Binaries in APOGEE Spectra: Generally, APOGEE fibers capture a spectrum of single stars. Sometimes, however, there may be multiple stars of comparable brightness with the sky separations closer than the fiber radius whose individual spectra are captured by the same recorded spectrum. Most often, these stars are double-lined spectroscopic binaries (SBs) or higher-order multiples, but on an occasion they may also be chance line-of-sight alignments of random field stars (most often observed toward the Galactic center). Through analyzing the cross-correlation function (CCF) of the APOGEE spectra, Kounkel et al. (2021) have developed a routine to automatically identify these SBs using Gaussian deconvolution of the CCFs (Kounkel 2021), 166 and to measure RVs of the individual stars. The catalog of these sources and the subcomponent RVs are presented here as a VAC. For the subset of sources that had a sufficient number of measurements to fully characterize the motion of both stars, the orbit is also constructed. The data obtained though 2020 April/May were processed with the DR16 version of the APOGEE RV pipeline, and this processing was made available internally to the collaboration as an intermediate data release. All of the SBs identified in this internal data release have undergone rigorous visual vetting to ensure that every component that can be detected is included and that spurious detections have been removed. However, the final DR17 RV pipeline is distinct from that used for DR16 (summarized above; J. Holtzman et al. 2022, in preparation), and the reductions are sufficiently different that they introduce minor discrepancies within the catalog. In comparison to DR16, the DR17 pipeline limits the span of the CCF for some stars to a velocity range around the mean RV to ensure a more stable overall set of RV measurements; on the other hand, the DR16 pipeline itself may fail on a larger number of individual visit-spectra and thus not produce a full set of outputs. For the sources that have both good parameters and a complete CCF coverage for both DR16 and DR17, the widely resolved components of SBs are generally consistent with one another; close companions that have only small RV separations are not always identified in both data sets. For this reason, SBs that could be identified in both the DR16 and DR17 reductions are kept as separate entries in the catalog. Visual vetting was limited only to the data processed with the DR16 pipeline (e.g., data through 2020 April/May); the full automatic deconvolutions of the DR17 CCFs are presented as-is.

4.4.2. VACs of Distances and Other Parameters
VACs providing distances and other properties (mostly related to orbital parameters) are released (or rereleased) as follows:
- 1.StarHorse Distances, Extinctions, and Stellar Parameters for APOGEE DR17 + Gaia EDR3: We combine the high-resolution spectroscopic data from APOGEE DR17 with the broadband photometric data from 2MASS, unWISE, and PanSTARRS-1, as well as the parallaxes from Gaia EDR3. Using the Bayesian isochrone-fitting code StarHorse (Santiago et al. 2016; Queiroz et al. 2018), we derive distances, extinctions, and astrophysical parameters. We achieve typical distance uncertainties of ∼5% and extinction uncertainties in V-band amount to ∼0.05 mag for stars with available PanSTARRS-1 photometry, and ∼0.17 mag for stars with only infrared photometry. The estimated StarHorse parameters are robust to the changes in the Galactic priors assumed and the corrections for Gaia parallax zero-point offset. This work represents an update of DR16-based results presented in Queiroz et al. (2020).
- 2.APOGEE- astroNN : The APOGEE-astroNN VAC holds the results from applying the astroNN deep-learning code to APOGEE spectra to determine the stellar parameters, individual stellar abundances (Leung & Bovy 2019a), distances (Leung & Bovy 2019b), and ages (Mackereth et al. 2019a). For DR17, we have retrained all of the neural networks using the latest data, i.e., APOGEE DR17 results for the abundances, Gaia EDR3 parallax measurements, and an intermediate APOKASC data set with stellar ages (v6.6.1, 2020 March using DR16 ASPCAP). Additionally, we augmented the APOKASC age data with the low-metallicity asteroseismic ages from Montalbán et al. (2021) to improve the accuracy of ages at low metallicities; the Montalbán et al. (2021) analysis is similar to that of APOKASC, but performed by an independent team. As in DR16, we correct for the systematic differences between spectra taken at LCO and APO by applying the median difference between stars observed at both observatories. In addition to abundances, distances, and ages, properties of the orbits in the Milky Way (and their uncertainties) for all stars are computed using the fast method of Mackereth & Bovy (2018) assuming the MWPotential2014 gravitational potential from Bovy (2015). Typical uncertainties in the parameters are 35 K in Teff, 0.1 dex in, 0.05 dex in elemental abundances, 5% in distance, and 30% in age. Orbital properties such as the eccentricity, maximum height above the mid-plane, radial, and vertical action are typically precise to 4%–8%.

4.4.3. APOGEE Net: A Unified Spectral Model
A number of different pipelines are available for extracting spectral parameters from the APOGEE spectra. These pipelines generally manage to achieve optimal performance for red giants and, increasingly, G and K dwarfs, which compose the bulk of the stars in the catalog. However, the APOGEE2 catalog contains a number of parameter spaces that are often not well characterized by the primary pipelines. Such parameter spaces include pre-main-sequence stars and low-mass stars, with their measured parameters showing systematic Teff and  deviations making them inconsistent from the isochrones and the main sequence. OBA stars are also less well constrained and in prior data releases many were classified as F dwarfs (due to grid-edge effects) and have their Teff underestimated in the formal results. By using data-driven techniques, we attempt to fill in those gaps to construct a unified model of APOGEE spectra. In the past, we have developed a neural network, APOGEE Net (Olney et al. 2020), which was shown to perform well to extract Teff,
  , and [Fe/H] on all stars with Teff < 6500 K, including pre-main-sequence stars. We now expand these efforts to also characterize hotter stars with 6500 < Teff < 50,000 K. APOGEE NET II is described in Sprague et al. (2022).
4.4.4. APOGEE FIRE VAC
Mock catalogs made by making simulated observations of sophisticated galaxy simulations provide unique opportunities for observational projects, in particular, the ability to test for or constrain the impact of selection functions, field plans, and algorithms on scientific inferences. One of the most realistic galaxy simulations to date is the Latte simulation suite, which uses FIRE-2 (Hopkins et al. 2018) to produce galaxies in Milky Way mass halos in a cosmological framework (Wetzel et al. 2016). Sanderson et al. (2020) translated three of the simulations into realistic mock catalogs (using three solar locations, resulting in nine catalogs), known as the Ananke simulations. 167 Ananke contains key Gaia measureables for the star particles in the simulations, and these include RV, proper motion, parallax, and photometry in the Gaia bands as well as chemistry (10 chemical elements are tracked in the simulation), and other stellar properties. Because the input physics and the global structure of the model galaxy are known, these mock catalogs provide an experimental laboratory to make connections between the resolved stellar populations and global galaxy studies.
In this VAC, Ananke is expanded to permit APOGEE-style sampling of the mock catalogs. For all observed quantities, both the intrinsic, e.g., error-free, and the observed values are reported; the observed values are the intrinsic values convolved with an error-model derived from observational data for similar object types. As described in Nikakhtar et al. (2021), Ananke mock catalogs now contain the following: (i) 2MASS (JHKs ) photometry and reddening, (ii) abundance uncertainties following APOGEE DR16 performance (following Jönsson et al. 2020; Poovelil et al. 2020), and (iii) a column that applies a basic survey map (Zasowski et al. 2013, 2017; Beaton et al. 2021; Santana et al. 2021). The full mock catalogs are released such that users can impose their own selection functions to construct mock APOGEE surveys in the simulation. Mock-surveys can then be used to test the performance of methods and algorithms to recover the true underlying galactic physics as demonstrated in Nikakhtar et al. (2021).
5. MaNGA: Full Release of Final Sample
The MaNGA survey (Bundy et al. 2015) uses a custom-built set of hexagonal integral-field unit (IFU) fiber bundles (Drory et al. 2015) to feed spectroscopic fibers into the BOSS spectrograph (Smee et al. 2013). Over its operational lifetime, MaNGA has successfully met its goal of obtaining integral-field spectroscopy for ∼10,000 nearby galaxies (Law et al. 2015; Yan et al. 2016a) at redshift z ∼ 0.03 with a nearly flat distribution in stellar mass (Wake et al. 2017).
DR17 contains all MaNGA observations taken throughout SDSS-IV, and more than doubles the sample size of fully reduced galaxy data products previously released in DR15 (Aguado et al. 2019). These data products include raw data, intermediate reductions such as flux-calibrated spectra from individual exposures, and final calibrated data cubes and row-stacked spectra (RSS) produced using the MaNGA Data Reduction Pipeline (DRP; Law et al. 2016, 2021b; Yan et al. 2016b).
DR17 includes DRP data products (see Section 5.1) for 11,273 MaNGA cubes distributed among 674 plates. 10,296 of these data cubes are for traditional MaNGA-type galaxies, and 977 represent data cubes associated with nonstandard ancillary programs (targeting a variety of objects including GCs, faint galaxies, and intracluster light, or ICL, in the Coma cluster, background reference sky, and also tiling of the large nearby galaxies M31 and IC342; see Section 5.4 for more details). Of the 10,296 galaxy cubes, 10,145 have the highest data quality with no warning flags indicating significant issues with the data reduction process. These 10,145 data cubes correspond to 10,010 unique targets (as identified via their MANGAID) with a small number of repeat observations taken for cross-calibration purposes (each has an individual plate-ifu code, MANGAID needs to be used to identify unique galaxies). As in previous releases, DR17 also includes the release of derived spectroscopic products (e.g., stellar kinematics, emission-line diagnostic maps, etc.) from the MaNGA DAP (Belfiore et al. 2019; Westfall et al. 2019); see Section 5.2. Additionally, DR17 contains the final data release for the MaStar (Yan et al. 2019, and Section 6), a 1D spectra for 28,124 unique stars spanning a wide range of stellar types.
We illustrate the sky footprint of MaNGA galaxies released in DR17 in Figure 5, along with colored boxes indicating the locations of a selection of other galaxy surveys, namely the H i surveys Apertif (K. Hess et al. 2022, in preparation) and Arecibo Legacy Fast ALFA (ALFALFA; Haynes et al. 2018; also see Section 5.5.4 for more H i follow-up); IR surveys include Herschel-ATLAS (Smith et al. 2017), the UKIRT Infrared Deep Sky Survey (UKIDSS; Lawrence et al. 2007); and other optical surveys, like the Galaxy and Mass Assembly Survey (Liske et al. 2015), the footprint of which includes most of the SAMI-IFU observations (Croom et al. 2021; in total, 74 galaxies are observed by both MaNGA and SAMI), and Hyper Suprime-Cam (HSC; Aihara et al. 2019). In some cases, the prioritization of which MaNGA plates were observed was driven by the availability of these ancillary data (e.g., note how observed plates fill in parts of the UKIDSS footprint). MaNGA plates in an earlier projected footprint of Apertif were also prioritized, but the changes in the Apertif observation plans have significantly reduced the final overlap.

Figure 5. DR17 final MaNGA survey area; blue tiles indicate observed fields (plates), gray tiles indicate potential fields from which the MaNGA final sample was drawn. Colored boxes indicate the regions observed by a variety of other surveys as described in the text.
Download figure:
Standard image High-resolution image5.1. MaNGA Data Reduction Pipeline and Products
The MaNGA DRP has evolved substantially throughout the survey across a variety of both public (DR) and internal ("MaNGA Product Launch," or MPL) data releases. A summary of these various DRP versions and the number of unique galaxies in each is given by Law et al. (2021b, see their Table 1). These authors also provide a detailed description of the differences in the DRP for DR17 compared to previous releases. 168 In brief, changes in the DR17 data products compared to DR15 include the following:
- 1.Updated Spectral LSF: Many stages of the pipeline have been rewritten to further improve the accuracy of the LSF estimate, which is now good to better than 1%. As demonstrated by Law et al. (2021b) by comparison against observations with higher-resolution spectrographs, this allows MaNGA emission-line velocity dispersions to be reliable down to 20 km s−1 at S/N above 50, which is well below the 70 km s−1 instrumental resolution.
- 2.Multiple Pipeline Changes: Changes have affected the overall MaNGA survey flux calibration. The most significant changes included the adoption of a different extinction model for the calibration standard stars and correction for a few-percent scale error in the lab measurements of the MaNGA fiber bundle metrology using on-sky self calibrations (see Law et al. 2021b, their Appendix A).
- 3.New Data Quality Flags: New flags have been defined to better identify potential reduction problems. These include a new UNUSUAL data quality bit to identify the cubes that are different from ordinary data quality but still useful for many analyses (e.g., that may be missing a fraction of the FOV due to hardware problems). These are distinct from the previously defined CRITICAL data quality bit that indicates data with significant problems that should preclude it from most scientific analyses (<1% of the total sample).
- 4.Introduction of a New Processing Step: This involves a new step to detect and subtract bright electronic artifacts (dubbed the blowtorch). This signal arises from a persistent electronic artifact within the charge-coupled devices in one of the red cameras during the final year of survey operations (see Law et al. 2021b, their Appendix B).
5.2. MaNGA Data Analysis Pipeline and Products
In this section, we describe two specific changes to the DAP analysis between the MaNGA data released in DR15 and DR17. The first is a change in the stellar continuum templates used for the emission-line measurements; this change only affects emission-line measurements and does not affect stellar kinematic measurements. The second is the addition of new spectral index measurements that are more appropriate for stacking analyses and coaddition of spaxels; the previously existing spectral index measurements are not affected by this addition.
The MaNGA DAP as a whole is discussed extensively in the DR15 paper (Aguado et al. 2019) and in Westfall et al. (2019), Belfiore et al. (2019), and Law et al. (2021b). The last provides a summary of the other improvements made to the DAP since DR15.
The SDSS data release website (https://www.sdss.org/) provides information on data access and changes to the DAP data models in DR17 for its major output products. Further information can be found in the documentation of the code base. 169
5.2.1. Stellar Continuum Templates
In DR17, we use different spectral templates to model the galaxy continuum for emission-line measurements than we use for stellar kinematics measurements. In DR15, we used the same templates in both cases, but as discussed by Law et al. (2021b), these template sets diverged starting with our ninth internal data set (MPL-9; between DR15 and DR17). For the emission-line measurements, the new templates are based on the MaStar survey, allowing us to take advantage of the full MaNGA spectral range (3600–10000 Å) and, e.g., model the [S iii]λ λ 9071,9533 Å doublet and some of the blue Paschen lines. For the stellar kinematics measurements, we have continued to use the same templates used in DR15, the MILES-HC library, taking advantage of its modestly higher spectral resolution than MaStar. Since MILES only spans between 3575 and 7400 Å, this means MaNGA stellar kinematics do not include, e.g., contributions from the calcium NIR triplet near 8600 Å.
In DR17, we provide DAP emission-line measurements based on two different continuum template sets, both based on the MaStar Survey (Yan et al. 2019; and Section 6), and referred to as MASTARSSP and MASTARHC2. There are four different analysis approaches, indicated by DAPTYPE. Three use MASTARSSP, with three different spatial binning approaches, and the fourth uses MASTARHC2.
The template set referred to as the MASTARSSP library by the DAP are a subset of the simple-stellar-population (SSP) models provided by Maraston et al. (2020). Largely to decrease execution time, we down-selected templates from the larger library provided by Maraston et al. (2020) to only those spectra with a Salpeter initial mass function (IMF) and the following grid in SSP age and metallicity, for a total of 54 spectra:
- 1.Age/[1 Gyr] = 0.003, 0.01, 0.03, 0.1, 0.3, 1, 3, 9, 14
- 2., −1., −0.7, −0.33, 0, 0.35.

Extensive testing was done to check differences in stellar-continuum fits based on this choice; the small differences that were found are well within the limits described by Belfiore et al. (2019). Section 5.3 of Law et al. (2021a) shows further analysis, including a direct comparison of results for the BPT emission-line diagnostics plots when using either the MASTARHC2 or MASTARSSP templates, showing that the templates have a limited effect on their analysis. Importantly, note that the DAP places no constraints on how these templates can be combined (e.g., unlike methods that use the Penalized PiXel-Fitting, or pPXF; Cappellari & Emsellem 2004; Cappellari 2017, implementation of regularized weights), and the weight applied to each template is not used to construct luminosity-weighted ages or metallicities for the fitted spectra. The use of the SSP models, as opposed to the spectra of single stars, is meant only to impose a physically relevant prior on the best-fitting continua, even if minimally so compared to more sophisticated stellar-population modeling.
The template set referred to as the MASTARHC2 170 library by the DAP is a set of 65 hierarchically clustered templates based on ∼2800 MaStar spectra from MPL-10. Only one of the four DAPTYPEs provided in DR17 uses these templates; however, we note that the results based on these templates are the primary data sets used by Law et al. (2021a, 2021b) to improve the DRP (see above). The approach used to build the MASTARHC2 library is inspired by, but different in many details from, the hierarchical clustering (HC) method used to build the MILESHC library (see Westfall et al. 2019, their Section 5), as described below.
The principles of the HC approach used by Westfall et al. (2019) to construct the MILESHC library are maintained, except we perform the clustering for the MASTARHC2 library in two steps. The first step clusters spectra based on their low-order continuum differences, leading to a set of base clusters. We use pPXF (Cappellari & Emsellem 2004; Cappellari 2017) to perform a least-squares fit of each spectrum using every other spectrum; however, we do not include Gaussian kernel terms or polynomial continuum optimization, meaning the least-squares fit simply optimizes the scaling between the two spectra. We use the rms difference between the best-fit spectra as the clustering distance, and the distance matrix is used to construct eight base clusters. The choice of eight clusters was based on an a qualitative assessment of the appropriate number that separated MaStar spectra into distinct types. The second step uses pPXF to fit each spectrum using every other spectrum within its base cluster. In this step, we modestly degrade the resolution of the template being fit with σ = 1 pixel, and then our pPXF fit includes a freely fit Gaussian kernel with bounds of a ±1 pixel shift and a 0.1–2 pixel broadening. This was done in the same way across all parts of the spectra. We also include a multiplicative Legendre polynomial of order 100 to optimize the continuum match between the two templates. The very high-order fit (the choice of the exact number of 100 was arbitrary) acts like a high-pass filter on the differences between the two spectra, ensuring that the optimized rms difference between the two spectra is driven by the high-order (line) structure differences. The spectra within each base cluster are organized into template clusters and visually inspected. The visual inspection leads to iterations on the number of template clusters in each base cluster, as well as removing some of the spectra from the analysis. The number of template clusters per base cluster ranged from 6 to 16, depending on a by-eye assessment of the spectra in each template cluster. The final assignment of each MaStar spectrum (identified by its MANGAID) to a template cluster is provided in the DAP code repository. 171 Note that 34 of 99 clusters were not included in the MASTARHC2 library because they were either composed of single stars, resulted in noisy spectral stacks, contained isolated specific data-reduction artifacts, or contained a set of spectra that were considered too disparate for a single cluster. For the vetted set of 65 template clusters, the median number of spectra per cluster is 14, but the range is from 2 to more than 300.
With the assignments in hand, we combine the spectra in each template cluster as follows. We first scale each spectrum by their median flux and create an initial stack, weighting each spectrum by its median S/N. We then calculate the ratio of each spectrum to the stacked spectrum and fit this with an order-14 Legendre polynomial, which provides a low-order correction function to the continuum shape of each spectrum. The specific choice of order 14 was driven by a desire to match the choice made in the DAP fitting of galaxy spectra, which was justified in Westfall et al. (2019). We constrain the correction function to be no more than a factor of 2, which is particularly important to the stacks of late-type stars with very little flux toward the blue end of MaStar's spectral range. The low-order correction function is then applied to each spectrum in the template cluster before the final S/N-weighted stack. The error vector for each stack is the quadrature sum of the propagated error from the stacking operations and the (typically much more significant) standard deviation measured for the spectra in the stack. The final spectra in the MASTARHC2 library are shown in Figure 6.

Figure 6. Spectra in the MASTARHC2 template library. Spectra are arranged and colored according to the membership in one of eight base clusters (the first clustering step used in the process to generate the template library from individual MaStar spectra).
Download figure:
Standard image High-resolution image5.2.2. Spectral Index Measurements
In DR17, we have added spectral index measurements that are more suited to stacking analyses and coaddition of spectra among spaxels, such as those based on definitions of Burstein et al. (1984) and Faber et al. (1985). These measurements are particularly useful for low-S/N spaxels.
The motivation for this change emerges from the fact that, in DAP's hybrid binning scheme, the spectral index measurements are performed on individual spaxels, which can have a very low S/N (see Westfall et al. 2019; their Section 9). Westfall et al. (2019) recommend improving the precision of the spectral index measurements using specific aggregation calculations that closely match the results obtained by performing the measurements on stacked spectra over the same spatial regions (specifically, see their Section 10.3.3). However, the comparison between an aggregated index and an index measured using a stacked spectrum is not mathematically identical for the index definitions used by Westfall et al. (2019). Motivated by the analysis of Molina et al. (2020), the DAP calculates the spectral indices (specifically the absorption line indices) using two definitions for DR17: (1) those definitions provided by Worthey (1994) and Trager et al. (1998) and (2) earlier definitions provided by Burstein et al. (1984) and Faber et al. (1985). The advantage of the definitions provided by Burstein et al. (1984) and Faber et al. (1985) is that they allow for a mathematically rigorous aggregation of spectral indices, as we derive below.
Following the derivation by Westfall et al. (2019), we define a utility function, which is a sum of pixel values, multiplied by pixel width,
where y is usually, but not always a function describing the flux in the spectrum, f(λ), and dpi is the fraction of spectral pixel i (with width dλi ) in the passband defined by λ1 < λ < λ2. Note that masked pixels in the passband are excluded by setting dpi = 0, and S(1) = Δλ ≡ λ2 − λ1 if no pixels are masked. We can then define a linear continuum between two sidebands, referred to as the blue and red sidebands, as

where f is the spectrum flux density, λblue and λred are the wavelengths at the center of the two sidebands, and 〈f〉 = S(f)/S(1).
The absorption-line index definitions used by Worthey (1994) and Trager et al. (1998) are as follows:
where the measurements are made on a rest-wavelength spectrum. 172 Under this definition, the integration is performed over the ratio of the flux to a linear continuum, which means that the sum of, say, two index measurements is not identical to a single index measurement made using the sum of two spectra. In contrast, Burstein et al. (1984) and Faber et al. (1985) define the following:
where C0 is the value of the continuum, C(λ), at the center of the main passband. Note that, given that C(λ) is linear and assuming no pixels are masked, S(C) = C0 Δλ. Using the definition in Equation (4), we can calculate a weighted sum of indices using the value of the continuum, C0, for each index as the weight to obtain
assuming no pixels are masked such that S(1) = Δλ. That is, the weighted sum of the individual indices is mathematically identical (to within the limits of how error affects the construction of the linear continuum) to the index measured for the sum (or mean) of the individual spectra. Similarly, for the indices in magnitude units, we find the following:
Given the ease with which one can combine indices in the latter definition, we provide both  (in the SPECINDEX_BF extension of the DAP MAPS file) and C0 (in SPECINDEX_WGT) for all absorption-line indices in DR17, along with the original definitions (
 SPECINDEX) provided in DR15/DR16.
5.3. Marvin Visualization and Analysis Tools
Marvin (Cherinka et al. 2019) was developed as the tool for streamlined access to the MaNGA data, optimized for overcoming the challenges of searching, accessing, and visualizing the complexity of the MaNGA data set. Besides patches and internal optimizations, the DR17 updates to Marvin include several enhancements such as querying targets by MaNGA quality and target bitmasks and values, full support for installation on Windows machines, as well as updates to the web interface. The Marvin Web Galaxy Page (Figure 7) now includes data quality indicators for the DAP Maps, as well as features for the spectrum display that can be toggled. For how to use the web or Python tools, see the Marvin documentation. 173 See the Marvin Changelog for a complete list of what has changed since the last released version. Contributions to Marvin are welcome and encouraged. Please see the contribution guidelines 174 for more details.
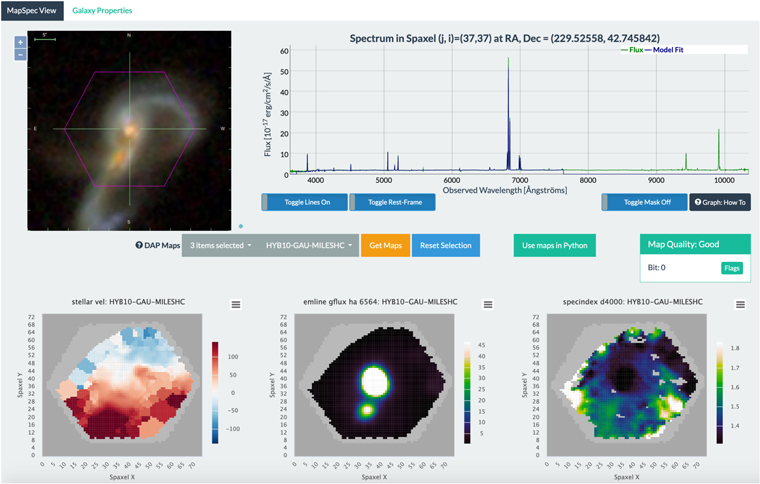
Figure 7. A screenshot of the galaxy maps view of the Marvin Web for the MaNGA galaxy 12-193481 (Mrk 848). The SDSS three-color image of the galaxy is shown in the top left part of the figure. The upper right panel shows the spectrum of the spaxel at the position (37,37), which corresponds to the center of the bundle. The maps show the following: (lower left) stellar kinematics, (lower middle) Hα emission-line flux, and (lower right) D4000 spectral index for this galaxy based on its "hybrid-binned" spectral data cube from the MaNGA DAP.
Download figure:
Standard image High-resolution imageMarvin now includes access for many of the MaNGA VACs, 175 which have been integrated into the Marvin ecosystem. Each integrated VAC is accessible either as the full catalog through the new Marvin VACs Tool or on a per-target basis through the existing Marvin Tools, e.g., Cube or Maps, via a new vacs attribute attached to each Marvin Tool instance. Check the VACs section of the DR17 Data Model in the Marvin documentation to see which VACs are available in this release.
5.4. Ancillary Programs
As described in detail in Wake et al. (2017), the MaNGA galaxy sample is comprised of a primary sample covering galaxies to 1.5 re (where re is the effective radius; the radius containing 50% of the light), a secondary sample covering galaxies to 2.5 re , and a color-enhanced sample designed to fill in underrepresented locations in the galaxy color–magnitude plane. However the number density of these main sample targets was not uniform on the sky, and in the regions of lower-than-average target density, not all of the IFUs on a plate could be assigned to core target categories. In order to fill the remaining ∼5% of MaNGA bundles, MaNGA held two competitive calls for ancillary targets (in 2014 July and 2017 January), and a variety of ancillary programs targeting assorted kinds of galaxies or other targets were selected.
We document here the final set of ancillary targets, with details on how to identify them for use, or how to exclude them from studies of the primary, secondary, and/or color-enhanced samples. We provide in Table 4 an updated list of the number of bundles available in each documented sample, along with the binary bit mask digit stored in MANGA_TARGET3 (sometimes MNGTARG3) that can be used to identify the sample. 176
Table 4. Summary of MaNGA Ancillary Programs and Targeting Bits
| Ancillary Program | Number of Bundles Observed | BITNAME | Binary Digit |
|---|---|---|---|
| Luminous AGN | 6 | AGN_BAT | 1 |
| 37 | AGN_OIII | 2 | |
| 23 | AGN_WISE | 3 | |
| 5 | AGN_PALOMAR | 4 | |
| Void Galaxies | 4 | VOID | 5 |
| Edge-on SF Galaxies | 58 | EDGE_ON_WINDS | 6 |
| Close Pairs and Mergers | 56 | PAIR_ENLARGE | 7 |
| 38 | PAIR_RECENTER | 8 | |
| 1 | PAIR_SIM | 9 | |
| 22 | PAIR_2IFU | 10 | |
| Writing MaNGA | 2 | LETTERS | 11 |
| Massive Nearby Galaxies | 70 | MASSIVE | 12 |
| Milky Way Analogs | 38 | MWA | 13 |
| 40 | MW_ANALOG | 23 | |
| Dwarf Galaxies | 31 | DWARF | 14 |
| ETGs with Radio Jets | 10 | RADIO_JETS | 15 |
| DiskMass Sample | 7 | DISKMASS | 16 |
| Brightest Cluster Galaxies | 55 | BCG | 17 |
| Resolved Stellar Pops. | 3 | ANGST | 18 |
| 18 | M31 | 21 | |
| Coma | 85 | DEEP_COMA | 19 |
| IC 342 (LVM-like Observations) | 810 | IC342 | 20 |
| SN Hosts | 19 | SN1A_HOST | 26 |
| 30 | SN_ENV | 22 | |
| Post-starburst Galaxies | 24 | POST-STARBURST | 24 |
| Giant LSB Galaxies | 3 | GLSB | 25 |
| Globular Clusters | 27 a | GLOBULAR_CLUSTER | 27 |
Notes. See Section 5.4 for an explanation of each program and the BITNAMES.
a Eight GC targets, plus 19 bulge background fields.Download table as: ASCIITypeset image
Ancillary programs in general were designed to increase the numbers of specific types of galaxies in the MaNGA sample. We provide a short summary of all the programs here (also see http://www.sdss.org/dr17/manga/manga-target-selection/ancillary-targets):
- 1.Luminous AGN: Various luminous active galactic nuclear (AGN) samples were targeted, either selected from Swift Burst Alert Telescope (BAT; AGN_BAT), [O iii] emission (Mullaney et al. 2013; AGN_OIII), Wide-field Infrared Survey Explorer (WISE; Wright et al. 2010) colors (AGN_WISE), or other AGN from the Palomar survey (AGN_PALOMAR; Ho 1995). The goal of this program was to increase the range of luminosities of AGN observed by MaNGA.
- 2.Void Galaxies: (VOID) This program targeted rare void galaxies located in low-density large-scale environments. Targets were selected from the Void Galaxy Survey (Kreckel et al. 2011).
- 3.Edge-on SF Galaxies: A set of edge-on star-forming (SF) galaxies were selected, using WISE data to estimate star formation rates (SFRs), and Sérsic axial ratios (b/a) from the NASA Sloan Atlas (NSA; Blanton et al. 2011) to estimate inclinations. The BITNAME is EDGE_ON_WINDS.
- 4.Close Pairs and Mergers: A set of close pairs and/or mergers were observed. These were either selected to be in larger bundles than typical (PAIR_ENLARGE), in recentered bundles (i.e., not centered on one of the pair, but somewhere in the middle; PAIR_RECENTER), or in overlapping tiles; sometimes two bundles are assigned—one to each of the pair (PAIR_2IFU). In addition one bundle was assigned to a merger simulated by the Galaxy Zoo: Mergers program (PAIR_SIM; Holincheck et al. 2016).
- 5.Writing MaNGA: Two bundles were assigned to an education/public outreach program to obtain MaNGA data for galaxies in the shape of letters in the word MaNGA (selected from the Galaxy Zoo "Alphabet" 177 ). These are an "M" (plate-ifu = 8721–6102) and a "g" (9499–9102). See LETTERS.
- 6.Massive Nearby Galaxies: Very massive nearby galaxies are underrepresented in MaNGA as they are too large in angular size to fit in the bundles. This program targeted bundles at the central regions of very massive nearby galaxies (MASSIVE).
- 7.Milky Way Analogs: Two different sets of Milky Way analog galaxies are included. These galaxies are identified using the method described in Licquia & Newman (2015): one set matched on stellar mass and SFR (MWA), the other matched on stellar mass and bulge-to-total ratio (MW_ANALOG).
- 8.Dwarf Galaxies: A sample of dwarf galaxies are selected from the Geha et al. (2012) catalog (DWARF) .
- 9.ETGs with Radio Jets: This is a sample of early-type galaxies (ETGs) with radio jets and evidence of suppressed SF (RADIO_JETS; Lin et al. 2010).
- 10.DiskMass Sample: This is a sample of face-on disk galaxies that had previously been observed in the DiskMass survey (Bershady et al. 2011) with the goal of providing a cross-calibration set (DISKMASS) .
- 11.Brightest Cluster Galaxies: This is a sample of brightest cluster galaxies (BCGs; BCG ) from the Yang et al. (2007) catalog. This type of galaxy is otherwise underrepresented in MaNGA.
- 12.Resolved Stellar Populations: Observations of very nearby galaxies in the Advanced Camera for Surveys (ACS) Nearby Galaxy Survey Treasury (ANGST; Dalcanton et al. 2009) survey, as well as in M31 (M31) facilitate detailed studies of resolved stellar populations.
- 13.Coma Plates: This program is a set of very deep observations of the Coma cluster (DEEP_COMA). Each dedicated plate used for this program observes the central massive cD galaxies (varying placement between the central regions and the galaxy outskirts), a selection of ordinary galaxies, three ultrafaint galaxies, and three regions of ICL. The goal was to provide very high-quality spectra to enable detailed stellar population analysis.
- 14.IC 342: This project is a mosaic of 49 MaNGA plates, covering (5 kpc × 5 kpc) across the disk of the nearby galaxy IC342 with ∼30 pc spatial resolution (IC342). This project provides test data for the Local Volume Mapper (LVM) in SDSS-V (see Section 8).
- 15.SN Hosts: This program made observations of the host galaxies of known supernova, both SN Type 1a under SN1A_HOST and other types of SN under SN_ENV.
- 16.Giant LSB Galaxies: This program is a set of observations of giant low-surface-brightness (GLSB ) galaxies identified in the NSA.
- 17.Globular Clusters: This program is a set of dithered observations of the cores of eight GCs and 19 bulge/background fields around 3 GCs (NGC 6316, NGC 6522, and NGC 6528) taken to help with MaStar (GLOBULAR_CLUSTER ).

5.5. MaNGA-related VACs
A large number of MaNGA-related VACs are presented in DR17, and will be summarized briefly below.
5.5.1. DR16+ VACs
Two MaNGA-related VACs were released in DR16+ (a mini data release that happened in 2020 July). In addition, a version of the "Visual Morphology from DECaLS Images" VAC, which is updated for DR17, was also released in DR16+. We document those first.
- 1.NASA Sloan Atlas Images and Image Analysis: This VAC contains the underlying image and image analysis for the NSA. The methods used are described in Blanton et al. (2011) and Wake et al. (2017). Briefly, for a set of nearby galaxies of known redshift (z < 0.15) within the SDSS imaging area, we have created and analyzed GALEX (Morrissey et al. 2007) and SDSS images. This analysis forms the basis for the MaNGA targeting, and resulted in the v1_0_1 NSA catalog released originally with DR14. We are now releasing the images that were analyzed to create those parameters. The data set includes the original catalogs from which the NSA sample was drawn, the mosaic images and inverse variance images that were analyzed, the deblending results for each object, the curve-of-growth and aperture corrections for each object, and other intermediate outputs. We expect that this data set may be useful for reanalysis of the GALEX or SDSS imaging. The full data set is large (15 TB), and therefore any users interested in using a large fraction of it should transfer the data through Globus (see Section 3 for details on how to use Globus 178 ).
- 2.MaNGA SWIFT VAC: The Swift+MaNGA VAC comprises 150 galaxies with both SDSS-IV/MaNGA IFU spectroscopy and archival Swift Ultraviolet Optical Telescope (UVOT) near-ultraviolet (NUV) images, and is presented in Molina et al. (2020). The similar angular resolution (∼3'') between the Swift/UVOT three NUV filters and the MaNGA IFU maps allows for spatially resolved comparisons of optical and NUV star formation indicators, which is crucial for constraining attenuation and star formation quenching in the local universe. The UVOT NUV images, SDSS optical images, and MaNGA emission-line and spectral index maps have been spatially matched and reprojected so that all of the data match the pixel sampling, resolution, and coordinate system of the UVOT uvw2 image for each galaxy. The spectral index maps utilize the definition given in Burstein et al. (1984), which allows users to more easily compute spectral indices when binning the maps. Spatial covariance is properly accounted for in the propagated uncertainties. In addition to the spatially matched maps, Molina et al. (2020) also provide a catalog with PSF-matched aperture photometry for the SDSS optical and Swift/UVOT NUV bands.
5.5.2. Galaxy Morphology VACs
A variety of galaxy morphology catalogs are provided as VACs, with analysis done in a variety of ways, using a variety of images. We provide a short summary of each here—for more details, please see the appropriate paper.
- 1.Galaxy Zoo: 3D (Masters et al. 2021): This provides crowdsourced spaxel masks locating galaxy centers, foreground stars, bars, and spirals in the SDSS images of MaNGA target galaxies. Available for use within Marvin, these masks can be used to pick out spectra, or map quantities likely associated with the different structures (see Fraser-McKelvie et al. 2019, 2020; Peterken et al. 2019a, 2019b; Greener et al. 2020; Krishnarao et al. 2020, for example use cases).
- 2.Galaxy Zoo Morphologies from SDSS, DECaLS, and UKIDSS : The Galaxy Zoo method, which involves combining classifications from a large number of classifiers collected via an online interface, has been applied to a variety of images, including the original SDSS images (Willett et al. 2013; Hart et al. 2016), the UKIDSS (Lawrence et al. 2007; Galloway 2018), and most recently the Dark Energy Camera Legacy Survey (DECaLS; Dey et al. 2019; Walmsley et al. 2021). This latter analysis combines machine learning (ML) methods with crowdsourcing in an active loop (for details see Walmsley et al. 2022). We collect together all these crowdsourced morphologies for as many MaNGA galaxies as possible in this VAC.
- 3.Visual Morphology from DECaLS Images : This VAC contains a direct visual morphological classification, based on the inspection of image mosaics generated from a combination of SDSS and DECaLs (Dey et al. 2019) images, for the MaNGA galaxies. The DR16+ version contains the classification for the first half of MaNGA galaxies (4600, MaNGA DR15) while the DR17 version contains the classification for the full MaNGA DR17 with unique MaNGAID. Through digital image postprocessing, we exploit the advantages of this combination of images to identify inner structures, as well as external low-surface-brightness features for a homogeneous classification, following an empirical implementation of the methods in Hernández-Toledo et al. (2010) and Cheng et al. (2011). The visual morphological classification is carried out by two classifiers inspecting three-panel image mosaics, containing a gray logarithmic-scaled r-band image, a filter-enhanced r-band image, and the corresponding r, g, and b color composite image from SDSS; and a similar mosaic using DECaLS images incorporating the residual image after subtraction of a best surface brightness model from the DESI legacypipeline. 179 The catalog contains the T-Type morphology, a variety of visual morphological attributes (bars, bar families, tidal debris, etc.), and our estimate of the non-parametric structural, concentration, asymmetry, and clumpiness (see CAS; Conselice 2003) parameters from the DECaLS images. For more detail, see Vázquez-Mata et al. (2021). An updated version including morphologies for all DR17 MaNGA galaxies is being prepared; see J. A. Vázquez-Mata et al. (2022, in preparation).
- 4.MaNGA PyMorph DR17 Photometric Catalog (MPP-VAC; see Fischer et al. 2019; Domínguez Sánchez et al. 2021 for details): This provides photometric parameters obtained from Sèrsic and Sèrsic+Exponential fits to the 2D surface brightness profiles of the final MaNGA DR17 galaxy sample (e.g., total fluxes, half light radii, bulge-disk fractions, ellipticities, position angles, etc.). It extends the MaNGA PyMorph DR15 photometric VAC to now include all MaNGA galaxies in DR17.
- 5.MaNGA Morphology Deep Learning DR17 Catalog (MDLM-VAC; see Domínguez Sánchez et al. 2021 for details): This provides morphological classifications for the final MaNGA DR17 galaxy sample using convolutional neural networks. The catalog provides a T-Type value (trained in regression mode) plus four binary classifications: PLTG (separates early type galaxies, or ETGs, from late types, or LTGs) , PS0 (separates ellipticals from S0), Pedge‐on (identifies edge-on galaxies), and Pbar (identifies barred galaxies). It extends the "MaNGA Deep Learning Morphology DR15 VAC" (Fischer et al. 2019) to now include galaxies that were added to make the final DR17. There are some differences with respect to the previous version—namely, the low-end of the T-Types are better recovered in this new version. In addition, the PLTG classification separates ETGs from LTGs in a cleaner way, especially at the intermediate types (−1 < T-Type < 2), where the T-Type values show a large scatter. Moreover, the value provided in the catalog is the average of 10 models trained with k-folding for each classification task (15 for the T-Type classification). The standard deviation, which can be used as a proxy for the uncertainty in the classification, is also reported.
5.5.3. Stellar Population Modeling VACs
There are a variety of stellar population modeling-based VACs released.
- 1.Principle Component Analysis (PCA) VAC (DR17): This VAC includes measurements of resolved and integrated galaxy stellar masses, obtained using a low-dimensional, PCA-derived fit to the stellar continuum and subsequent matches to simulated star formation histories. The general methodology for obtaining the principal component basis set, the stellar continuum fitting routine, and the process of inferring stellar population properties such as mass-to-light ratio are discussed in Pace et al. (2019a). The aggregation of pixel-based mass estimates and the adopted aperture-correction procedure are described in Pace et al. (2019b). This procedure yields estimates of galaxy-wide, integrated stellar masses also provided as part of this VAC. Key VAC characteristics remain unchanged in comparison to DR16 (Ahumada et al. 2020), where a holistic description of the VAC can be found. The principal enhancement in this release is in the sample size: the number of galaxies has been expanded to include all MaNGA galaxies to which the analysis could be readily applied, a total of 10,223 unique plate-ifu designations (this number differs from unique galaxy counts, as some MaNGA galaxies were observed multiple times, so they have multiple plate-ifus, each of which are analyzed separately in this VAC).
- 2.Firefly Stellar Populations: This VAC provides measurements of spatially resolved stellar population properties of MaNGA galaxies employing the Firefly 180 (Wilkinson et al. 2017) full-spectral fitting code. For DR17, Firefly v1.0.1 was run, over all 10,735 data cubes that had been processed by both the DRP and the DAP. 181 The major difference to the DR15 VAC is that we now provide the catalog in two versions. The first employs the stellar population models of Maraston & Strömbäck (2011) based on the MILES stellar library (Sánchez-Blázquez et al. 2006). The second version uses new MaStar models described in Maraston et al. (2020). Both model libraries assume a Kroupa (2001) IMF. Compared to the Firefly VAC in DR15, the radius (stored in HDU4 in the file) is now given in elliptical coordinates, and the azimuth is added. Masses (HDU11 and HDU12) are given per spaxel and per Voronoi cell. We do not provide absorption index measurements anymore. Each version of the VAC is offered as a single FITS file (∼6 GB) comprising the whole catalog of global and spatially resolved parameters and, additionally, as a small version (∼3 MB) that contains only global galaxy stellar population parameters. A detailed description can be found in Neumann et al. (2022) and Goddard et al. (2017).
- 3.Pipe3D: This VAC contains the Pipe3D (Sánchez et al. 2016) analysis of the full MaNGA data set comprising the main properties of the stellar populations and emission lines for more than 10,000 galaxies, both spatial resolved and integrated across the entire FOV of the IFUs. The content of the released distribution was originally described in Sánchez et al. (2018), and updated in S. F. Sánchez et al. (2022, in preparation). The new releases include considerable modifications from the previous ones, the most important ones being (i) the use of an updated version of the code fully transcribed to Python (E. Lacerda et al. 2022, in preparation), (ii) the use of a new stellar population library based on the MaStar stellar library (A. Mejia-Narvaez et al. 2022, in preparation), and (iii) an update on the list of analyzed emission lines.
5.5.4. H i-MaNGA DR3
H i-MaNGA is a H i 21 cm line follow-up program, to provide estimates of total atomic hydrogen content for galaxies in the MaNGA survey (Masters et al. 2019). It makes use of both previously published H i data (primarily from the ALFALFA survey; Haynes et al. 2018) and new observations using the Robert C. Bryd Green Bank Telescope (GBT; to date under observing codes GBT16A_095, GBT17A_012, GBT19A_127, GBT20B_033 and GBT21B_130). This VAC comprises the third data release (DR3) of H i 21 cm detections or upper limits for 6358 galaxies in the MaNGA sample. In some cases, both GBT and ALFALFA data exist for a single galaxy, and we provide both observations separately, so the total number of rows is 6632, with 3358 coming from our GBT observations. The observation and reduction strategies are documented in Masters et al. (2019), Stark et al. (2021). As part of this program, a 20% offset between actual and estimated L-band calibration at GBT was noticed (see Goddy et al. 2020). Stark et al. (2021) provide guidance on dealing with confusion, and including upper limits into statistical analysis. Observations are ongoing (under proposal code GBT21B_130), with the program on track to observe, or homogenize H i data for all MaNGA galaxies at z < 0.05, with no preselection on color or morphology. This is expected to result in a final H i-MaNGA sample size of around 7000 MaNGA galaxies, with over 6800 already having at least some data in hand.
5.5.5. The MaNGA AGN Catalog
The MaNGA AGN Catalog presents AGN in the DR15 sample of MaNGA that are identified via mid-infrared WISE colors, Swift/BAT ultrahard X-ray detections, NRAO-VLA Sky Survey, and Faint Images of the Radio Sky at Twenty-Centimeters (FIRST) radio observations, and broad emission lines in SDSS spectra. The catalog further divides the radio AGN into quasar-mode and radio-mode subpopulations, and provides estimates of the AGN bolometric luminosities. Full details of the AGN selection and luminosity measurements are described in Comerford et al. (2020). It is intended that this will be updated to include all the MaNGA galaxies in the future.
5.5.6. GEMA-VAC: Galaxy Environment for MaNGA Value-added Catalog
The Galaxy Environment for MaNGA (GEMA) VAC (M. Argudo-Fernádez et al. 2022, in preparation) provides a variety of different measures of environment for galaxies in MaNGA. The combination of mass-dependent and mass-independent parameters provided in the catalog can be used to explore the effects of the local and large-scale environments on the spatial distribution of star formation enhancement/quenching, in the interaction of AGN with galaxies, or in the connection with kinematics or galaxy morphology, for instance, in a homogenous way allowing comparisons between different studies. In DR17, we present the final and updated version of GEMA-VAC for the final MaNGA sample. The quantifications of the environments are based on the methods described in Argudo-Fernández et al. (2015) to estimate tidal strengths and projected number densities, as well as that in Etherington & Thomas (2015) to estimate overdensity-corrected local densities (MaNGA galaxies in the SDSS-DR15 only), and Wang et al. (2016) for an estimation of the cosmic web environment. To better explore the environment of galaxies located in dense local environments, for instance, galaxies in compact groups or with strong interactions (close paris/mergers), but not necessarily a high-density environment at larger scale, we also provide these same quantifications considering MaNGA galaxies in groups, according to an updated version of the catalog of groups compiled by Yang et al. (2007); and MaNGA galaxies in close pairs, according to the sample used in Pan et al. (2019).
5.5.7. MaNGA Spectroscopic Redshifts for DR17
We present a catalog of precise spectroscopic redshifts (M. Talbot et al. 2022, in preparation) for the RSS and spaxels in MaNGA, updating the previous version of this catalog (Talbot et al. 2018) to include the completed sample of MaNGA galaxies. These spectroscopic redshifts are computed using the spec1d—zfind code from the publicly available BOSS pipeline (Bolton et al. 2012), in which the NSA catalog provides the initial redshift. Once spectroscopic redshifts were determined for the high-S/N region within the galaxy half-light radius, a second pass attempted to determine the remaining redshifts in the low-S/N spectra using the mean spectroscopic redshift as a prior. The spectroscopic redshifts and a foreground model are presented for each spectrum with sufficient S/N to model, in this VAC.
5.5.8. MaNGA Strong Gravitational Lens Candidate Catalog
We present 6 likely, 12 probable, and 74 possible candidates as strong galaxy–galaxy scale gravitational lenses found within the completed MaNGA survey. The lens candidates are found by the Spectroscopic Identification of Lensing Objects (SILO) program (Talbot et al. 2018, 2021; M. Talbot et al. 2022, in preparation), which was adapted from the BOSS Emission-Line Lens Survey (BELLS; Brownstein et al. 2012) spectroscopic detection method to find background emission lines within coadded foreground-subtracted row-stacked-spectra of the MaNGA IFU, in which the coadded residuals are stacked across exposures from the same fiber at the same dither position. Visual inspection of any background emission line detected was performed, including the position of detections in proximity to an estimated Einstein radius. Narrowband images were constructed from the coadded residuals to search for any lensing features.
6. MaStar: The MaNGA Stellar Library
The MaStar is a project in SDSS-IV to build a large library of well-calibrated empirical stellar spectra, covering a wide range in stellar parameter space, roughly from 2500 to 35,000 K in effective temperature (Teff), from –1 to 5.5 in surface gravity ( ), and from –2.5 to 0.5 in metallicity ([Fe/H]). It is conducted using the same instrument as MaNGA but during bright time (Yan et al. 2019). Most of the observations were done by piggybacking on APOGEE-2N, in the sense that the field centers of those plates, the time spent on the field, and the number of visits were determined according to the scientific need of APOGEE-2N. Only in a small number of fields were observational parameters determined by the scientific needs of MaStar. DR17 presents data for all of the stars observed in the MaStar program, along with a complementary analysis of all the standard stars targeted on MaNGA-led plates.
The MaStar targets were selected to cover a wide range in the four-dimensional stellar parameter space (Teff,  , [Fe/H], [α/Fe].) In the part of parameter space covered by APOGEE (Majewski et al. 2017), APOGEE-2 (Section 4), SEGUE (Yanny et al. 2009), and the Large-sky Area Multi-Object fiber Spectroscopic Telescope (LAMOST; Luo et al. 2015), we make use of the stellar parameters derived from these surveys to select targets, aiming to evenly sample the parameter space. However, due to availability of stars of certain parameters, the constraints of the fields selected by APOGEE-2N and the evolving field choices, the stellar parameter space coverage cannot be completely even. In addition to these selections, we further use photometry data from the Panoramic Survey Telescope and Rapid Response System (PanSTARRS-1; Kaiser et al. 2010) and the American Association of Variable Star Observers Photometric All-Sky Survey (Munari et al. 2014) to select stars that are more likely to have extreme temperatures, either very hot or very cool. Further details of the MaStar target selection have been described in Yan et al. (2019). Once Gaia Data Release 2 (Gaia Collaboration et al. 2016, 2018) was available, we made use of the Gaia color and absolute magnitudes (derived using distances from Bailer-Jones et al. 2018) to select stars to fill up the parts of the color–magnitude space that were not sufficiently sampled, including hot main-sequence stars, blue supergiants, yellow supergiants, stars at the tip of the red-giant branch, red supergiants, carbon stars, other asymptotic-giant-branch stars, white dwarfs (WD), extreme horizontal branch stars, metal-poor dwarfs, and late M-dwarfs. These recent changes to the target selection involving Gaia photometry will be described by R. Yan et al. (2022, in preparation).
Within the APOGEE-2 bright-time extension ancillary call, the MaStar project was given a small number of hours to observe stars that could not be targeted by piggybacking on APOGEE-2N. During these times, we targeted a number of SF fields with a large number of hot main-sequence stars, blue and red supergiants, a number of fields with known metal-poor late M dwarfs, and a number of open cluster and globular cluster fields. For the dedicated globular cluster fields, we conducted dithered observations to obtain integrated spectra for the core regions of the GCs with some fibers targeting relatively isolated stars in the outskirts of GCs.
6.1. MaStar-specific Changes to the MaNGA DRP
The MaStar data are obtained using the same MaNGA fiber feed system and the BOSS spectrographs as the main MaNGA survey. The data reductions for MaStar are done with the MaNGA DRP through its 2D phase. The details of this were described by Law et al. (2016) with the DR17 updates described in Section 5.1. In the 2D phase, the only difference is in how we correct for the extinction of the standard stars in the flux-calibration module, which we describe below. The reduction for the 3D phase is done differently from MaNGA. The basics of the data reduction were described by Yan et al. (2019). We briefly describe the updates since DR15/16 below. More details of these will be presented in R. Yan et al. (2022, in preparation).
- 1.Flux calibration for both MaNGA and MaStar plates are done using a set of 12 standard stars observed simultaneously with the science targets. By comparing the spectra of these 12 stars with the theoretical spectra, we determine the throughput ratio between the observed spectra and the expected spectra above the atmosphere. This ratio is then applied to all the spectra from all the fibers to determine the per-fiber spectra. The theoretical spectra used in the comparison need to have a galactic extinction applied. For MaNGA-led plates, we use the values from the Schlegel et al. (1998) dust map as the standards in the MaNGA-led fields that are at a high Galactic latitude and at a far enough distance to be beyond most of the dust in the Milky Way in those line of sights. But this is not always the case for MaStar plates. On MaStar plates, we use the spectra themselves (relative to their respective models) to estimate the relative extinction difference between different standard stars. Then we use the broadband colors to estimate the absolute extinction level for all the stars. With that, we can then determine the combined throughput curve of the atmosphere, the telescope, and the instrument. This throughput curve is then applied to calibrate spectra from all science fibers.
- 2.Standard stars targeted with mini bundles on MaNGA-led plates are also treated like other MaStar targets. This adds a significant number of F stars to the library.
- 3.We have updated the template set used in the determination of the stellar RV search, which is a selected subset from the BOSZ templates (Bohlin et al. 2017). We expanded the subset to include templates with temperatures between 3500 and 35,000 K, with surface gravity between 1 and 5 in log (g cm−1 s2), and with two different [α/Fe] settings (0 and 0.5). We also included the Koester white dwarf templates for DA-type WDs (Koester 2010).
- 4.We changed the method used to select the fiber on which the final spectrum is based, for stars that saturate the central fiber in a bundle. We also changed the criteria of determining whether to combine spectra of multiple fibers together in each exposure. When combining spectra, the risk of red upturn is evaluated and taken into consideration. The red upturn refers to the artificial extra flux at the extreme red wavelengths in some of the spectra, which is likely introduced by crosstalk between the adjacent spectral traces and imperfect 1D extraction at the extreme wavelengths. This will be discussed in more detail in R. Yan et al. (2022, in preparation).
- 5.For some MaStar plates (usually those done in APOGEE-2 time and therefore led by APOGEE-2), we adopted exposure times much shorter than 900 s in order to target bright stars. Three exposures time settings were adopted: 28, 83, and 250 s. For those exposures shorter than 180 s, the flexure-compensation algorithm adopted by DRP for MaNGA-length exposures no longer works due to the faintness of the sky emission lines. In these cases, we measure the RVs for the standard stars, separately for the blue and red cameras, to figure out the median relative shifts between the two cameras. This is then used to adjust the blue cameras' wavelength solutions to match those of the red cameras. The flexure could also cause the wavelength solution to differ from exposure to exposure. In this case, we use the RVs derived for all stars (both science targets and standard stars) to shift the wavelength solutions of all the exposures to be consistent with the first exposure on a given visit, which is closest in time to the arc calibration frame.
We also added many quality checks and quality flags in this data release.
- 1.We added checks in the DRP to indicate the risk of red upturns. A subset of per-exposure spectra with significant upturn or downturn risks were visually inspected. The results were stored in a metadata file and read in by the pipeline to flag those per-exposure spectra. We exclude those per-exposure spectra with UPTURNRISK, REDUPTURN, or REDDOWNTURN set in their quality bitmask, if possible, when producing the per-visit-spectra.
- 2.We run all MaStar spectra through an emission-line measurement code. The results were used to select a subset for visual inspection. The visual inspection results were combined with the automated measurements to decide which spectra to be flagged as having emission lines. Spectra with Hα equivalent widths (EW) greater than 0.6 Å are flagged with the EMLINE bit in EXPQUAL and MJDQUAL. We note that usual convention has positive EW for absorption not emission, but for this context (MaStar emission-line identification), we define the emission lines to be positive in EW.
- 3.We evaluated the quality of flux calibration for both the spectra from individual exposures and the combined spectra per visit. For individual exposure spectra, we flag them according to the chi-square produced when fitting for the flux ratios between the central fiber and the surrounding fibers. When the chi-square is greater than 50, we flag the BADFLUX bit of the quality bitmask of this exposure (EXPQUAL). This threshold corresponds to an uncertainty larger than 0.15 mag (∼14%) uncertainty in the relative flux calibration between the BP and RP bands (evaluated by comparing the synthetic color with Gaia photometry). This only flags the 1% worst cases on a per-exposure per-star basis.
- 4.When we combine spectra from multiple exposures together to construct the combined exposure per visit, the quality of flux calibration is going to significantly improve due to averaging and due to the dominance by spectra with higher S/N that tend to have better calibration. The evaluation of flux-calibration quality for the combined spectra per-visit is based on uncertainty determined through the Jackknife resampling technique. If the uncertainty on the synthetic BP − RP color is more than 0.05 mag, which corresponds to 5% relative calibration error, we flag the BADFLUX bit of the quality bitmask for this visit (MJDQUAL).
- 5.We exclude those per-exposure spectra with BADSKYSUB, POORCAL, or SEVERBT set, if possible, when producing the per-visit-spectra.
All of these changes and updates will be discussed in more detail by R. Yan et al. (2022, in preparation).
6.2. Changes to the MaStar Postprocessing Pipeline
The MaStar postprocessing pipeline (mastarproc) is updated for several purposes. It processes the result from a preliminary DRP run to identify candidates with emission-line risks and red upturn/downturn risks for visual inspection. It is also updated to give more information in the MaStar summary files. We evaluate the variations of heliocentric RVs among all visits of a star (same MaNGAID) and provide both the median velocity per visit and that across all visits. The significance of the variation is provided, and if it is more than 3σ, we flag the VELVARFLAG column in the summary file. We also added several useful columns to the summary files to indicate the S/N, bad pixel fraction, etc. See more details in R. Yan et al. (2022, in preparation).
6.3. MaStar Summary Files
In this data release, we provide several summary files. The mastarall file contains only metadata information about the stars and visits, but no spectra. It has four extensions containing four tables: GOODSTARS, GOODVISITS, ALLSTARS, and ALLVISITS. The GOODSTARS table contains the summary information for all stars with at least one good quality visit spectrum, which we define as good stars. It has one entry per unique MaNGAID. The GOODVISITS table lists out all of the good quality visits for the good stars. It has one entry per unique visit. The ALLSTARS table contains the summary information for all of the stars observed in MaStar, regardless of the quality of the visits, with one entry per unique MaNGAID. The ALLVISITS table contains the information for all of the visits of all of the stars.
The mastar-goodspec file contains all of the good quality visit-spectra. It matches row-to-row to the GOODVISITS table in the mastarall file. The file mastar-badspec-v3_1_1-v1_7_7.fits.gz contains all the other visit-spectra, which are excluded from the GOODVISITS table.
In addition, we also provide two sets of files that contain spectra with unified spectral resolution curves. Because each spectrum in mastar-goodspec files can have different spectral resolution curves or LSF curves, it could be cumbersome for the users. We thus defined four resolution curves based on the distribution of the spectral resolution at each wavelength among all good visit-spectra. For each resolution curve, we select visit-spectra that have a higher resolution at all wavelengths and broadened their LSF by convolution to match the common resolution curve. We provide four files containing four subsets of visit-spectra convolved to these four uniform resolution curves, respectively.
With resolution curves unified, we could easily combine multiple visit-spectra for the same star to improve S/N. These combined spectra are also provided corresponding to the four subsets defined by the four resolution curves.
The detailed data models for these files can be found in R. Yan et al. (2022, in preparation) or on the SDSS data release website (see Section 3).
6.4. Photometry Crossmatch
With this data release, we also provide a VAC giving crossmatch information between MaStar and a few other catalogs. We crossmatch it with Gaia DR2 (Gaia Collaboration et al. 2016, 2018), Gaia EDR3 (Gaia Collaboration et al. 2021), PanSTARRS-1 (Flewelling et al. 2020), 2MASS (Skrutskie et al. 2006), and Simbad (Wenger et al. 2000).
The crossmatches between MaStar and Gaia (DR2 or EDR3) are performed in a few steps. For each MaStar target, given its coordinates and epoch of the coordinates, we select all the Gaia targets within 40'' of the star, apply PM correction to shift them to the epoch for which the MaStar coordinates were given. Then we search for the corresponding match within 3''. If there is only one match, the match is considered to be the correct one. If there is more than one candidate within the search radius, we compute a positional-matching probability and a photometry-matching probability for all candidates. The photometry-matching probability is the average among the probabilities in multiple bands available for the MaStar targets, computed using the empirical relationships we established between Gaia photometry bands and the photometry bands of the MaStar targets. Both probabilities take into account their respective uncertainties. The products of the two probabilities are used to determine the best match among the multiple matches within 3''. Nearly all MaStar good stars have a match with Gaia. Among 24,290 good stars with unique MaNGAID, all but one have a match in Gaia EDR3; all but 14 have a match in Gaia DR2.
Sometimes, a single MaStar target based on ground-based photometry is resolved by Gaia into multiple sources. Our algorithm tends to choose the brighter and more dominant source as the match. In such cases, the MaStar spectra could also be affected in two ways. First, the spectrum would contain light from both stars. Second, if the separation between the two stars is large enough to make the combined image non-circular, then the fiber-aperture correction could be significantly affected resulting in a poor flux calibration for the final spectrum. These can be identified or excluded by checking the gaia_cleanmatch column in the two tables. Sources with gaia_cleanmatch = 1 182 are considered cleanly isolated, for which the flux correction should be sufficiently accurate, according to Gaia astrometry and photometry.
With most stars crossmatched with Gaia, the crossmatch with PanSTARRS-1 is done through Gaia astrometry since it has more accurate coordinates and epoch information. Applying Gaia proper motion, we shift the Gaia-provided coordinates for MaStar targets to Epoch 2012.3, which is the approximate average epoch of the PanSTARRS-1 photometry catalog we used. Then we search for crossmatches in the PanSTARRS-1 catalog using a search radius of 2''. All sources with a unique match within 1'' are considered a secure match. For those with multiple candidates within 2'', we choose the candidate with the largest product of the positional-matching probability and the photometry-matching probability.
The Simbad Catalog (Wenger et al. 2000) contains useful spectral type and object type information for a small fraction of our targets. For crossmatching to Simbad, we shift the coordinates of all our targets to epoch 2000.0, then use a search radius of 3''. Sometimes, the same source appears as multiple entries in Simbad with different object types. In these cases, we choose the one that is most relevant or more informative for the star. About 13.3% of all the good stars and 23.4% of the science targets have a Simbad crossmatch with object-type information. About 6.1% of all good stars and 9.9% of the science targets have a Simbad match with spectral-type information.
For 2MASS, the crossmatch is done through the crossmatch table provided by Gaia (Marrese et al. 2019), using the astrometry solution provided by Gaia Data Processing and Analysis Consortium (DPAC; Lindegren et al. 2018, 2021). We also derive the extinction-corrected absolute magnitude and colors based on the Gaia photometry using a 3D dust map (Green et al. 2019) and Bailer-Jones distances (Bailer-Jones et al. 2018 for DR2 and Bailer-Jones et al. 2021 for EDR3). We also include spectral-type and object-type information available from Simbad. We provide two files. Both contain information from MaStar, PanSTARRS-1, 2MASS, and Simbad. The only difference is that one file is based on Gaia DR2, while the other file is based on Gaia EDR3.
6.5. MaStar Stellar Parameters VAC
Accurate stellar parameter labeling of the stars is essential for a stellar library. Although a significant fraction of the stars targeted in our library have been observed by other surveys with parameters derived, a large fraction still lack such information. Furthermore, the parameter derivations from previous surveys were inhomogeneous, and some were based on data with poorer quality than we have. Thus, we initiated multiple parallel efforts to determine the stellar parameters for MaStar based on MaStar spectra themselves. Within DR17, we include a VAC giving four sets of stellar parameter measurements based on different methods along with the median values of them when available and deemed robust.
The four sets of parameters are described below. More details can be found in the respective papers. A comparison between the parameters will be presented in R. Yan et al. (2022, in preparation).
- DL: This parameter set (D. Lazarz et al. 2022, in preparation) is derived using a full-spectrum fitting with an Markov Chain Monte Carlo (MCMC) sampler using interpolated BOSZ model spectra with continuum shape information included in the chi-square calculation. Extinction is fitted as a by-product. No photometry prior is used.
- LH: This parameter set (Hill et al. 2022) is derived using a full-spectrum, single-template, pPXF fitting with an MCMC sampler, using interpolated BOSZ and MARCS model spectra, with a flat prior based on the Gaia color–magnitude diagram. The continuum is modeled with a multiplicative polynomial.
- YC: This parameter set (Y. Chen et al. 2022, in preparation) is derived using a full-spectrum fitting using both the BOSZ and MARCS model spectra without interpolation, with the result produced by Bayesian average and a flat prior based on the Gaia color–magnitude diagram. The continuum is modeled with a multiplicative polynomial.
All four methods provide Teff,  , and [Fe/H]. On top of that, the methods by DL, LH, and JI also provide [α/Fe], and the method by JI additionally provides microturbulence velocity (vmicro). All methods have been applied to all spectra with quality control applied differently for different methods. Each method flags the spectra for which the parameters are considered invalid due to poor fitting quality. When we take the median, we only take the median among those methods that provide a valid measurement for a given spectrum. The uncertainties of the median values are also computed accordingly. Which methods are used in the median calculation are indicated by the INPUT_GROUPS and INPUT_GROUPS_NAME columns for Teff,
  , and [Fe/H]. The quality control is more strict for [α/Fe], for which the contributing methods are indicated by the INPUT_ALPHA_GROUPS and INPUT_ALPHA_GROUPS_NAME columns in the VAC. The details of these will be provided in R. Yan et al. (2022, in preparation).
Metallicity measurements are crucial for assigning the right library spectra to the right metallicity bin when building stellar population models. We found some of the parameter sets could have a slight systematic bias in metallicity measurements. Therefore, we calibrated the metallicity measurements for three of the four sets against APOGEE ASPCAP [Fe/H] measurements. In the VAC, in addition to the straight median among the four sets, we also provide a calibrated metallicity for each set, and the median calibrated one among the four. We consider this to be a more accurate representation of the true metallicities of the stars. The stellar parameters are more reliable when at least two of the four groups have valid measurements for the given star. The users could choose to apply similar cuts to select a set of stars with more reliable parameters.
In the right panel of Figure 8, we show the median effective temperature versus the median surface gravity for the subset of good science stars in MaStar with at least two of four groups providing valid measurements. This includes 91% of all good science stars.

Figure 8. Left: extinction-corrected G-band absolute magnitude vs. BP − RP color for all good science targets in the MaStar library. The color-coding indicates the median calibrated metallicity. Stars without valid metallicity measurements are marked as red crosses. Right: median effective temperature vs. median surface gravity for MaStar science targets with valid measurements from at least two of the four groups. Standard stars are also included in the library but are not shown in these plots.
Download figure:
Standard image High-resolution image
6.6. MaStar Sample Statistics
In total, the MaStar library includes 24,130 unique good quality stars with 59,266 good quality visits. Among these, 11,817 unique stars were targeted as science targets, and 12,345 unique stars were targeted as flux standards, with some overlap between the two categories. The 24,130 unique stars correspond to 24,290 unique MaNGAIDs as some stars correspond to more than one MaNGAIDs when taken from different source catalogs.
In Figure 8, we show a Hertzsprung-Russell diagram for all good stars in MaStar, based on Gaia EDR3 photometry after correcting for dust using the 3D dust map. The points are color-coded according to the median calibrated metallicity. This illustrates the comprehensive stellar parameter coverage of our library.
7. eBOSS-like Data
While both the main eBOSS as well as the co-observed TDSS made their final, full catalog release in DR16, new eBOSS-like data is released for both the SPIDERS subsurvey, and the eBOSS-RM program. A number of eBOSS-related VACs are also released.
7.1. eBOSS VACs
eBOSS (Dawson et al. 2016) concluded its observations of galaxies and quasars as tracers of a large-scale structure (LSS) on 2019 March 1. The goal of these measurements was to measure the distance-redshift relation with the baryon acoustic oscillation (BAO) feature that appears at a scale of roughly 150 Mpc. These data were also used to measure the growth of structure through redshift space distortions (RSD; Kaiser 1987).
The final eBOSS cosmology measurements were presented in a series of papers submitted in 2020 July. These results included consensus measurements of BAO and RSD for luminous red galaxies (LRG; Gil-Marín et al. 2020; Bautista et al. 2021) over 0.6 < z < 1.0, emission-line galaxies (ELG; Tamone et al. 2020; de Mattia et al. 2021) over 0.6 < z < 1.1, and quasars (Neveux et al. 2020; Hou et al. 2021) over 0.8 < z < 2.2. In addition, measurements of BAO were performed at z > 2.1 using clustering in the Lyα forest and cross-correlations between quasars and the forest (du Mas des Bourboux et al. 2020). These measurements were combined with the final SDSS and BOSS (Dawson et al. 2013) BAO and RSD measurements spanning redshifts 0.07 < z < 0.6 (Howlett et al. 2015; Ross et al. 2015; Alam et al. 2017) to form a final sample of distinct clustering measurements over roughly ten billion years. The aggregate precision of the expansion history measurements is 0.70% at redshifts z < 1 and 1.19% at redshifts z > 1, while the aggregate precision of the growth measurements is 4.78% over the redshift interval 0 < z < 1.5. Using the BAO technique by itself, with no other constraints, SDSS has built up a clear picture of the distance-redshift relationship revealing a clear need for dark energy with a detection significance of 8σ (Alam et al. 2021) .
The full cosmological interpretation of these data are described in Alam et al. (2021) and demonstrate the power of BAO for constraining curvature and providing robust estimates of H0. The analysis also demonstrates the ability of RSD data to complement weak-lensing and cosmic microwave background measurements in providing independent evidence for a flat cosmological model with dark energy described by a cosmological constant. The combined BAO and RSD measurements indicate σ8 = 0.85 ± 0.03, implying a growth rate that is consistent with predictions from the Planck temperature and polarization data (Planck Collaboration et al. 2020) and with General Relativity. Combining these results with Planck, Pantheon Type Ia supernovae (Scolnic et al. 2018), and weak-lensing and clustering measurements (Troxel et al. 2018) from the Dark Energy Survey leads to significant advances in cosmological constraints relative to the prior generation of experiments. Each of the three parameters, ΩΛ, H0, and σ8, is constrained at roughly 1% precision, even in a model that allows free curvature and a time-evolving equation of state for dark energy. In total, the data are best described by a flat ΛCDM model with H0 = 68.18 ± 0.79 km s−1 Mpc−1 (for full details of this analysis, see Alam et al. 2021). The Dark Energy Task Force Figure of Merit (Albrecht et al. 2006) of these data sets together is 94. 183
New VACs derived from eBOSS data were released publicly at the same time as the cosmology results. These catalogs contain the redshifts and weights for each of the LRG, ELG, quasar, and Lyα forest samples, as well as the properties of all quasars observed during the four generations of SDSS. In addition, the mock catalogs used to characterize covariance in the clustering measurements are being released in coordination with DR17. A description of each of these cosmology VACs is as follows:
7.1.1. eBOSS Large-scale Structure Catalogs
DR16 included full reductions of the completed set of the observed eBOSS spectra. An additional series of redshift estimates for the eBOSS galaxy samples was produced by an algorithm known as redrock. 184 The galaxy redshifts derived from redrock are described in Section 4 of Ross et al. (2020). An additional series of classifications and redshift estimates was also performed for the BOSS and eBOSS quasar samples. The origin of quasar redshift estimates is described in Lyke et al. (2020), while a summary of how those redshifts were used in the clustering measurements is also found in Section 4 of Ross et al. (2020). From these updated redshift estimates, LSS VACs are created, which, together map the three-dimensional structure of the universe using galaxies and quasars over redshifts 0.6 < z < 2.2. These maps are carefully constructed with corrections for observational systematic errors and random positions that sample the survey selection function to allow unbiased cosmological inference. Three distinct samples were observed by SDSS-IV and used to produce LSS catalogs: LRG (Prakash et al. 2016), ELG (Raichoor et al. 2017), and quasars (Myers et al. 2015). A VAC for each of these samples was released in 2020 July. The LSS catalogs for the LRG and quasar samples are described in Ross et al. (2020) while the LSS catalog for the ELG sample is described in Raichoor et al. (2021).
7.1.2. eBOSS DR16 Large-scale Structure Multitracer EZmock Catalogs
We present 1000 realizations of multi-tracer EZmock catalogs, with redshift evolution and observational systematics, for each sample of the DR16 LSS data. These mock catalogs are generated using the EZmock method (Chuang et al. 2015), and applied the survey footprints and redshift distributions extracted from the corresponding data. They accurately reproduce the two- and three-point clustering statistics of the DR16 data, including cross-correlations between different tracers, down to the scale of a few h−1 Mpc, and provide reliable estimates of covariance matrices and analyses on the robustness of the cosmological results. Details on the construction and clustering properties of the EZmock catalogs are presented in Zhao et al. (2021).
7.1.3. eBOSS Quasar Catalog
Beginning with SDSS-I, SDSS has maintained a tradition of releasing a visually inspected quasar (or quasi-stellar object; QSO) catalog alongside major data releases. The new SDSS-DR16Q catalog (DR16Q; Lyke et al. 2020) represents the most recent, and largest, catalog of known unique quasars within SDSS. To ensure completeness, the quasars from previous catalog releases (DR7Q; Schneider et al. 2010; DR12Q; Pâris et al. 2017) have been combined with observations from eBOSS in SDSS-IV. The catalog contains data for more than 750,000 unique quasars, including redshifts from visual inspections, PCA, and the SDSS automated pipeline. Additionally, the catalog is the first from SDSS to contain both the Hewett & Wild (2010) DR6 redshift estimates and the Shen et al. (2011) DR7 redshift estimates that are based on the Hewett & Wild (2010) algorithm. Where applicable, the catalog also contains information about broad absorption line troughs, damped Lyα absorbers, and emission-line redshifts (via PCA). As in previous releases, DR16Q also contains properties for each quasar from GALEX (Martin et al. 2005), UKIDSS (Lawrence et al. 2007), WISE (Wright et al. 2010), FIRST (Becker et al. 1995), 2MASS (Skrutskie et al. 2006), ROSAT/2RXS (Boller et al. 2016), XMM-Newton (Rosen et al. 2016), and Gaia (Gaia Collaboration et al. 2018), when available. To facilitate analyses of pipeline accuracy and automated classification, a superset was also released. This sample contained ∼1.4 million unique observations for the objects targeted as quasars from SDSS-I/II/III/IV.
7.1.4. Lyα Forest Transmission VAC
This VAC contains the estimated fluctuations of the transmitted flux fraction in the pixels across the Lyα and Lyβ spectra region of DR16Q quasars. In total, 211,375 line of sights contribute to the Lyα spectral regions and 70,626 to the Lyβ one. This VAC contains everything needed to compute the three-dimensional auto-correlation of Lyα absorption in two different spectral regions as in du Mas des Bourboux et al. (2020). When combined with the DR16Q quasar catalog, this VAC also provides the information to compute the three-dimensional quasar × Lyα cross-correlation. These two measurements are used to measure the location of the BAO as reported in du Mas des Bourboux et al. (2020).
7.2. Other VACs Based on Single-fiber Optical Spectra
The final eBOSS data sample contains more than one million spectra of stars, galaxies, and quasars obtained during SDSS-IV. This catalog has been used for a range of studies of astrophysical processes beyond the BAO and RSD measurements described above. Demonstrating the impact of these data for additional studies, this release includes a VAC of strong-lensing systems (originally released in 2020 July in a mini data release), a new catalog of lensed Lyα-emitting (LAE) galaxies, a new catalog of the cosmic web, and a catalog of metal absorbers. A description of these VACs is as follows:
7.2.1. eBOSS Strong Gravitational Lens Detection Catalog
A VAC of 838 likely, 448 probable, and 265 possible candidate strong galaxy gravitational lens systems was released along with the batch of cosmology results and VACs in 2020 July (aka DR16+). These systems were discovered by the presence of higher-redshift-background emission lines in DR16 eBOSS galaxy spectra. The methodology, including quantitative explanations of the "likely," "probably," and "possible" categorization is described in full in Talbot et al. (2021); also see Talbot et al. (2018). This SILO program extends the method of the BELLS (Brownstein et al. 2012) and Sloan Lens ACS (Bolton et al. 2006) survey to a higher redshift, and has recently been applied to the spectroscopic discovery of strongly lensed galaxies in MaNGA (see SILO; Talbot et al. 2018; also see our Section 5.5.8). Although these candidates have not been studied through a dedicated imaging program, an analysis of the existing imaging from the SDSS Legacy Survey and the DESI Legacy Surveys (Dey et al. 2019) provides additional information on these systems. This catalog includes the results of a manual inspection process, including grades and comments for each candidate, consideration of sky contamination, low-S/N emission lines, improper calibration, weak target emission lines, systematic errors, Gaussian modeling, and potential lensing features visually identified within the available imaging.
7.2.2. eBOSS ELG-LAE Strong Lens Catalog
The eBOSS ELG-LAE Strong Lens Catalog contains roughly 150 candidate strong lens systems selected from the ELG sample of the eBOSS survey released by DR17 using the method presented in Shu et al. (2016). By construction, the lensing galaxies in this catalog are ELGs up to z ≃ 1.1, and the source galaxies are Lyα emitters at z > 2. A full description of the catalog will be presented in A. Filipp et al. (2022, in preparation). This catalog is complementary to the eBOSS Strong Gravitational Lens Detection Catalog constructed by Talbot et al. (2021, Section 7.2.1 above), in which the source galaxies are all [O ii] emitters at z < 1.7.
7.2.3. Cosmic Web Environmental Densities from Monte Carlo Physarum Machine
The Monte Carlo Physarum Machine (MCPM) cosmic web reconstruction algorithm (Burchett et al. 2020; Elek et al. 2021) was employed to characterize the matter density field from galaxies spectroscopically observed in SDSS, including those previously included in the NSA (Blanton et al. 2011) and LOWZ and eBOSS LRG catalogs. The MCPM framework, which is particularly sensitive to the filamentary structure of the cosmic web, requires as inputs galaxy coordinates, redshifts, and halo masses, and we leverage stellar mass measurements included in VACs from previous data releases, the NSA itself, and the eBOSS Firefly VAC (Comparat et al. 2017). Halo masses were then derived by the halo abundance matching relations from Moster et al. (2013). Using the Polyphorm software (Elek et al. 2020), in which MCPM is implemented, reconstructions were produced in various redshift ranges corresponding to the varying depth/completeness of the galaxy samples. MCPM then provides a proxy metric (known as the trace) for the environmental density at each point in the fitted volume. These arbitrary density values are then calibrated to the cosmological matter density relative to the mean matter density by performing MCPM fits to the Bolshoi–Planck (Klypin et al. 2016) dark-matter-only cosmological simulation's halo catalog (Behroozi et al. 2013) and producing a mapping between the MCPM trace and simulation 3D matter density field. The data products are as follows: (1) galaxy catalogs with local environmental density values evaluated at their locations from the full 3D density field and (2) the 3D density field itself, which users may in turn query for density values at locations away from known galaxy positions.
7.3. SPIDERS
Within eBOSS, the SPIDERS program, dedicated to the characterization of the X-ray sources, was the largest and most complete spectroscopic follow-up of the best all-sky X-ray surveys available at the time (mainly the ROSAT all-sky survey; Clerc et al. 2016; Dwelly et al. 2017; Salvato et al. 2018). As the acronym suggests, the original motivation and plans for SPIDERS were driven by the capabilities of the eROSITA X-ray telescope (on board the Spectrum Roentgen Gamma, or SRG, satellite), which launched on 2019 July 13 (Predehl et al. 2021), significantly later than the planned date at the start of SDSS-IV. While waiting for eROSITA to collect data, the SPIDERS program targeted ROSAT/1RXS and XMM-Newton Slew Survey sources within the eBOSS footprint. These targets are expected to make up the bright X-ray flux end of the eROSITA population. Much of the SDSS spectroscopy from the SPIDERS program was released as part of SDSS DR16 (Ahumada et al. 2020), including the largest spectroscopic redshift catalogs of X-ray-selected AGN and clusters (Clerc et al. 2020; Comparat et al. 2020b; Kirkpatrick et al. 2021).
Below, we highlight some recent pre-eROSITA SPIDERS results that are based on the SDSS DR16 data set. Then, in Section 7.5, we present a new SPIDERS data set (to be released as part of SDSS DR17 185 ), dedicated to the spectroscopic follow-up of X-ray sources discovered in early SRG/eROSITA performance verification observations. In Section 7.5.6, we discuss future plans for eROSITA follow-up in SDSS-V (also see Section 8).
7.4. SPIDERS Galaxy-cluster Highlights
In this section, we describe the SPIDERS cluster sample, the largest catalog of spectroscopically confirmed X-ray-detected clusters to date. While no new data is released in DR17, several new results have come out since DR16. We refer the reader to the below papers for details of the ancillary data created and how to access it.
The bulk of the galaxy-cluster population targeted by SPIDERS up to and including DR16 originated from the ROSAT-based CODEX survey (Finoguenov et al. 2020), with additions of low-mass systems from the XMM-Newton-based X-CLASS catalog. The initial SPIDERS CODEX and X-CLASS targeting plans and survey strategy were described by Clerc et al. (2016). Clerc et al. (2020) provide complementary details of targeting updates that occurred during the course of the project. Clerc et al. (2020) also describe the full sample of acquired targets, the achieved spectral quality, as well as the redshift-measurement success rate (nearly 98%) and precision (20 km s−1 at z = 0.2 after averaging all galaxies in a cluster). In particular, Clerc et al. (2020) highlight the very homogeneous nature of targets observed throughout the program; this specific feature supports a minimally biased spectroscopic follow-up of clusters.
Galaxy clusters confirmed and validated with the spectroscopy from SPIDERS are presented in Kirkpatrick et al. (2021, 2740 CODEX clusters) and Koulouridis et al. (2021, 124 X-CLASS clusters). These two catalog papers list confirmed clusters up to z ≲ 0.6, and present derived X-ray properties that exploit high-precision cluster redshifts, obtained by averaging multiple SPIDERS member galaxy spectra per cluster. Kirkpatrick et al. (2021) also provide velocity-dispersion estimates for those clusters with more than 15 members, confirming correlations with X-ray luminosity and optical richness found by other studies. A galaxy-cluster number count analysis performed in the velocity-dispersion–redshift parameter space yields constraints on the cosmological parameters Ωm and σ8 consistent with the main cosmological analysis of the sample. The main cosmological analysis of the SPIDERS clusters program is presented by Ider Chitham et al. (2020); it involves the modeling of the redshift–richness relation of galaxy clusters spectroscopically confirmed by SPIDERS. The best-fit parameters are found to be  and σ8 = 0.73 ± 0.03. As a central ingredient in those cosmological studies, the calibration of the mass–observable relations is presented in two papers: Capasso et al. (2019) focus on the mass–richness relation and Capasso et al. (2020) on the mass–X-ray luminosity relation. The large-scale clustering of clusters—highly biased tracers of the underlying dark-matter density field—is presented and discussed by Lindholm et al. (2021). Taking advantage of the dense and precise spectroscopic sampling of cluster members, Mpetha et al. (2021) extract the gravitational redshift signal from stacks of SPIDERS confirmed galaxy clusters. Brightest SPIDERS cluster galaxies are studied by Furnell et al. (2018) and Erfanianfar et al. (2019); in particular, the scaling of their stellar mass with the host halo properties is shown to lack evolution since z ∼ 0.6.
7.5. The eROSITA Final Equatorial-depth Survey
During the SRG performance verification phase (2019 November), eROSITA was used to survey a contiguous region of ∼140 deg2. This eROSITA Final Equatorial-Depth Survey (eFEDS; Brunner et al. 2021; Liu et al. 2021b) is intended as an early representative demonstration of the capabilities of the eROSITA all-sky survey, which will not be completed until late 2023. In order to exploit the availability of these X-ray data, we allocated a dedicated set of 12 SDSS-IV/SPIDERS plates to follow up the counterparts of eFEDS X-ray sources, to be observed at APO during the first quarter of 2020. These special eFEDS plates, documented here, are released as part of SDSS DR17. Unfortunately, because of the COVID19-related closure of APO (see Section 1), only a small fraction of the originally designed plates were observed, most to shallower-than-expected depth. Nevertheless, this program did collect useful data, and the experience acquired has greatly helped the preparation of the eROSITA follow-up component of the SDSS-V Black Hole Mapper (BHM) program (Kollmeier et al. 2017; also see our Section 8).
The target selection procedure for eFEDS broadly followed the steps carried out for the follow-up of ROSAT sources in SPIDERS (Clerc et al. 2016; Dwelly et al. 2017). First, the X-ray source detection process (described in detail by Brunner et al. 2021) provides a catalog, including parameters that describe the detection likelihood, extent likelihood (to distinguish point sources from extended ones), and astrometrically corrected X-ray position and positional uncertainty. For the SDSS-IV targeting of eFEDS sources, we used the preliminary data processing software version available at that date (late 2019, "c940"), and only considered eFEDS sources with detection likelihood >8, so that the fraction of spurious detections is kept to a relatively low rate. Based on simulations (Comparat et al. 2019, 2020a; Liu et al. 2021c), we expect only around 2% of these X-ray detections to be spurious. Optical/IR counterparts were associated with the X-ray sources using the methods described below. Finally, each of these counterparts is identified as being in one or more target classes (recorded using flags in the targeting bitmask, Section 7.5.4), and then the final target list is created that includes only objects suited for spectroscopic observations with the BOSS spectrographs.
7.5.1. eFEDS: Optical Counterparts to Extended Sources
The identification of SPIDERS clusters and their membership, as well as the detailed target selection process, are described fully by A. Merloni et al. (2022, in preparation) and J. Ider Chitham et al. (2022, in preparation). Here we document the resulting targeting bits that describe the contents of the SPIDERS cluster target catalog:
- 1.EFEDS_EROSITA_CLUS: These are galaxies associated with extended X-ray emission. A combination of all member galaxies selected using redMaPPer in scanning-mode (Rykoff et al. 2014) as well as additional BCGs identified using the multicomponent matched filter cluster confirmation tool (Klein et al. 2019). BCGs are allocated with the highest-target priority (0), while all other members are given a lower priority (33-130). The selection method on eFEDS extended sources is described fully in Liu et al. (2021a), Klein et al. (2021). The redMaPPer-based selection uses positional X-ray information to estimate optical properties such as photometric redshifts, centering information, and member selection in a method analogous to that of Clerc et al. (2016), as used in the SPIDERS DR16 data release. The method itself is described by Ider Chitham et al. (2020), J. Ider Chitham (2022, in preparation). The photometric selections of BCGs and cluster members are based on the eighth data release of the DESI Legacy Imaging Surveys (using g − r and r − z colors) as well as HSC photometric (grizy) data (Aihara et al. 2019; Dey et al. 2019). Cluster BCG photometric redshifts are within 0.0 < z < 1.3, and a total of 85 were observed.
- 2.
- 3.
7.5.2. eFEDS: Optical Counterparts to Point Sources
The method used to associate optical/IR counterparts to the eFEDS X-ray point-sources is presented by Salvato et al. (2021). In short, the optical counterparts to the X-ray sources were identified using a Bayesian association algorithm NWAY (Salvato et al. 2018), which accounts for both position and photometric properties of the counterpart. The association algorithm was informed by a large training sample of XMM-Newton and Chandra X-ray serendipitous sources with secure optical identifications. Supplementary optical/IR counterparts were also provided via a Likelihood Ratio approach (Sutherland & Saunders 1992; Ruiz et al. 2018). Note that, at the time of selection of targets for the SDSS-IV special plates, only very early versions of the X-ray catalog and counterpart selection algorithms were available—so the pool of targets is different from the counterparts presented by Salvato et al. (2021). The main eFEDS pointlike target class is EFEDS_EROSITA_AGN with 2149 observed targets. Despite the name, we expect this target set to also include a number of stars and (inactive) galaxies.
7.5.3. eFEDS: Additional Targets
To ensure that all the fibers available in the designed plates could be allocated to interesting scientific targets, beyond the eROSITA-selected sources described above, several additional target classes were defined before the arrival of the eROSITA data. The largest of these were special classes of AGN drawn from optical targets selected by a combination of the HSC Subaru Strategic Program imaging and other multiwavelength catalogs. Note that, due to the high sky density seen in the available eROSITA/eFEDS source catalog, very few fibers were left for filler targets, and so most of the defined target classes were allocated zero fibers (unless the same astrophysical object was also selected as an eROSITA target). However, since these target selection classes are defined in the DR17 data products, for completeness of the documentation, we give a brief description here of each target class.
- 1.EFEDS_HSC_HIZQSO: Optical/NIR High-redshift QSO candidates selected from HSC photometric data with a drop-out technique targeting z > 4
- 2.EFEDS_HSC_WERGS: FIRST-detected bright radio galaxies selected for their extreme red Optical-NIR colors
- 3.EFEDS_HSC_REDAGN: WISE-detected obscured AGN candidates selected on the basis of their extremely red Optical-NIR colors
- 4.EFEDS_COSMOQSO: UV excess/variability selected QSO—following prototype selection criteria of 4MOST Cosmology Survey
- 5.EFEDS_WISE_AGN: AGN candidate selected via location in WISE color–magnitude space, following criteria of Assef et al. (2018)—with optical counterparts selected from DESI Legacy Imaging Survey DR8
- 6.EFEDS_WISE_VARAGN: AGN candidate selected via variability signature in WISE data—with optical counterparts selected from DESI Legacy Imaging Survey DR8
- 7.
- 8.EFEDS_CSC2: X-ray sources from the Chandra-CSC2.0 catalog (Evans et al. 2010)—with optical counterparts selected from DESI Legacy Imaging Survey (DR8)
- 9.EFEDS_SDSSWISE_QSO: QSO candidates from the Clarke et al. (2020) ML classification of SDSS-WISE photometric sources
- 10.EFEDS_GAIAWISE_QSO: QSO candidate from the Shu et al. (2019) Random Forest classification of Gaia-unWISE sources
- 11.EFEDS_KIDS_QSO: QSO candidate from the Nakoneczny et al. (2019) classification of KiDS+VIKING DR3 sources
- 12.EFEDS_GAIA_WD: Gaia-selected WD binary candidate in the region between the zero age main sequence and the WD sequence.
- 13.EFEDS_GAIAGALEX_WD: Gaia-GALEX UV excess source—expected to be compact binary harboring a WD
- 14.EFEDS_VAR_WD: WD candidate selected on the basis of its optical variability
Further details of the eFEDS target selection process will be presented in A. Merloni et al. (2022, in preparation).
7.5.4. Target Classes, Target Bits
The targets described above for the eFEDS field are assigned to 19 different target classes. Table 5 describes each of the target classes designed for the 12 plates covering eFEDS. The maskbits used range from 19 to 47 and can be found in the EBOSS_TARGET1 target bitmask. For clarity, only the bits for target classes that resulted in observations are reported.
Table 5. Different Target Classes Created for the SDSS-IV/eFEDS Plates
| EBOSS_TARGET1 | Bit name | N | Description |
|---|---|---|---|
| 19 | EFEDS_EROSITA_AGN | 2149 | Pointlike eROSITA source—target expected to be AGN, star or compact object |
| 20 | EFEDS_EROSITA_CLUS | 85 | Extended eROSITA source—target expected to be galaxy-cluster member |
| 22 | EFEDS_HSC_HIZQSO | 34 | High-redshift QSO candidate from HSC photometry |
| 23 | EFEDS_HSC_WERGS | 154 | WISE bright, optically faint radio galaxy from HSC photometry |
| 24 | EFEDS_HSC_REDAGN | 108 | Obscured AGN selected in HSC+WISE and/or HSC+VIKING photometry |
| 25 | EFEDS_COSMOQSO | 1056 | UVX/variability QSO selection |
| 26 | EFEDS_WISE_AGN | 649 | WISE color-selected AGN |
| 27 | EFEDS_WISE_VARAGN | 508 | WISE variability-selected AGN |
| 28 | EFEDS_XMMATLAS | 88 | X-ray-selected target from the XMM-ATLAS coverage in the eFEDS field |
| 29 | EFEDS_CSC2 | 6 | X-ray-selected target from the Chandra Source Catalog in the eFEDS field |
| 35 | EFEDS_SDSSWISE_QSO | 395 | QSO candidate from UMAP classification of SDSS+WISE photometric sources |
| 36 | EFEDS_GAIAWISE_QSO | 651 | QSO candidate from RF classification of Gaia-unWISE sources |
| 37 | EFEDS_KIDS_QSO | 565 | QSO candidate from classification of KiDS+VIKING DR3 sources |
| 38 | EFEDS_SDSS_REDMAPPER | 1031 | RedMaPPER galaxy-cluster candidate with SDSS photometry |
| 39 | EFEDS_HSC_REDMAPPER | 13 | RedMaPPER galaxy-cluster candidate with HSC photometry |
| 45 | EFEDS_GAIA_WD | 55 | Gaia-selected WD binary candidate in the region between the ZAMS and the |
| WD sequence. | |||
| 46 | EFEDS_GAIAGALEX_WD | 9 | Gaia-GALEX UV excess source—expected to be compact binary harboring a WD |
| 47 | EFEDS_VAR_WD | 3 | Optical variability selected WD candidate |
Note. These bits are located within the EBOSS_TARGET1 targeting bitmask. In the column "N," we report the number of observed targets falling in a category. Note that targets can belong to several categories.
Download table as: ASCIITypeset image
7.5.5. eFEDS Observations
Observations were carried out in 2020 March, but due to a combination of poor weather and COVID-19 shut down (on MJD 58,932), the program could unfortunately not be completed. The initial success criteria for a plate to be considered complete were SN2_G1,2 > 20, SN2_I1,2 > 40, where the SN2 are estimates of the squared S/N, at fiducial 2'' fiber magnitudes of g = 21.2 and i = 20.2, averaged over the targets in each of the four BOSS spectrograph arms (G1, I1, G2, I2). These SN2 thresholds are approximately double those adopted for regular eBOSS observations (Dawson et al. 2016). This guarantees highly complete redshift measurements for faint AGN, and allows the measurement of the properties of the AGN and of the host galaxy.
Table 6 details the plate numbers and the meta data related to their observations. Only seven out of 12 plates were actually observed in the period MJD 58,928–58,932; of these seven, only one plate reached nominal depth, three received significant exposure beyond the typical eBOSS limit, and three were only partially exposed. In Table 6, these are marked as good ("G"), fair ("F"), and bad ("B"), respectively.
Table 6. Summary of eFEDS Observations
| Plate | MJD | R.A. | Decl. | Quality | SN2 | Tile ID | |||
|---|---|---|---|---|---|---|---|---|---|
| Number | (deg) | (deg) | G1 | I1 | G2 | I2 | |||
| 12525 | 58,932 | 130.27 | −0.57 | B | 7.6 | 17.8 | 9.2 | 26.0 | 17693 |
| 12527 | 58,930 | 130.02 | 1.65 | F | 9.1 | 27.6 | 10.8 | 35.0 | 17694 |
| 12531 | 58,932 | 131.96 | 1.65 | B | 3.2 | 9.1 | 4.0 | 11.5 | 17696 |
| 12533 | 58,931 | 134.15 | −0.57 | B | 0.4 | 0.9 | 0.6 | 1.4 | 17697 |
| 12544 | 58,928 | 137.79 | 1.65 | F | 9.3 | 21.9 | 9.8 | 29.7 | 17702 |
| 12545 | 58,930 | 140.02 | −0.55 | F | 8.3 | 24.6 | 9.4 | 30.9 | 17703 |
| 12547 | 58,928 | 139.75 | 1.65 | G | 28.8 | 70.3 | 27.1 | 81.4 | 17704 |
Note. Plate: plate number. MJD: Modified Julian Date of the observations. R.A.: R.A. of the center of the plate (degrees). Decl.: decl. of the center of the plate (degrees). Quality: "G": good, "F": fair, and "B": bad. SN2: signal to noise reached in each spectrograph's arm.
Download table as: ASCIITypeset image
The redshifts from eFEDS special plates are part of the catalog that describes the multiwavelength properties of the eROSITA point sources (Salvato et al. 2021), currently available at https://erosita.mpe.mpg.de/edr/eROSITAObservations/Catalogues/ and expected to be available in Vizier in the future.
7.5.6. eFEDs in SDSS-V
The spectroscopic observations of the eROSITA sources in the eFEDS PV field, reduced at the end of the SDSS-IV program because of the 2020 March closure at APO, has been resumed within the early (plate-mode operations) phase of SDSS-V (see Section 8). A much more complete description of the eFEDS program (SDSS-IV and SDSS-V) will be provided in A. Merloni et al. (2022, in preparation). Among others, the more homogeneous coverage of the combined program will enable the X-ray AGN clustering studies and galaxy–galaxy lensing measurements (J. Comparat et al. 2021, in preparation) on an unprecedentedly large sample.
Eventually, with the commissioning of the robotic fiber positioners on both northern and southern SDSS-V sites, SPIDERS will deliver on its original promises of massive, systematic spectroscopic observations of the sources detected in the eROSITA all-sky survey as part of the SDSS-V BHM program (Kollmeier et al. 2017). The experience and the scientific results obtained by the SPIDERS team within SDSS-IV, which we have briefly described above, represent a major milestone for the planning, execution, and exploitation of the BHM survey program.
7.6. eBOSS-RM
The SDSS-RM project is a dedicated multi-object optical RM program (Shen et al. 2015a) that has monitored a single 7 deg2 field (R.A. J2000 = 213.704, decl. J2000 = +53.083) since 2014 during both SDSS-III and SDSS-IV, using the BOSS spectrographs (Smee et al. 2013) at APO. The first-season SDSS-RM spectroscopic data were taken during 2014 January–July in SDSS-III (Eisenstein et al. 2011) and consist of a total of 32 epochs with an average cadence of ∼4 days; each epoch had a typical exposure time of 2 hr. The SDSS-RM program continued in SDSS-IV (Blanton et al. 2017), with ∼12 epochs per year (2 per month) with a nominal exposure time of 1 hr each during 2015–2017, and ∼6 epochs per year (monthly cadence) during 2018–2020. As of 2020 July, SDSS-RM has obtained a total of 90 spectroscopic epochs over a spectroscopic baseline of 7 yr (2014–2020). All SDSS spectroscopic data (pipeline reduced and calibrated) from SDSS-RM are included in the data releases of SDSS-III and SDSS-IV. The full technical details of SDSS-RM are provided in Shen et al. (2015a).
In addition to the optical BOSS spectroscopy, accompanying photometric data in the g and i bands are acquired with the 3.6 m Canada–France–Hawaii Telescope and the Steward Observatory 2.3 m Bok telescope (Kinemuchi et al. 2020). The final photometric baseline spans 11 yr (2010–2020) when including the 2010–2013 photometric light curves from the Pan-STARRS 1 (Kaiser et al. 2010) Medium Deep survey that covers the entire SDSS-RM field. The SDSS-RM sample includes 849 broad-line quasars with iPSF < 21.7 and 0.1 < z < 4.5 without any constraints on quasar properties. The detailed sample properties are described in Shen et al. (2019b).
The primary science goal of SDSS-RM is to measure RM lags of different broad emission lines covered by optical spectroscopy across the full range of the quasar luminosity and redshift probed by the sample. SDSS-RM has successfully measured short (<6 months) lags for the low-ionization broad lines (e.g., Hα, Hβ, and Mg ii; Shen et al. 2016b; Grier et al. 2017) based on the 2014 data. Grier et al. (2019) reported results on C iv lags using the first four years (2014–2017) of imaging and spectroscopy from SDSS-RM (and for Mg ii lags in Homayouni et al. 2020), where the lags are typically longer than one season in the observed frame. Lag measurements based on more extended light curves are reported in Shen et al. (2019a), and the analyses of the final SDSS-RM data set are underway.
In addition to the main science goal of RM measurements, SDSS-RM also enables a diverse range of quasar science. Some notable examples are the following: measurements of continuum lags to constrain quasar accretion disk sizes (Homayouni et al. 2019), constraints on the black hole mass—host galaxy correlations at z > 0.3 (Matsuoka et al. 2015; Shen et al. 2015b; Yue et al. 2018; Li et al. 2021), spectral and variability properties of quasar emission and absorption lines (Shen et al. 2016a; Sun et al. 2018; Hemler et al. 2019; Wang et al. 2019, 2020), and extreme variability in quasars (Dexter et al. 2019).
The SDSS-RM field continues to be monitored with optical imaging and spectroscopy as part of the BHM program in SDSS-V (Kollmeier et al. 2017, and Section 8 below). With more extended light curves, this program will be able to measure broad-line RM lags for the most luminous quasars at high redshift.
8. Conclusions and Future Plans
This paper documents the final data release from the SDSS-IV collaboration, and the seventeenth data release from SDSS programs as a whole (DR17). With this paper, we make all SDSS-IV data public, concluding the program described in Blanton et al. (2017). In the rest of this section, we give an update of SDSS-V that is now actively observing.
8.1. SDSS-V
As SDSS-IV was wrapping up observations (in late 2020 at APO and early 2021 at LCO), the next generation of SDSS began—SDSS-V 186 (Kollmeier et al. 2017), with its first data taken using the existing plug plate system at APO in late 2020. Building on the legacy of earlier generations, SDSS-V is a multi-epoch spectroscopic survey to observe nearly six million sources using the existing BOSS/APOGEE spectrographs and 2.5 m telescopes, as well as very large swathes of the interstellar medium (ISM) in the Milky Way and Local Group using new optical spectrographs and small telescopes. SDSS-V operates at both APO and LCO and will provide the first panoptic spectroscopic view of the entire sky, spanning a wide variety of target types, observing cadences, and science goals.
The scientific program is overseen by three "Mappers":
- 1.The Milky Way Mapper (MWM) is targeting millions of stars and stellar remnants with both the APOGEE and BOSS spectrographs, probing stellar populations from the immediate solar neighborhood across the MW, to the far side of the Galactic disk and in the MW's satellite companions. The MWM's primary goals are to explore (1) the formation and evolution of the MW, (2) the interior physics and evolutionary pathways of stars across all Teff regimes, from combined asteroseismology and spectroscopy (e.g., Aerts 2021), and (3) the architecture of multi-star and planetary systems.
- 2.The BHM is targeting nearly half a million accreting SMBHs and other X-ray sources, including newly discovered systems from the SRG/eROSITA mission, with the optical BOSS spectrographs. The BHM seeks to characterize the X-ray sky, improve our understanding of accretion physics, and trace the evolution and impact of supermassive black holes across cosmic time.
- 3.The LVM is using a wide-field optical IFU, with new optical spectrographs (R ∼ 4000, λ = 3600–9800 Å) fed by a 16 cm telescope, to map ∼2800 deg2 of sky. With their tens of millions of spectra sampling the ISM and embedded stellar populations in the MW and satellite galaxies, the LVM's maps will reveal the physics of star formation and the ISM, the complex interplay between stars and the ISM, and the connections between interstellar processes on parsec-sized to galaxy-wide scales.
SDSS-V expands upon the operational infrastructure and data legacy of earlier SDSS iterations with several key developments. Among these are the installation of robotic fiber positioners in the focal planes of both 2.5 m telescopes at APO and LCO, which replace the now-retired SDSS plug plate system. In comparison to earlier SDSS surveys, these focal plane systems enable improved observing efficiency, larger target densities, and more complex observing cadences for the MWM and BHM programs. In addition, the LVM is constructing additional small telescopes at LCO (with longer-term plans to expand to APO) that are linked to new optical spectrographs based on the DESI design (Martini et al. 2018). SDSS-V is continuing the decades-long SDSS legacy of open data policies and efficient, well-documented public data access, boosted with the development of improved data distribution systems to serve its expansive time-domain, multi-object, and integral-field data set to the world. The eighteenth data release of the SDSS (DR18), which will include the first SDSS-V data, mostly targeting and other information, is currently anticipated for 2022.
SDSS-V will also build on the rich educational legacy established by the previous SDSS generations. This will include continuing to distribute as many SDSS plug plates to schools and science centers as possible, and broadening the reach of the SDSS Voyages suite of educational activities. SDSS's large online data sets are an ideal resource for supporting hands-on activities using real archival data, at a wide range of ability levels, and have the potential to act as a gateway for numerous data science and analysis topics.
After twenty-one years of Sloan Digital Sky Surveys, the data released by SDSS-IV in DR17 has made significant contributions to our understanding of the MW, galaxy evolution, and the universe as a whole, and it will continue to enable new research for years to come. The SDSS-IV project is now complete, but the new technology and exciting new surveys, coming as part of SDSS-V, mean that the future remains bright for the SDSS legacy.
Funding for the Sloan Digital Sky Survey IV has been provided by the Alfred P. Sloan Foundation, the U.S. Department of Energy Office of Science, and the Participating Institutions. SDSS-IV acknowledges support and resources from the Center for High-Performance Computing at the University of Utah. The SDSS website is www.sdss.org.
SDSS-IV is managed by the Astrophysical Research Consortium for the Participating Institutions of the SDSS Collaboration including the Brazilian Participation Group, the Carnegie Institution for Science, Carnegie Mellon University, the Chilean Participation Group, the French Participation Group, Center for Astrophysics ∣ Harvard & Smithsonian, Instituto de Astrofísica de Canarias, The Johns Hopkins University, Kavli Institute for the Physics and Mathematics of the Universe (IPMU)/University of Tokyo, Korean Participation Group, Lawrence Berkeley National Laboratory, Leibniz Institut für Astrophysik Potsdam (AIP), Max-Planck-Institut für Astronomie (MPIA Heidelberg), Max-Planck-Institut für Astrophysik (MPA Garching), Max-Planck-Institut für Extraterrestrische Physik (MPE), National Astronomical Observatories of China, New Mexico State University, New York University, University of Notre Dame, Observatário Nacional/MCTI, The Ohio State University, Pennsylvania State University, Shanghai Astronomical Observatory, United Kingdom Participation Group, Universidad Nacional Autónoma de México, University of Arizona, University of Colorado Boulder, University of Oxford, University of Portsmouth, University of Utah, University of Virginia, University of Washington, University of Wisconsin, Vanderbilt University, and Yale University.
Coauthorship on SDSS-IV data papers is alphabetical by last name and offered to all collaboration members who have contributed at least 1 month FTE toward any of the surveys during the period up to the end of data collection; as well as to any formally approved external collaborator who has contributed at least 1 month FTE to work critical to the data release.
The documentation workshop for DR17 was held over Zoom ("DocuZoom") in 2021 May. This event was the main venue for documentation updates for DR17 (including the start of this paper) and was attended by Anne-Marie Weijmans, Joel Brownstein, Mike Blanton, Karen Masters, Renbin Yan, Sten Hasselquist, Michael Talbot, Hannah Lewis, Christian Hayes, Ani Thaker, Gail Zasowski, David Law, Brian Cherinka, Kyle Westfall, Amy Jones, Lewis Hill, Jon Holtzman, José Sánchez-Gallego, Rachael Beaton, Scott Anderson, Jennifer Johnson, Caroline Swartz, Jordan Raddick, Julie Imig, and a Llama.
Figure 1 made by Joel Browstein; Figures 2 and 3 made by Christian Hayes; Figure 4 made by Jon Holtzman; Figure 5 made by José Sánchez-Gallego; Figure 6 made by Kyle Westfall; Figure 7 made by Brian Cherinka; Figure 8 made by Renbin Yan.
This publication uses data generated via the Zooniverse.org platform, development of which is funded by generous support, including a Global Impact Award from Google, and by a grant from the Alfred P. Sloan Foundation.
This publication makes use of data products from the Two Micron All Sky Survey, which is a joint project of the University of Massachusetts and the Infrared Processing and Analysis Center/California Institute of Technology, funded by the National Aeronautics and Space Administration and the National Science Foundation.
This work is based, in part, on observations made with the Spitzer Space Telescope, which is operated by the Jet Propulsion Laboratory, California Institute of Technology under a contract with NASA.
This publication makes use of data products from the Wide-field Infrared Survey Explorer (Wright et al. 2010), which is a joint project of the University of California, Los Angeles, and the Jet Propulsion Laboratory/California Institute of Technology, funded by the National Aeronautics and Space Administration, and NEOWISE, which is a project of the Jet Propulsion Laboratory/California Institute of Technology. WISE and NEOWISE are funded by the National Aeronautics and Space Administration.
This work has made use of data from the European Space Agency (ESA) mission Gaia (https://www.cosmos.esa.int/gaia), processed by the Gaia Data Processing and Analysis Consortium (DPAC; https://www.cosmos.esa.int/web/gaia/dpac/consortium). Funding for the DPAC has been provided by national institutions, in particular the institutions participating in the Gaia Multilateral Agreement.
This research has made use of NASA's Astrophysics Data System.
This research has made use of the SIMBAD database, operated at CDS, Strasbourg, France. The original description of the SIMBAD service was published in Wenger et al. (2000).
This research has made use of the VizieR catalog access tool, CDS, Strasbourg, France (doi:10.26093/cds/vizier). The original description of the VizieR service was published in Ochsenbein et al. (2000).
This research makes use of data from the Green Bank Observatory. The Green Bank Observatory is a facility of the National Science Foundation operated under cooperative agreement by Associated Universities, Inc.
This research made use of astropy, a community-developed core python (http://www.python.org) package for astronomy (Robitaille et al. 2013); ipython (Pérez & Granger 2007); matplotlib (Hunter 2007); numpy (van der Walt et al. 2011); scipy (Jones et al. 2001); and topcat (Taylor 2005).
Footnotes
- 154
The number of spectra are tallied as the number of new entries in the AllVisit file. Table 1 conveys the numbers of unique targets that come from the AllStar file.
- 155
- 156
- 157
- 158
- 159
This is a revised version of the dr17/synspec directories, correcting a minor problem with the LSF convolution for a subset of stars observed at LCO; however, since value-added catalogs were constructed with the original dr17/synspec we have retained it for completeness.
- 160
Users may find the library version in the name of the summary file, as well as in the ASPCAP_ID tag provided for each source in these files.
- 161
This is the 2010 update to the Harris (1996) catalog.
- 162
The web documentation contains the details of the data model. Moreover, the documentation communicates how data was flagged, including a brief list of changes relative to prior releases.
- 163
In this visualization, from the DistMass VAC to be released in 2022 that uses a Neural Net at the parameter level to determine spectroscopic distances.
- 164
- 165
- 166
- 167
For data access, see the following: https://fire.northwestern.edu/ananke/#dm.
- 168
Strictly Law et al. (2021b) describe the team-internal data release MPL-10, but these data are practically identical to the final public data release DR17 (which is the team-internal release MPL-11) in everything except the total number of galaxies.
- 169
- 170
MASTARHC2 was the second of two library versions based on hierarchical clustering (HC) of MaStar spectra . MASTARHC1 is also available from the DAP code repository, but it was only used in the processing for MPL-9.
- 171
- 172
- 173
- 174
- 175
- 176
For advice on using bitmasks, see https://www.sdss.org/dr17/algorithms/bitmasks.
- 177
- 178
- 179
- 180
- 181
This number differs from the total number of cubes listed in Table 1, as 538 data cubes did not run through the DAP for various reasons.
- 182
This corresponds to a value lower than 0.0084 in the "contamination" column, whose meaning is defined in Appendix D.8 of Yan et al. (2019). The threshold adopted here is 3 times larger than that in Yan et al. (2019). The threshold adopted by Yan et al. (2019) is more conservative for targeting purposes.
- 183
The measurements and cosmological impact are summarized in two web pages: https://www.sdss.org/science/final-bao-and-rsd-measurements/ and https://www.sdss.org/science/cosmology-results-from-eboss/.
- 184
- 185
- 186