


Abstract
We collected over 6000 high-resolution spectra of four dozen field RR Lyrae (RRL) variables pulsating either in the fundamental (39 RRab) or in the first overtone (9 RRc) mode. We measured radial velocities (RVs) of four strong metallic and four Balmer lines along the entire pulsational cycle and derived RV amplitudes with accuracies better than 1–2 km s−1. The new amplitudes were combined with literature data for 23 RRab and 3 RRc stars (total sample of 74 RRLs), which allowed us to investigate the variation of the Bailey diagram (photometric amplitude versus period) when moving from optical to mid-infrared bands and to recast the Bailey diagram in terms of RV amplitudes. We found that RV amplitudes for RRab are minimally affected by nonlinear phenomena (shocks) and multiperiodicity (Blazhko effect). The RV slope (logP–A(Vr)) when compared with the visual slope (logP–A(V)) is shallower, and the dispersion, at fixed period, decreases by a factor of two. We constructed homogeneous sets of horizontal branch evolutionary models and nonlinear, convective pulsation models of RRLs to constrain the impact of evolutionary effects on their pulsation properties. Evolution causes, on the Bailey diagram based on RV amplitudes, a modest variation in pulsation period and a large dispersion in amplitude. The broad dispersion in period of the Bailey diagram is mainly caused by variation in RRL intrinsic parameters (stellar mass, chemical composition). Empirical evidence indicates that RV amplitudes are an optimal diagnostic for tracing the mean effective temperature across the RRab instability strip.
Export citation and abstract BibTeX RIS
1. Introduction
The RR Lyrae (RRLs) are a very popular group of radial variables, because they can be easily identified thanks to the coupling between the pulsation periods (0.25 ≲ P ≲ 1.0 day) and the shapes of their light curves (da Costa et al. 2010; Monelli et al. 2017).
RRLs pulsate in three different flavors: fundamental (RRab), first overtone (RRc), and mixed mode (pulsating simultaneously in the fundamental and in the first overtone). The Bailey diagram (Bailey et al. 1919)—luminosity amplitude versus logarithmic period—is a fundamental plane to identify the RRL pulsation mode. In this plane RRc variables cover the short-period, low-amplitude domain, and the shape of their amplitude–period relationship displays either a "bell" or a "hairpin" shape (Bono et al. 2011; Kunder et al. 2013; Fiorentino et al. 2017). The RRab variables cover the long-period, large-amplitude area and display a well-defined decrease in luminosity amplitude as period increases.
The Bailey diagram has also been the crossroad of a long-standing astrophysical problem, the so-called Oosterhoff dichotomy, identified over 80 yr ago (Oosterhoff 1939). RRLs in globular clusters (GCs) can be split according to their mean periods in two groups: the Oosterhoff type I (OoI), with  ,
,  days, and the Oosterhoff type II (OoII), with
  ,
,  days. Subsequent investigations identified a similar dichotomic distribution for the RRc, albeit with a difference of only ∼0.05 days. Spectroscopic studies demonstrated that OoI GCs are more metal-rich and have a smaller ratio of RRc to the total number of RRLs than OoII GCs. More recently, Fabrizio et al. (2019) found a linear correlation between mean period and metallicity, thus, suggesting that this dichotomy is a natural consequence of the lack of Galactic, metal-intermediate GCs rich in RRLs.
RRL luminosity amplitudes steadily decrease when shifting to longer wavelengths. However, the amplitude attains an almost constant value at wavelengths longer than the K band. This behavior is caused by the fact that luminosity amplitudes in the optical bands are mainly driven by temperature variations, while in the near-infrared (NIR)/mid-infrared (MIR), they are mainly driven by radius variations (Madore et al. 2013; Neeley et al. 2017).
The Bailey diagram relies on two observables that are independent of distance and reddening. The RRL distribution in the Bailey diagram depends on their intrinsic parameters (stellar mass, luminosity, effective temperature) and chemical composition, but it is also affected by degeneracies caused by three different phenomena. (i) Secondary modulations. Empirical evidence suggests that a fraction of RRLs are affected by a secondary modulation (Blazhko effect, Blažko 1907) with a timescale ranging from tens of days to a few years. This fraction in large samples (in the Galactic bulge) ranges from ∼6% for RRc to ∼40% for RRab (Prudil & Skarka 2017; Netzel et al. 2018). This means that the position of an RRL in the Bailey diagram can change by several tenths of a magnitude along the Blazhko cycle. The Blazhko effect partially explains why the RRLs display, at fixed pulsation period and chemical composition, a well-defined intrinsic spread in luminosity amplitude. (ii) Evolutionary phase. RRLs are low-mass helium-burning stars, and during this evolutionary phase they evolve off the zero-age horizontal branch (ZAHB). In their evolution they experience changes both in effective temperature and in surface gravity. These changes cause a variation both in pulsation period and in luminosity amplitude. We still lack empirical evidence concerning the variation of the position in the Bailey diagram directly caused by evolutionary effects. (iii) Nonlinear phenomena. Theory and observations indicate that RRLs experience violent shocks approaching maximum compression (Preston et al. 2019). Shocks are strongly affected by the variation of the efficiency of convective motions (Bono & Stellingwerf 1994). This is the reason why RRab amplitudes display a steady decrease close to the red edge of the instability strip (IS; Bono et al. 1997; Braga et al. 2016).
The main aim of this investigation is to study the physical mechanisms affecting the distribution of RRLs in the Bailey diagram.
2. Spectroscopic and Photometric Data Sets
The largest and most homogeneous subsample of high-resolution (HR) spectra was collected with the Las Campanas Observatory du Pont echelle spectrograph. It includes 6206 HR (R ≡ λ/δλ = 35,000) spectra of 192 RRLs. Their typical signal-to-noise ratio (S/N), in the optical regime (λ = 5100 Å), is ∼40.
These spectra were augmented with 272 HR (R = 34,540–107,200, S/N ∼ 20; 68 RRLs) UVES@VLT spectra; 41 medium-resolution (R = 4,300–18,000, S/N ∼ 44; 18 RRLs) X-Shooter@VLT spectra; 166 HR (R = 115,000, S/N ∼ 10; 5 RRLs) HARPS@3.6 m spectra, and 55 HR (R = 48,000, S/N ∼ 4; 3 RRLs) FEROS@2.2 m (ESO, Chile) spectra.
Additionally we included HR spectra from SES@STELLA (15, R = 55,000, S/N ∼ 35; 1 RRL), HRS@SALT (82, R ∼ 40,000, S/N ∼ 50; 70 RRLs), and HARPS-N@TNG (10, R = 115,000, S/N ∼ 40; 4 RRLs).
In total we collected 6572 spectra for 316 RRLs. Among them, 48 RRLs have a good/optimal coverage of the pulsation cycle (6226 spectra). We label these variables as RV calibrators. These data were complemented with RV curves for 26 field and cluster RRLs available in the literature from Baade–Wesselink (BW) analyses (Storm et al. 1994; Bono et al. 2003). We ended up with a sample of 74 (62 RRab, 12 RRc) RV calibrators (see Table 1).
Table 1. Pulsation Properties for the Current RRLs
| Gaia DR2 ID | Classical ID | Typea | Period | A(V) | A(W1) | A(Vr)Fe | Flagb | A(Vr)Hα | A(Vr)Hβ | A(Vr)Hγ | A(Vr)Hδ |
|---|---|---|---|---|---|---|---|---|---|---|---|
| (days) | (mag) | (mag) | (km s−1) | (km s−1) | (km s−1) | (km s−1) | (km s−1) | ||||
| 15489408711727488 | X Ari | 0 | 0.65117537 | 0.96 | 0.32 | 58.2 ± 2.4 | 0 | 108.2 ± 4.4 | 85.1 ± 3.3 | 76.4 ± 3.0 | 66.5 ± 2.9 |
| 234108363683247616 | AR Per | 0 | 0.42556048 | 0.88 | 0.27 | 65.7 ± 5.1 | 1 | ... | ... | ... | ... |
| 630421935431871232 | RR Leo | 0 | 0.45240000 | 1.25 | 0.32 | 63.3 ± 6.8 | 1 | ... | ... | ... | ... |
| 886793515494085248 | RR Gem | 0 | 0.39730000 | 1.17 | 0.28 | 70.0 ± 11.3 | 1 | ... | ... | ... | ... |
| 1009665142487836032 | TT Lyn | 0 | 0.59744301 | 0.67 | 0.25 | 50.5 ± 3.1 | 1 | ... | ... | ... | ... |
| 1058066262817534336 | SU Dra | 0 | 0.66041178 | 0.98 | 0.28 | 57.6 ± 3.5 | 1 | ... | ... | ... | ... |
| 1191510003353849472 | AN Ser | 0 | 0.52207295 | 0.99 | 0.29 | 60.2 ± 3.8 | 0 | 94.5 ± 6.4 | 73.9 ± 5.2 | 70.5 ± 4.9 | 57.9 ± 3.8 |
| 1286188056265485952 | RS Boo | 0 | 0.37736549 | 1.04 | 0.25 | 67.1 ± 3.2 | 1 | ... | ... | ... | ... |
| 1360405567883886720 | Cl* NGC 6341 SAW V1 | 0 | 0.70279828 | 0.87 | 0.26 | 61.2 ± 4.9 | 1 | ... | ... | ... | ... |
| 1360408905076366208 | CSS J171712.0+431225 | 0 | 0.63746100 | 0.76 | 0.26 | 61.4 ± 3.9 | 1 | ... | ... | ... | ... |
| 1492230556717187456 | TV Boo | 1 | 0.31256000 | 0.63 | 0.12 | 35.0 ± 5.6 | 1 | ... | ... | ... | ... |
| 1683444631037761024 | SW Dra | 0 | 0.56967009 | 0.94 | 0.28 | 62.6 ± 4.5 | 1 | ... | ... | ... | ... |
| 1760981190300823808 | DX Del | 0 | 0.47261773 | 0.70 | 0.24 | 54.0 ± 3.2 | 0 | 94.1 ± 6.1 | 71.3 ± 4.1 | 66.3 ± 4.1 | 58.3 ± 3.6 |
| 1793460115244988800 | AV Peg | 0 | 0.39038090 | 1.01 | 0.28 | 63.4 ± 2.8 | 0 | 92.6 ± 4.4 | 74.4 ± 3.4 | 66.2 ± 3.3 | 59.8 ± 3.0 |
| 2381771781829913984 | DN Aqr | 0 | 0.63376712 | 0.74 | 0.24 | 54.6 ± 2.1 | 0 | 104.3 ± 4.0 | 79.6 ± 3.4 | 79.6 ± 3.5 | 63.8 ± 3.0 |
| 2414817603803476864 | UU Cet | 0 | 0.60610163 | 0.60 | 0.23 | 53.0 ± 3.8 | 1 | ... | ... | ... | ... |
| 2558296724402139392 | RR Cet | 0 | 0.55302505 | 0.90 | 0.28 | 60.1 ± 3.1 | 0 | 106.2 ± 5.5 | 84.1 ± 4.3 | 81.2 ± 4.3 | 68.7 ± 3.6 |
| 2689556491246048896 | SW Aqr | 0 | 0.45930070 | 1.24 | 0.31 | 61.9 ± 1.8 | 0 | 105.1 ± 3.3 | 82.7 ± 2.6 | 79.5 ± 2.6 | 64.8 ± 2.3 |
| 2720896455287475584 | DH Peg | 1 | 0.25551624 | 0.50 | 0.10 | 25.4 ± 1.8 | 1 | ... | ... | ... | ... |
| 2857456207478683776 | SW And | 0 | 0.44230000 | 0.92 | 0.27 | 62.5 ± 4.6 | 1 | ... | ... | ... | ... |
| 2981136563930816128 | RX Eri | 0 | 0.58725159 | 0.87 | 0.28 | 60.3 ± 4.5 | 1 | ... | ... | ... | ... |
| 3479598373678136832 | DT Hya | 0 | 0.56798140 | 0.95 | 0.27 | 61.8 ± 3.1 | 0 | 109.9 ± 5.7 | 83.7 ± 4.3 | 78.1 ± 4.2 | 70.9 ± 3.7 |
| 3535368455297644928 | ASAS J110522−2641.0 | 1 | 0.29445920 | 0.33 | ... | 14.3 ± 1.7 | 0 | 16.4 ± 2.2 | ... | ... | ... |
| 3546458301374134528 | W Crt | 0 | 0.41201190 | 1.36 | 0.32 | 66.1 ± 2.5 | 0 | 101.9 ± 4.4 | 83.9 ± 3.7 | 77.1 ± 3.3 | 66.6 ± 2.9 |
| 3604450388616968576 | AM Vir | 0 | 0.61510000 | 0.66 | 0.25 | 59.0 ± 2.5 | 0 | 98.1 ± 4.2 | 81.1 ± 3.6 | 77.3 ± 3.5 | 63.2 ± 2.8 |
| 3626569264033312896 | AS Vir | 0 | 0.55341000 | 0.63 | 0.22 | 59.1 ± 2.0 | 0 | 85.2 ± 2.9 | 77.2 ± 2.7 | 74.6 ± 2.8 | 65.7 ± 2.5 |
| 3652665558338018048 | ST Vir | 0 | 0.41080754 | 1.22 | 0.33 | 60.3 ± 3.4 | 0 | 97.9 ± 5.8 | 72.2 ± 4.4 | 78.5 ± 4.8 | 61.2 ± 4.0 |
| 3698725337375614464 | UU Vir | 0 | 0.47560267 | 1.10 | 0.30 | 67.8 ± 3.1 | 0 | 114.4 ± 7.2 | 91.7 ± 4.6 | 83.6 ± 4.3 | 74.9 ± 3.6 |
| 3797319369672686592 | SS Leo | 0 | 0.62632619 | 1.09 | 0.30 | 62.5 ± 2.0 | 0 | 97.2 ± 4.0 | 83.8 ± 3.0 | 80.9 ± 3.1 | 71.4 ± 2.8 |
| 3846786226007324160 | T Sex | 1 | 0.32468493 | 0.42 | 0.08 | 27.0 ± 2.3 | 1 | ... | ... | ... | ... |
| 3915998558830693888 | ST Leo | 0 | 0.47797595 | 1.23 | 0.31 | 64.0 ± 4.3 | 0 | 112.4 ± 7.6 | 82.9 ± 5.4 | 85.0 ± 6.1 | 65.3 ± 4.9 |
| 4022618712476736896 | TU UMa | 0 | 0.55690000 | 0.96 | 0.28 | 60.6 ± 4.3 | 1 | ... | ... | ... | ... |
| 4055098870077726976 | V0494 Sco | 0* | 0.42727100 | 0.87 | 0.20 | 44.5 ± 1.7 | 0 | 68.6 ± 3.1 | 53.5 ± 2.5 | 53.7 ± 2.4 | 45.7 ± 2.4 |
| 4352084489819078784 | V0445 Oph | 0 | 0.39702600 | 0.77 | 0.26 | 57.4 ± 4.6 | 0 | 91.1 ± 7.1 | 68.6 ± 5.1 | 61.6 ± 5.1 | 58.8 ± 4.8 |
| 4417888542753226112 | VY Ser | 0 | 0.71410000 | 0.65 | 0.25 | 53.3 ± 4.3 | 0 | 90.6 ± 6.3 | 76.3 ± 11.2 | 74.2 ± 6.5 | 69.2 ± 6.0 |
| 4421571803630954752 | CSS J151841.9+020232 | 0 | 0.54625080 | 0.65 | 0.26 | 51.8 ± 3.8 | 1 | ... | ... | ... | ... |
| 4421571803630958848 | Cl* NGC 5904 SAW V28 | 0 | 0.54383658 | 0.71 | ... | 60.9 ± 4.7 | 1 | ... | ... | ... | ... |
| 4433070255716036864 | ASAS J162158+0244.5 | 1 | 0.32362580 | 0.41 | 0.09 | 20.2 ± 2.3 | 0 | 29.2 ± 3.2 | 29.0 ± 3.8 | ... | ... |
| 4454183799545435008 | AT Ser | 0 | 0.74655408 | 0.89 | 0.26 | 56.8 ± 4.1 | 0 | 99.8 ± 7.8 | 77.2 ± 5.6 | 77.0 ± 5.7 | 70.0 ± 5.4 |
| 4467433017735910912 | VX Scl | 0 | 0.45518030 | 1.28 | 0.33 | 60.6 ± 3.9 | 0 | 105.9 ± 7.1 | 81.0 ± 5.3 | 74.7 ± 5.0 | 64.9 ± 4.5 |
| 4596935593202765184 | TW Her | 0 | 0.39959577 | 1.33 | 0.33 | 68.3 ± 4.7 | 1 | ... | ... | ... | ... |
| 4689637956899105792 | Cl* NGC 104 SAW V9 | 0 | 0.73720048 | 1.06 | ... | 57.0 ± 5.3 | 1 | ... | ... | ... | ... |
| 4709830423483623808 | W Tuc | 0 | 0.64224028 | 1.14 | 0.31 | 63.7 ± 2.9 | 0 | 114.0 ± 5.8 | 79.9 ± 4.1 | 80.0 ± 4.0 | 66.2 ± 3.2 |
| 4860671839583430912 | SX For | 0 | 0.60534530 | 0.66 | ... | 51.9 ± 2.9 | 0 | 93.5 ± 5.9 | 70.6 ± 4.3 | 66.6 ± 3.8 | 61.4 ± 3.7 |
| 4947090013255935616 | CS Eri | 1 | 0.31133020 | 0.52 | ... | 28.9 ± 4.0 | 0 | 48.6 ± 3.9 | 34.7 ± 3.0 | 33.8 ± 2.9 | 28.2 ± 2.6 |
| 5022411786734718208 | SV Scl | 1 | 0.37735860 | 0.51 | ... | 26.1 ± 2.1 | 0 | 42.2 ± 3.2 | 30.6 ± 2.6 | 29.4 ± 2.6 | 24.0 ± 2.6 |
| 5151789464548893184 | RV Cet | 0* | 0.61802300 | 0.57 | ... | 49.8 ± 2.3 | 0 | 89.3 ± 4.3 | 70.1 ± 3.3 | 65.6 ± 3.0 | 57.9 ± 2.7 |
| 5412243359495900928 | CD Vel | 0 | 0.57350788 | 0.86 | 0.27 | 52.5 ± 1.8 | 0 | 96.6 ± 4.1 | 74.0 ± 2.0 | 69.8 ± 2.8 | 60.7 ± 2.5 |
| 5461994297841116160 | WY Ant | 0 | 0.57434364 | 0.92 | 0.27 | 60.6 ± 2.9 | 0 | 106.5 ± 5.6 | 83.3 ± 4.4 | 77.1 ± 4.2 | 66.5 ± 3.7 |
| 5510293236607430656 | HH Pup | 0 | 0.39081190 | 1.22 | 0.32 | 67.9 ± 2.6 | 0 | 109.3 ± 4.3 | 81.4 ± 3.3 | 78.1 ± 3.4 | 68.9 ± 2.9 |
| 5707380936404638336 | BB Pup | 0 | 0.48055043 | 0.88 | 0.29 | 64.8 ± 4.8 | 1 | ... | ... | ... | ... |
| 5768557209320424320 | UV Oct | 0* | 0.54257500 | 0.80 | 0.27 | 57.1 ± 1.1 | 0 | 90.3 ± 2.0 | 73.5 ± 1.6 | 73.0 ± 1.8 | 62.3 ± 1.7 |
| 5769986338215537280 | RV Oct | 0 | 0.57117800 | 1.05 | 0.30 | 65.1 ± 2.3 | 0 | 103.9 ± 3.6 | 82.7 ± 2.9 | 81.9 ± 3.0 | 70.1 ± 2.7 |
| 5773390391856998656 | XZ Aps | 0 | 0.58726739 | 1.15 | 0.29 | 63.0 ± 1.8 | 0 | 102.0 ± 3.2 | 81.7 ± 2.5 | 79.3 ± 2.7 | 65.1 ± 2.5 |
| 5806921716937210496 | BS Aps | 0 | 0.58256590 | 0.76 | 0.24 | 51.1 ± 1.7 | 0 | 85.2 ± 3.2 | 67.1 ± 2.5 | 62.0 ± 2.3 | 56.4 ± 2.3 |
| 5947570591534602240 | S Ara | 0* | 0.45184650 | 0.96 | 0.29 | 60.6 ± 2.0 | 0 | ... | 82.1 ± 3.0 | 77.9 ± 2.8 | 66.7 ± 2.5 |
| 6045464303643755008 | Cl* NGC 6121 SAW V2 | 0 | 0.53568150 | 0.92 | ... | 54.1 ± 6.5 | 1 | ... | ... | ... | ... |
| 6045485228725626752 | Cl* NGC 6121 SAW V32 | 0 | 0.57909353 | 0.75 | 0.25 | 61.0 ± 6.8 | 1 | ... | ... | ... | ... |
| 6045491928874778624 | Cl* NGC 6121 SAW V33 | 0 | 0.61484317 | 0.85 | 0.31 | 55.8 ± 8.3 | 1 | ... | ... | ... | ... |
| 6045502305516138368 | Cl* NGC 6121 SAW V15 | 0 | 0.44379722 | 1.20 | 0.30 | 43.7 ± 6.0 | 1 | ... | ... | ... | ... |
| 6473212809741024256 | ASAS J200431−5352.3 | 1 | 0.30022700 | 0.28 | ... | 14.2 ± 1.9 | 0 | 16.1 ± 1.9 | 13.2 ± 2.2 | 15.4 ± 2.2 | 14.1 ± 2.3 |
| 6483680332235888896 | V Ind | 0 | 0.47959915 | 1.12 | 0.29 | 56.2 ± 1.2 | 0 | 101.7 ± 2.6 | 77.9 ± 2.0 | 73.8 ± 2.0 | 61.9 ± 1.7 |
| 6526559499016401408 | RV Phe | 0 | 0.59641862 | 0.67 | 0.25 | 54.6 ± 4.8 | 1 | ... | ... | ... | ... |
| 6541769554459131648 | BO Gru | 1 | 0.28272000 | 0.18 | ... | 13.7 ± 1.5 | 0 | 16.0 ± 2.3 | 12.2 ± 2.3 | 15.6 ± 2.6 | 12.7 ± 2.6 |
| 6570585628216929408 | TY Gru | 0 | 0.57006515 | 0.91 | 0.27 | 59.2 ± 2.1 | 0 | 112.8 ± 4.7 | 82.5 ± 3.3 | 76.2 ± 3.2 | 64.6 ± 3.2 |
| 6625215584995450624 | AE PsA | 0 | 0.54674000 | 1.13 | 0.32 | 65.1 ± 6.5 | 0 | 102.3 ± 8.7 | 76.6 ± 7.0 | 79.1 ± 7.6 | 64.5 ± 6.2 |
| 6662886605712648832 | MT Tel | 1 | 0.31689945 | 0.55 | 0.13 | 22.4 ± 1.4 | 0 | 35.6 ± 1.9 | 27.0 ± 1.6 | 26.0 ± 2.3 | 21.7 ± 1.9 |
| 6680420204104678272 | V1645 Sgr | 0 | 0.55292000 | 0.76 | 0.24 | 50.9 ± 1.9 | 0 | 74.0 ± 2.8 | 66.2 ± 2.5 | 65.8 ± 2.7 | 56.5 ± 2.4 |
| 6701821205809488384 | ASAS J181215−5206.9 | 0 | 0.83753980 | 0.52 | 0.20 | 42.6 ± 5.6 | 0 | ... | 72.0 ± 9.5 | 61.3 ± 8.2 | 54.2 ± 7.4 |
| 6771307454464848768 | V0440 Sgr | 0 | 0.47750000 | 0.77 | 0.30 | 62.7 ± 5.1 | 0 | 113.2 ± 8.9 | 84.0 ± 6.5 | 76.5 ± 6.4 | 67.1 ± 5.2 |
| 6787617919184986496 | Z Mic | 0 | 0.58692775 | 0.64 | 0.22 | 53.2 ± 1.8 | 0 | 92.1 ± 3.7 | 74.3 ± 3.0 | 69.3 ± 2.8 | 61.7 ± 2.6 |
| 6856027093125912064 | ASAS J203145−2158.7 | 1 | 0.31071060 | 0.37 | 0.08 | 22.0 ± 2.0 | 0 | 29.7 ± 2.8 | 24.3 ± 2.6 | 21.1 ± 2.5 | 24.6 ± 4.2 |
| 6883653108749373568 | RV Cap | 0* | 0.44774990 | 0.97 | ... | 49.9 ± 2.0 | 0 | 90.8 ± 3.6 | 72.7 ± 3.1 | 62.4 ± 2.7 | 59.2 ± 2.7 |
| 6884361748289023488 | YZ Cap | 1 | 0.27345290 | 0.49 | 0.10 | 26.3 ± 2.1 | 0 | 35.8 ± 3.0 | 28.3 ± 2.8 | 29.1 ± 2.9 | 23.2 ± 2.6 |
Notes.
aPulsation mode: 0 = RRab; 1 = RRc. Candidate Blazhko RRLs are marked with an asterisk. bRV amplitudes: 0 = current investigation; 1 = BW sample.The periods from the literature are usually precise enough to provide good phasing of the RV curves. However, we derived the pulsation period from RV measurements for 2 RRab and 1 RRc. We adopted Gaia G-band amplitudes (Gaia Collaboration et al. 2018; Marrese et al. 2019) transformed into the V band by using the equations provided by Evans et al. (2018). We also used V-band photometry from ASAS (Pojmanski 2002), ASAS-SN (Shappee et al. 2014; Jayasinghe et al. 2018), and from Catalina (Drake et al. 2013a, 2013b; Torrealba et al. 2015).
The optical photometry was combined with MIR W1-band photometry collected with NEOWISE (Mainzer et al. 2011). The MIR light curves have very good phase coverage (∼120 phase points), and good photometric precision (σW1 ≤0.05 mag). Optical and MIR light curves were fitted with analytical functions (splines, PLOESS, Fourier parameters) following the same approach by Braga et al. (2018). The photometric amplitudes are based on the analytical fits.
3. Radial Velocity Measurements
To measure RVs we chose three Fe i lines, from the multiplet 43, at λ = 4045.81, 4063.59, 4071.74 Å and the Sr ii line at λ = 4077.71 Å. These metallic lines were strong enough to be easily identified in most spectra even at very low S/N or very high effective temperatures, enabling us to trace the whole pulsation cycle using individual spectra, i.e., without coadding spectra. We also used four Balmer lines (Hα, Hβ, Hγ, Hδ, λ = 6562.80, 4861.36, 4340.46, 4101.74 Å). The RVs were measured following the same approach employed by Fabrizio et al. (2011).
Figure 1 shows RV curves for the RRab, V Ind, and the RRc, MT Tel. The RV measurements plotted in this figure display the expected difference between metallic and Balmer lines (Preston 1959); the RV amplitudes for the latter ones are systematically larger (see also Figure 9 of Chadid et al. 2017 for montages of RV and photometric phase plots). The difference is caused by the physical conditions at which the different lines form: the smaller the optical depth, the larger the RV amplitude. The difference among Hα and metallic lines ranges from 50% for MT Tel to almost a factor of two for V Ind. In spite of the difference in amplitude, the secondary features (bumps, dips) appear to be largely co-phased.
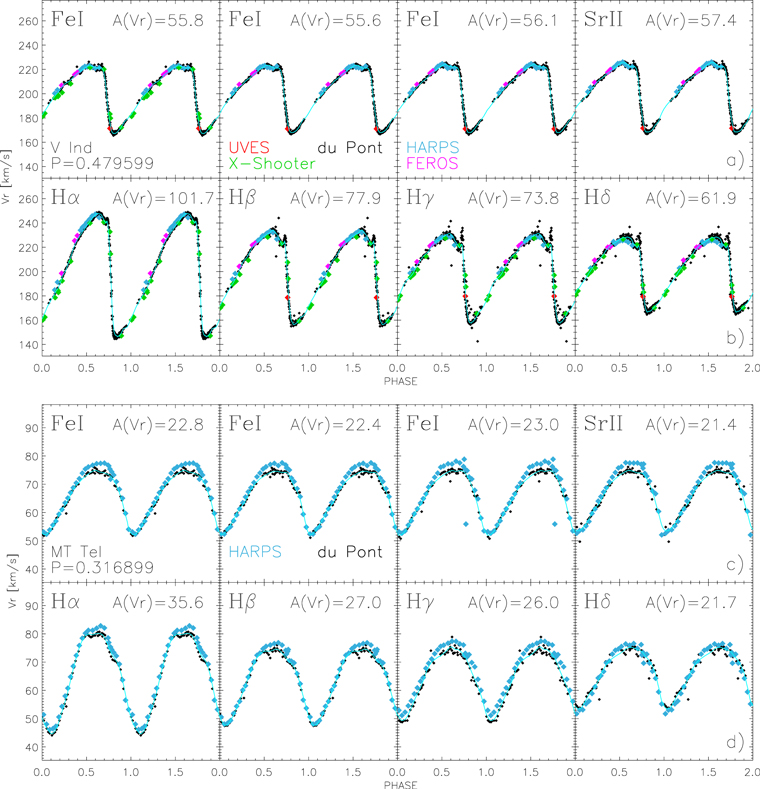
Figure 1. Panels (a) and (b): radial velocity curves vs. phase for the RRab V Ind based on metallic lines Fe i (λ: 4045.81, 4063.59, 4071.74 Å) and Sr ii (λ: 4077.71 Å), and on Balmer (λ: 6562.80, 4861.36, 4340.46, 4101.74 Å) lines. Measurements based on different spectrographs are marked with different colors. The cyan lines show the analytical fits. The RV amplitude (A(Vr) km s−1) and the pulsation period (days) are also labeled. Panels (c) and (d): same as the top, but for the RRc MT Tel.
Download figure:
Standard image High-resolution imageWe analytically fit the RV curves by using the PLOESS algorithm (Braga et al. 2018). The cyan lines in Figure 1 show these curves. Note that RVs for V Ind based on Hγ show a well-defined "spike" around phases 0.70–0.76, near its point of minimum radius, as implied by the optical and MIR light curves of this star in the top panels of Figure 2.
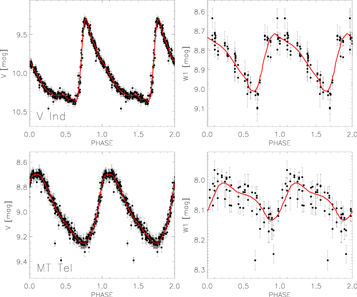
Figure 2. Top: optical (V, left) and MIR (W1, right) light curves for the RRab V Ind. The optical data were provided by ASAS-SN (Shappee et al. 2014; Jayasinghe et al. 2018), while the MIR ones by NEOWISE (Mainzer et al. 2011). The thin red lines show the analytical fits. Bottom: same as the top, but for the RRc MT Tel.
Download figure:
Standard image High-resolution imageThis secondary spike feature was predicted by pulsation models (see Figures 3 and 16 in Bono & Stellingwerf 1994 and Figure 12 in Marconi et al. 2015) suggesting that it is associated with the formation and propagation of shocks. Note that the duration of the spike is ∼25 minutes and we succeeded in tracing it only because the du Pont spectra were collected with exposure times of 400 ± 200 s. Moreover, exposure times for V Ind are ≈30% shorter than the mean, since it has a brighter mean visual magnitude (V = 9.92 ± 0.05 mag). A similar feature is also present among other Balmer (mainly Hβ, Hδ) and metallic (mainly Sr) lines, but it is less pronounced.
Note that the absolute minimum in RV for V Ind takes place, due to the phase lag (Castor 1971), at the same phases of the absolute maximum in the light curves. However, the absolute minimum in luminosity is not at the same phases of the absolute maximum in RV. Indeed, the latter takes place around the phases in which the optical light curves show a well-defined bump. The difference appears to be caused by the interplay between the shock propagation and the increased efficiency of the convective transport in approaching the phases of minimum radius.
The RV curve of MT Tel is smoother than that of V Ind over the entire pulsation cycle. For this variable we have extensive measurements from both du Pont and HARPS spectrographs. Inspection of panels (c) and (d) of Figure 1 reveals that the RV amplitude from the HARPS data set is ∼2–3 km s−1 larger than that from du Pont. MT Tel is the only variable for which we found such a difference. We performed a number of tests that verified the reality of this offset. It cannot be caused by phasing problems, since the combined optical and NIR photometry allowed us very accurate phasing of the two data sets. The analytical fit displayed in Figure 1 is mainly following the du Pont measurements, because they have a more uniform sampling over the pulsation cycle. We suggest that the difference is intrinsic and possibly caused by the presence of a secondary modulation (Blazhko effect), even though the light curves do not show yet a clear modulation at fixed phase. Note that HARPS spectra were collected in a single night seven years before the du Pont spectra (over five consecutive nights) and the periodogram lacks relevant secondary peaks. This finding would suggest that accurate RV measurements might have a stronger sensitivity in detecting secondary modulations and in constraining the tomography of variable star atmospheres. In the next paper we will explore more aspects of these interesting issues.
4. Results
We have investigated on a more quantitative basis the variation of the luminosity amplitudes when moving from optical to MIR, and to RV amplitudes and when moving from weak to strong lines. In Figure 3 we show the Bailey diagram for the RRLs for which we estimated both luminosity and velocity amplitudes. Panels (a) and (b) display quite clearly that the luminosity amplitudes in the W1 band are roughly a factor of 3 smaller than in the V band. This trend is expected because the luminosity variation in the former band is mainly driven by temperature variations, while in the latter it is mainly driven by radius variations. Amplitude dispersion at fixed pulsation period also is smaller in the infrared. It is of the order of 20% for the V band (σV ∼ 0.19 mag), while for the W1 band it decreases to 10% (σW1 ∼ 0.03 mag). This outcome applies to both RRab and RRc variables and suggests that the dispersion is driven by phenomena affecting the temperature variation along the pulsation cycle. Moreover, Blazhko RRLs (black crosses) in our sample display a variation in the visual band of ∼0.4 mag and of ≈0.1 mag in the W1 band (Jurcsik et al. 2018).
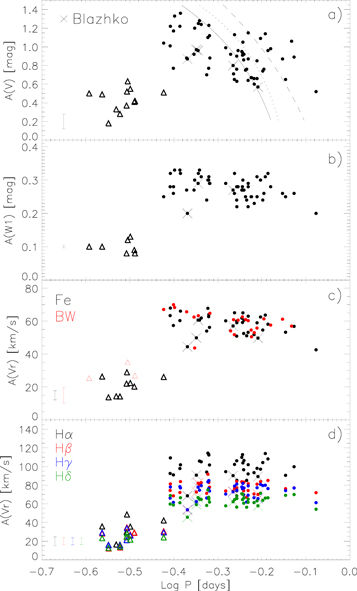
Figure 3. Bailey diagram, amplitude vs. logarithmic period. Panels (a) and (b) display the luminosity amplitude in the visual and in the W1 band. The black lines display observed relations for OoI (solid), Oo-intermediate (dotted) and OoII (dashed) RRLs provided by Fabrizio et al. (2019). Panels (c) and (d) show RV amplitudes based either on metallic or on Balmer lines. The red symbols plotted in panel (c) display BW RRLs. Hydrogen RV amplitudes are plotted with different colors (panel (d)). Blazhko RRLs are marked with crosses. The error bars plotted in the bottom left corner display uncertainties in amplitudes.
Download figure:
Standard image High-resolution imageNote that the current sample is quite representative of the RRL pulsation properties; indeed, the analytical relations for OoI, Oosterhoff-intermediate, and OoII RRLs (Fabrizio et al. 2019) provide a plausible fit of optical amplitudes.
Figures 3(c) and (d) display, for the first time, a Bailey diagram based on RV amplitudes. In panel (c) together with the current velocity amplitudes we also included the velocity amplitudes for field and cluster RRLs (red symbols) for which a BW solution is available in the literature. Interestingly, the relative dispersion in RV amplitudes is smaller than for visual amplitudes. Indeed, the RV amplitudes are purely tracing the radius variation along the pulsation cycle. The result is quite clear for RRab for which we find that the dispersion is of the order of 10% (σVr ∼ 6 km s−1). Moreover, Blazhko RRLs show a variation in velocity amplitude significantly smaller (∼20%) than in visual amplitude (∼40%). Unfortunately, we cannot reach firm conclusions concerning RRc, since the sample is too small.
Figure 3(d) also shows an interesting trend. The velocity amplitudes for RRab variables based on Balmer lines attain an almost constant value when moving from the hot (short-period) to the cool (long-period) edge of the fundamental IS. The mean RV amplitudes decrease from Hα to Hδ, but their values are constant over the entire period range. The dispersion is also modest and ranges from 5 to 11 km s−1.
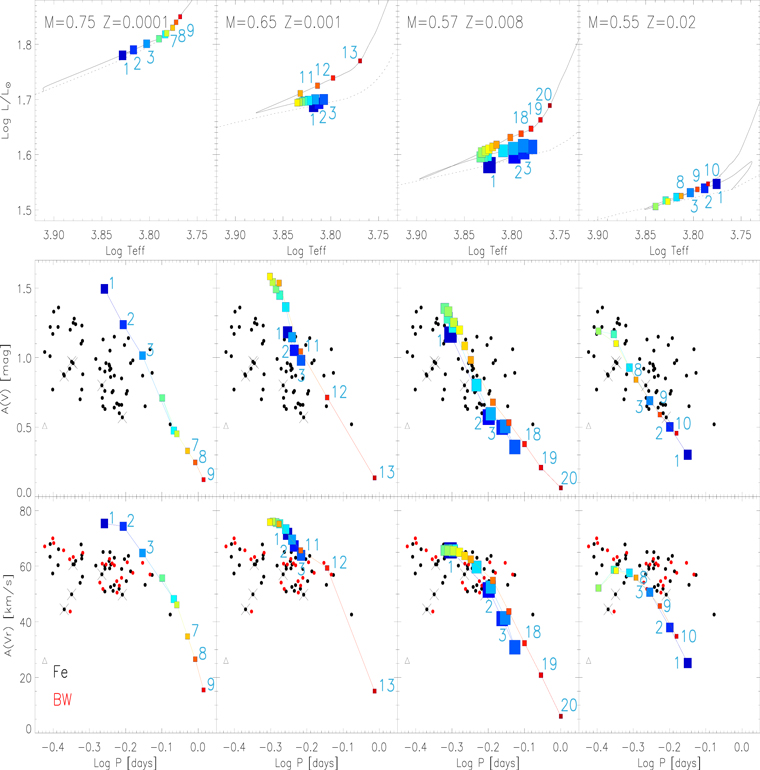
The RV amplitudes plotted in Figures 3(c) and (d) clearly show that the dispersion, at fixed period, is significantly larger than intrinsic errors; thus, suggesting that other physical mechanisms can contribute to the observed dispersion. To investigate this intrinsic property quantitatively, we constructed four HB models covering a broad range in chemical compositions (Z = 0.0001, 0.001, 0.008, 0.02; Y = 0.245, 0.245, 0.256, 0.27). The stellar masses (M = 0.75, 0.65, 0.57, 0.55 M⊙) were selected to be centrally located inside the IS. The reason for this broad range in metallicity was driven by the relevant change in the evolutionary path inside the IS when moving from metal-poor to metal-rich stellar structures. We also constructed, following Marconi et al. (2015), a set of nonlinear, convective hydrodynamical models of RRL stars along the HB evolutionary models to investigate the variation of the pulsation properties in their off-ZAHB evolution.
The top panels of Figure 4 show small Hertzsprung–Russell diagram regions of the HB evolutionary models (black lines) together with the variable models that are pulsationally stable. The color and the size of the symbols change along the off-ZAHB evolution.
Figure 4. Top: Hertzsprung–Russell diagram for HB models (Pietrinferni et al. 2006) constructed by assuming different chemical compositions and stellar masses (see labeled values). The symbols mark the position of the pulsation models we constructed by using evolutionary prescriptions (chemical composition, stellar mass, luminosity, effective temperature). The light blue numbers mark the first three and the last three models in the sequence of pulsation models. The symbols are large and bluish close to the ZAHB and become smaller and greenish–reddish along the off-ZAHB evolution. Middle: Bailey diagram for visual amplitudes. The symbols are the same as in the top panels and they are connected with solid lines following the same color-coding. Bottom: Bailey diagram for RV amplitudes based on metallic lines. The red symbols display BW RRLs.
Download figure:
Standard image High-resolution image
As expected, the evolution across the IS changes significantly when moving from the metal-poor to the metal-rich regime. Indeed, for the most metal-poor chemical composition the off-ZAHB evolution is redward, i.e., HB models become systematically brighter and cooler as a function of time. The evolutionary path becomes more complex at metal-intermediate regime, because the evolutionary path undergoes, in sequence, a redward, a blueward and eventually a redward evolution approaching its asymptotic giant branch track. This means that we are dealing with triple points, i.e., evolutionary phases covering the same range in effective temperature, but slightly different luminosities (Δ Log L/L⊙ ∼ 0.07, Z = 0.0001; ∼0.09, Z = 0.001; ∼0.11, Z = 0.008; ∼0.05, Z = 0.02). This means a steady decrease in surface gravity and, in turn, a steady increase in pulsation period.
The change in the physical structure also implies variation in the pulsation properties. The middle and the bottom panels of Figure 4 display the comparison between observed and predicted amplitudes. This is the first time that evolutionary effects are investigated in detail along the off-ZAHB evolution. A glance at the data plotted in this figure shows that the models, when moving from metal-poor to metal-rich structures, attain, as expected, shorter periods and larger amplitudes. Interestingly enough, the most metal-poor models display a steady decrease in amplitude when moving from hotter to cooler effective temperatures. Note that the smaller the symbols, the faster the evolutionary phase. This means that the lack of long-period small amplitude RRLs is a mix between the probability of finding them and the sample size.
The comparison between theory and observations becomes even more interesting in the metal-intermediate and in the metal-rich regimes, because pulsation models associated with blueward and redward evolutionary phases attain very similar values in the Bailey diagram. This means that RRLs in their off-ZAHB evolution move back and forth in the Bailey diagram covering a modest range in period, but a large range in amplitude. This indicates that a significant fraction of the dispersion in the Bailey diagram is caused by the evolutionary status of RRLs. Theory and observations agree quite well over the entire metallicity range. Note that predicted amplitudes are affected by uncertainties in the mixing length parameter adopted to treat time-dependent convective transport in hydrodynamical models of radial variables (Bono & Stellingwerf 1994). However, we are using predicted amplitudes in the relative sense, i.e., we are interested in the variation of the pulsation amplitudes when moving from the blue to the red edge of the IS and not in their absolute value.
The comparison in the Bailey diagram for RV amplitudes shows similar results. Note that to compare theory and observations we adopted a projection factor, the ratio between pulsation velocity and RV, p = 1.33 (Jones et al. 1992). The comparison in this plane is even more compelling because RV amplitudes are marginally affected by nonlinear phenomena and by secondary modulations. Interestingly, predicted and observed velocity amplitudes display a quadratic variation when moving from the blue to the red edge of the IS, while the luminosity amplitudes show a more linear trend.
5. Conclusions
We investigated the properties of the Bailey diagram based on luminosity (optical/MIR) and on RV amplitudes. We collected homogeneous RV measurements for four dozen of field RRLs. The current measurements double the sample of RRLs with a good coverage of the entire pulsation cycle. We investigated the dependence of luminosity amplitudes on nonlinear phenomena, secondary modulations, and evolutionary effects. The impact of these effects is mitigated when moving from the visual to the MIR bands, because the variations along the pulsation cycle are mainly driven by radius than by temperature changes. This trend becomes even more compelling in dealing with RV amplitudes; indeed, we found that the dispersion, at fixed period, is systematically smaller when compared with luminosity amplitudes. Moreover, Blazhko RRLs display smaller variations in velocity amplitudes than in luminosity amplitudes.
We constructed four different HB evolutionary models covering a broad range in metal contents (Z = 0.0001, 0.001, 0.008, 0.02; Y = 0.245, 0.245, 0.256, 0.27) and a sizable sample of nonlinear, convective hydrodynamical models of RRLs to constrain the impact of the off-ZAHB evolution on their pulsation properties. We found that evolutionary effects take account of the vertical structure (dispersion in amplitude) of the Bailey diagram based on RV amplitudes. Thus, we suggest that the dispersion in period is mainly caused by variation in the intrinsic parameters of RRLs (stellar mass, chemical composition).
The current findings are suggesting that RV amplitudes are not only independent of distance and reddening, but also less prone to amplitude variations caused by nonlinear phenomena and secondary modulations. This means that RV amplitudes are an optimal diagnostic for the variation of the mean effective temperature across the IS of RRab.
We thank an anonymous referee for constructive suggestions on an early draft of this Letter. We acknowledge financial support from INAF/ASI 2014-049-R.0 (SSDC), US NSF under grants AST-1714534 (M.M., J.P.M.) and AST-1616040 (C.S.), and DFG for SFB 881 (Project-ID 138713538; B.L., E.K.G.). Some of the observations were obtained with SALT. This publication uses NEOWISE data (JPL/Caltech, University of Arizona, NASA).