


Abstract
We identify IRAS 16115−5044, which was previously classified as a protoplanetary nebula (PPN), as a candidate luminous blue variable (LBV). The star has high luminosity (≳105.75 L⊙), ensuring supergiant status, has a temperature similar to LBVs, is photometrically and spectroscopically variable, and is surrounded by warm dust. Its near-infrared spectrum shows the presence of several lines of H i, He i, Fe ii, Fe [ii], Mg ii, and Na i with shapes ranging from pure absorption and P Cygni profiles to full emission. These characteristics are often observed together in the relatively rare LBV class of stars, of which only ≈20 are known in the Galaxy. The key to the new classification is the fact that we compute a new distance and extinction that yield a luminosity significantly in excess of those for post-AGB PPNe, for which the initial masses are <8 M⊙. Assuming single star evolution, we estimate an initial mass of ≈40 M⊙.
Export citation and abstract BibTeX RIS
1. Introduction
Luminous blue variables (LBVs) have a distinct set of observed characteristics (Conti 1984). They have luminosities of supergiants, temperatures above 10 kK, nonperiodic variability, and evidence of eruptions vis-à-vis circumstellar ejecta (e.g., Clark et al. 2005). They are inferred to be post-main-sequence descendants of massive stars (Meynet et al. 2011). Their spectrophotometric variations are on the order of 1–2 mag over timescales of years at roughly constant bolometric luminosity. During giant eruptions, their brightness changes by up to 3 mag (e.g., van Genderen et al. 1997). They are often surrounded by ionized gas and warm dust, both evidence of past eruptions (Clark et al. 2005). The archetypal example, LBV η Car, is surrounded by the Homunculus, material inferred to have been ejected by the star during the great eruption starting in 1837 (Smith & Owocki 2006). These eruptions carry with them an extraordinary amount of material, such as the ≈10–20 M⊙ of material surrounding the η Car (Smith & Ferland 2007). The effective mass-loss rates during these eruptions is extraordinarily high, such as up to ∼1 M⊙ yr−1 for η Car during its great eruption. Their evolutionary paths in the Hertzsprung–Russell (HR) diagram are uncertain, due in part to poor statistics, but they are clearly near, or sometimes even above, the Humphreys–Davidson limit (Humphreys & Davidson 1994). There are approximately 20 known LBVs in the Galaxy and a similar number of candidates (Smith et al. 2019). LBVs may be progenitors of at least some supernovae (see Smith et al. 2011; Burgasser et al. 2012; Dessart et al. 2015), and Allan et al. (2020) argue that an LBV directly collapsed to a black hole.
In this Letter, we demonstrate that IRAS 16115−5044 (G332.2843-00.0002) has all the characteristics of LBVs, confirming the claim in Messineo et al. (2020). Located in a complex region containing many massive stars and compact objects (Messineo et al. 2020), the star was previously classified as a protoplanetary nebula (PPN; Weldrake et al. 2003), an evolved post-AGB star having initial mass less than 8 M⊙. We argue that it is more appropriately identified as an LBV, similar to how He 3-519 and the Pistol star were reclassified from PPNe to LBVs (Figer et al. 1998). In this Letter, we review available observations, current newly reduced spectra, and reinterpret the nature of this star. In Section 2, we present photometry from the literature and newly reduced spectroscopy. In Section 3, we estimate the distance. In Section 4, we describe and characterize the dusty nebula. In Section 5, we estimate the extinction. In Section 6, we estimate the stellar luminosity. In Section 7, we compare the star to other LBVs.
2. Data
2.1. Spectra from the Literature
Suárez et al. (2006) obtained an optical spectrum of the star in 1990 June using the 1.5 m ESO telescope. They were searching for planetary nebulae (PNe), and categorized IRAS 16115−5044 as a "young" star. The spectrum has an emission line (see their Figure D.1), but we suspect that the object might have been misidentified. Note that the object is expected to have V ≳ 21, given that it has G = 14.6 from Gaia and G − J ∼ 7, and such an object would be a challenge to observe with a 1.5 m telescope.
Oudmaijer et al. (1995) published a K-band spectrum with relatively low signal-to-noise ratio (S/N) of the object. It appeared featureless in the narrow wavelength range they covered (2.2–2.4 μm), except perhaps for a Mg ii line near 2.40 μm. Several years later, Weldrake et al. (2003) observed IRAS 16115−5044 at infrared wavelengths, assigning a spectral type of B4Ie and a wind outflow velocity of 300 km s−1. They identified emission lines in the hydrogen Paschen and Bracket series, as well as from Fe ii at 2.089 μm, Mg ii at 2.138 and 2.144 μm, and Na i at 2.206 and 2.209 μm.
2.2. New Spectra
Figure 1 shows two observed spectra (solid black), corrected for telluric absorption and emission, obtained with SINFONI on the ESO Very Large Telescope, together with a model fit (dashed red line; see Section 6). The spectrum in the upper panel was observed in 2013 with a 0 25 plate scale (Program ID: 091.D-0376(A)), whereas that in the lower panel was observed in 2016 with a 0025 plate scale (Program ID: 097.D-0033(A)). The spectra were reduced using the ESO pipeline with wavelength calibration set by OH lines for the 2013 data set. These lines were not visible in the 2016 data, so we used arc lamp lines in data taken during the daytime. After the wavelength calibration, we measured the centroids of the observed emission lines and estimated the S/N, which varies from ∼70 in the telluric polluted regions to ∼250, as measured near 2.10 μm. The spectra display strong Brγ emission, with a weak P Cyg absorption dip and the corresponding He i hydrogenic components in absorption. H i lines in the Pfund series up to Pf30 are clearly seen in emission longward of 2.3 μm, with a P Cygni shape present in a higher-resolution and S/N spectrum from 2016 that decreases from Pf19 until Pf28. The 2.112/2.113 μm He i doublet lines are in absorption, and the 2.058 μm He i line is in emission with a potential P Cygni profile. This line is blended with the Fe ii 2.060 μm. Two Mg ii doublets in emission are seen near 2.14 and 2.41 μm. Fe ii and Fe [ii] emission lines are seen throughout the spectrum. The Na i doublet is detected near 2.21 μm. Many lines are present in similar strengths in both spectra. The iron and helium lines are clearly stronger in the 2013 spectrum (upper panel). The spectrum looks similar to that in Weldrake et al. (2003), although the Fe ii line strengths in the 2016 spectrum provide a best match.
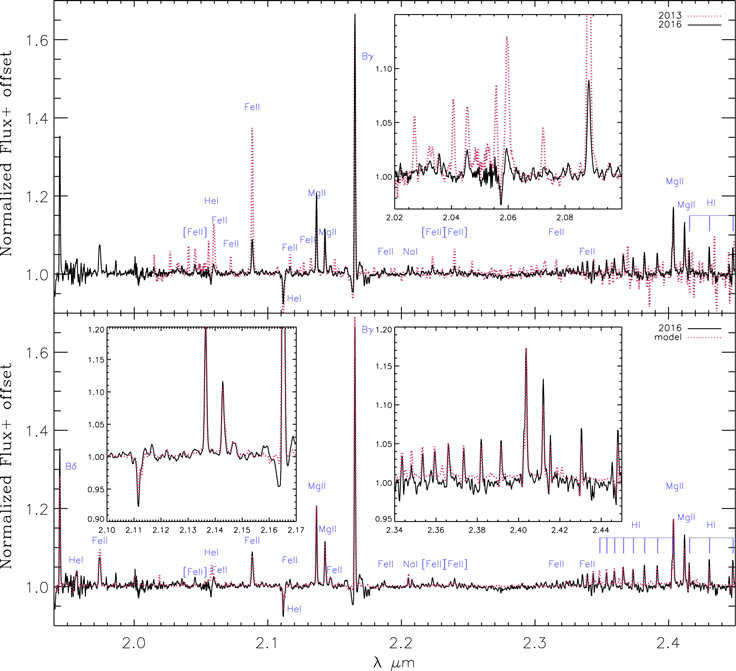
Figure 1. The upper panel compares the 2013 (dashed red) and 2016 (solid black) spectra of IRAS 16115−5044 taken with SINFONI, as obtained from the ESO Science Archive Facility. The lower panel compares the 2016 data with a CMFGEN model fit (dashed red). The insets show close up sections of the spectra. Line identifications are from Figer et al. (1998). See Najarro et al. (2009) and Voors et al. (2000) for similar spectra of qF362 and and G79.29+0.46, respectively.
Download figure:
Standard image High-resolution imageThe spectra are nearly identical to those for qF362 (Najarro et al. 2009) and G79.29+0.46 (Voors et al. 2000). They are also similar to those of other LBVs, e.g., AG Car, the Pistol star (12 kK), G24.73+0.69 (12 kK), G26.47+0.02 (17 kK), and G0.120-0.048 (Morris et al. 1996; Clark et al. 2003, 2018; Najarro et al. 2009; Mauerhan et al. 2010). The He i lines suggest a temperature >10.5 kK, and the Na i lines suggest a temperature <13 kK, which taken together suggests a spectral type of B5-8 at the time of the observation (see Figure 8 in Messineo et al. 2011). The widths from the Fe ii 1.974 and 2.089 μm emission lines that are formed in the mid-outer wind and hence provide a reliable estimate of  are ≈350 km s−1, suggesting a wind speed (∼175 km s−1) that is typical for LBVs (Smith 2014).
IRAS 16115−5044 has a variable spectrum, particularly in the Fe ii, [Fe ii], and He i lines, although the hydrogen and Mg ii lines are more constant. The average equivalent width of the Brγ line is 172 Å ± 3.7%, and those of the Mg ii lines are 26 Å ± 3.0% and 17 Å ± 7.7%, where the percentage error represents the difference between the two measurements and the mean. The equivalent widths for some of the iron lines vary by up to 400%. The shape of the blend of the apparent Brγ P Cygni absorption line and the He i photospheric line also appears to change between the two observations.
2.3. Photometry
The data in Table 1 were taken at many different times and with very different beam widths. The circumstellar emission is clearly included for some of them, e.g., in the IRAS and Akari data.
Table 1. Photometric Measurements of IRAS 16115−5044
| Survey | Band | λ | Flux | Mag | Name | References |
|---|---|---|---|---|---|---|
| (μm) | (Jy) | (mag) | ||||
| GSC2.2 | R | 0.70 | 0.00 | 17.15 | S230213364722 | Lasker et al. (2008) |
| USNOB1 | R2 | 0.70 | 0.00 | 17.79 | 0391-0542333 | Monet et al. (2003) |
| USNOB1 | Imag | 0.90 | 0.01 | 13.47 | 0391-0542333 | Monet et al. (2003) |
| DENIS | I | 0.79 | 0.01 | 13.05 | J161517.9-505219 | Epchtein et al. (1994) |
| 2MASS | J | 1.23 | 1.25 | 7.76 | 16151795-5052197 | Cutri et al. (2003) |
| DENIS | J | 1.22 | 1.38 | 7.67 | J161517.9-505219 | Epchtein et al. (1994) |
| 2MASS | H | 1.63 | 3.58 | 6.13 | 16151795-5052197 | Cutri et al. (2003) |
| 2MASS | K | 2.15 | 5.80 | 5.14 | 16151795-5052197 | Cutri et al. (2003) |
| GLIMPSE | 4.5 | 4.50 | 5.38 | 3.81 | G332.2843-00.0008 | Churchwell et al. (2009) |
| GLIMPSE | 5.8 | 5.80 | 3.83 | 3.69 | G332.2843-00.0008 | Churchwell et al. (2009) |
| GLIMPSE | 8.0 | 8.00 | 3.02 | 3.32 | G332.2843-00.0008 | Churchwell et al. (2009) |
| WISE | W3 | 11.56 | 3.31 | 2.36 | J161518.17-505220.4 | Wright et al. (2010) |
| Mipsgal | F24 | 23.70 | 106.00 | −2.85 | MGE332.2843-00.0002 | Gutermuth & Heyer (2015) |
| IRAS | F12 | 12.00 | 10.40 | 1.09 | IRAS16115−5044 | Beichman et al. (1988) |
| IRAS | F25 | 25.00 | 185.00 | −3.60 | IRAS16115−5044 | Beichman et al. (1988) |
| IRAS | F60 | 60.00 | 500.00 | −6.56 | IRAS16115−5044 | Beichman et al. (1988) |
| IRAS | F100 | 100.00 | 255.00 | −6.93 | IRAS16115−5044 | Beichman et al. (1988) |
| Akari | S9 | 9.00 | 3.26 | 3.09 | 1615181-505218 | Ishihara et al. (2010), |
| Akari | S65 | 65.00 | 337.80 | −6.36 | 1615181-505218 | Ishihara et al. (2010), |
| Akari | S90 | 90.00 | 132.10 | −5.81 | 1615181-505218 | Ishihara et al. (2010), |
| Akari | S140 | 140.00 | 81.99 | −6.59 | 1615181-505218 | Ishihara et al. (2010), |
| Akari | S160 | 160.00 | 56.25 | −6.45 | 1615181-505218 | Ishihara et al. (2010), |
Download table as: ASCIITypeset image
IRAS 16115−5044 is in the Infrared Astronomical Satellite Point Source Catalogue (IRAS PSC; Beichman et al. 1988), with a flux density of 10.4 Jy at 12 μm, 185 Jy at 25 μm, 500 Jy at 60 μm, and 255 Jy at 100 μm. The IRAS colors are [12]–[25] = 4.68 mag and [60]–[100] = 0.37 mag. In the van der Veen/Habing diagram (Figure 5(b) in van der Veen & Habing 1988), the [60]–[100] color falls in region V, though the [12]–[25] is redder than 2 mag. Region V is the region of PNe and nonvariable stars with cold envelopes.
2.4. Photometric Variations
The source was analyzed for photometric variability with data from the Diffuse Infrared Background Experiment (DIRBE) instrument on the Cosmic Background Explorer at 1.25, 2.2, 3.5, and 4.9 μm and reported as a nonvariable star (Price et al. 2010). The flux density increased over the 3.6 yr time period of the observations. In the J band, we measure a linear flux increase from 80 counts on 1990 February 1 to 100 counts on 1993 April 8 (0.24 mag). The standard deviation is 0.23 mag, with similar variations in the other bands, consistent with what is observed for some other LBVs. For example, from 1985 to 1992, AG Car showed a steady small flux increase with variations of 0.1 mag (e.g., van Genderen et al. 1997).
3. Distance
We measured an LSR velocity,  , of −58.6 ± 3.8 km s−1 using the Mg ii lines in the 2013 and 2016 SINFONI data for which we were able to measure the locations of telluric OH lines in order to set the wavelength scale. This
  was confirmed, within the uncertainties, by cross-correlating our spectroscopic model (see Section 6) with the 2016 spectra, denoting that the shapes of the Mg ii lines are barely affected by the stellar wind. Note that we validated our wavelength calibration technique by applying it to SINFONI data sets for GG Car and MCW 137, both early-type supergiants with significant winds and near-infrared spectral morphology similar to that of IRAS 16115−5044. In both cases, we estimated
  and inferred distances consistent with values in the literature. Using the A5 model of Reid et al. (2014), we estimate a distance of 3.68 ± 0.35 kpc, similar to that of nearby supernova remnant RCW103 and PSR J1616−5017 (Messineo et al. 2020). The error is the quadrature sum of the error from the model plus the implied distance error based on the error in the velocity measurement.
The high  determined in Section 4 is consistent with the kinematic distance (Messineo et al. 2020). Radio wavelength absorption has been observed in the 1612, 1665, and 1667 GHz hyperfine structure lines of the OH molecule toward the position of of IRAS 16115−5044 by te Lintel Hekkert & Chapman (1996). Absorption along its line of sight was detected in all three lines (the 1720 MHz lines was not covered). The LSR velocities of the OH absorption features vary from line to line with common intervals and in total cover LSR velocities from −100 to −35 km s−1. Urquhart et al. (2007) published a spectrum of the 13CO J = 1−0 lines of this source, taken as part of the Red MSX Source (RMS) survey effort. This line shows various emission features with LSR velocities between −109 and −45 km s−1, similar to the velocities covered by the OH lines. Given the ubiquity of OH and 13CO in the interstellar medium (ISM) and the relatively large beam widths used in the radio studies, it is impossible to establish a direct relation of the molecular gas with IRAS 16115−5044. We note that the depth of the OH absorption, up to −0.7 Jy, indicates that the absorption must be against extended Galactic background radiation, as no compact radio source has been detected toward IRAS 16115−5044. Messineo et al. (2020) discuss the overlapping clouds along this line of sight. In summary, we find that the extinction and radio features are consistent with the kinematic distance inferred from the infrared spectra.
From the considerations in this section, we adopt a distance of 3.68 kpc for IRAS 16115−5044, placing it in the Scutum–Crux spiral arm of the Galaxy (see Figure 6 in Messineo et al. 2020).
Note that we inspected the GAIA DR2 database, finding a parallax of ϖ = 0.69 ± 0.19 mas yr−1, giving a distance range of 1.1–2 kpc. We give this distance little weight, as comparison of distances inferred from GAIA data with spectrophotometric distances for OB stars implies deviations up to 50% for distances >2 kpc (Shull & Danforth 2019).
4. Warm Dust
Two composite images of the region from the GLIMPSE and MIPSGAL surveys are shown in Figure 2. IRAS 16115−5044 is a bright 24 μm source (106 Jy) and is listed in the catalog of Mizuno et al. (2010) as an extended source with a diameter of 47'', corresponding to a physical size of 0.8 pc for a distance of 3.6 kpc, sizes that are typical for LBVs (Nota et al. 1995). The object is below the detection threshold of van de Steene & Pottasch (1993) at radio wavelengths, suggesting that the star is not ionizing the nearby dust. This precludes the typical straightforward determination of the nebular mass since any determination from the properties of the dusty component would require a somewhat arbitrary dust:gas ratio to be adopted. We also note the apparent asymmetric nature of the nebula at 24 μm (Figure 2, right).
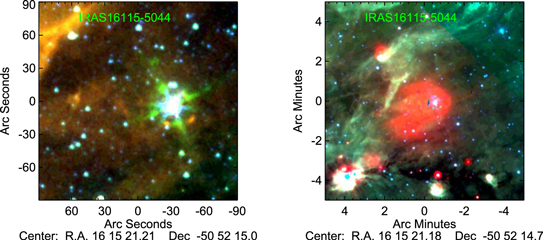
Figure 2. (left) Composite GLIMPSE image at 3.6 μm (blue), 5.8 μm (green), and 8.0 μm (red). (right) Composite GLIMPSE/MIPSGAL image at 5.8 μm (blue), 8.0 μm (green), and 24 μm (red).
Download figure:
Standard image High-resolution image5. Interstellar Extinction
IRAS 16115−5044 was classified as a PPN because the inferred luminosity was consistent with those of the central stars in PNe (4000–6000 L⊙), but this was due to an incorrect estimate of interstellar extinction.
Using the spectral energy distribution (SED) from the spectroscopic model, we estimate that the intrinsic near-infrared colors are close to zero (H − K = 0.08 and J − H = 0.13). Applying curve number three from Messineo et al. (2005) for the extinction law to the observed color excesses, we estimate  = 1.4. Figure 3 shows a model fit to the dereddened photometry. It consists of the stellar model SED plus the dust contribution provided by a blackbody with a temperature of 145 K.
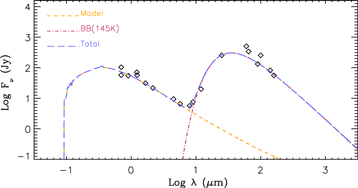
Figure 3. Dereddened photometry of IRAS 16115−5044 (black diamonds), total flux (dashed long blue), and from the model SED (dashed orange) plus a T = 145 K blackbody (dashed–dotted red).
Download figure:
Standard image High-resolution image6. Luminosity and Mass
We modeled the SED and K-band spectrum with CMFGEN (Hillier & Miller 1998) in a process similar to that described in Najarro et al. (2009), finding log(L/L⊙) = 5.75, Teff = 11.0 kK (τRoss = 2/3, R = 205 R⊙), Vinf = 170 km s−1, and  = 4.75(10−6) M⊙ yr−1 with a moderate clumping (fcl ∼ 0.08) initiating close to the base of the wind. As in Najarro et al. (2009), we are able to break the He/H degeneracy and obtain He/H = 0.40 by number. Figure 1 displays the excellent fit of our spectroscopic model to the observations for the 2016 data set.
We refrained from modeling the 2013 data, due to its lower S/N compared to the 2016 data. However, we can qualitatively say that the 2013 spectrum corresponds to a slightly higher temperature phase reflected by the He i components, the increased strength of the Fe ii lines, and the weakened Na i lines.
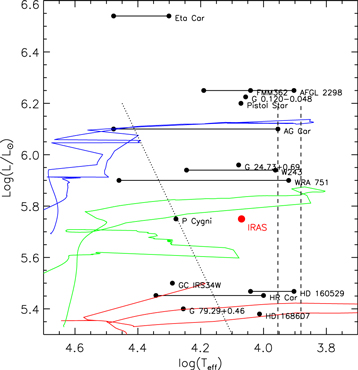
Figure 4 plots the location of the object on the HR diagram, along with data points for LBVs and evolutionary tracks for rotating massive stars (Ekström et al. 2012). From the location of IRAS 16115−5044 in the HR diagram, it appears that the initial mass for the star is ≈40 M⊙, assuming that the object is a single star. While it is possible that it could be a multiple-star system, we note that there are no indications of multiplicity, or binary star evolution, in the spectra.
Figure 4. HR diagram for IRAS 16115−5044 and other LBVs. Data for other objects are from Eta Car (Humphreys & Davidson 1994), P Cyg (Najarro et al. 1997), HD 168607 (Leitherer & Wolf 1984), AG Car (Groh et al. 2009), HR Car (Boffin et al. 2016), HD 160529 (Humphreys & Davidson 1994), Wra 751 (Vamvatira-Nakou et al. 2013), qF362 (Najarro et al. 2009), AFGL 2298 (Clark et al. 2009), G24.73+0.69 (Clark et al. 2003), W243 (Ritchie et al. 2009), GCIRS34W (Martins et al. 2007), G0.120-0.048 (Mauerhan et al. 2010), Pistol star (Figer et al. 1998; Najarro et al. 2009), and G79.29+0.46 (Voors et al. 2000). Estimates of the minimum and maximum temperatures are connected with dashed lines, when available. The two long-dashed vertical lines enclose the outburst region of LBVs as shown in Smith et al. (2004). The diagonal dotted line marks the hot edge of the LBV minimum strip (Smith et al. 2004; Clark et al. 2005). Three rotating stellar tracks of 25, 40, and 60 M⊙ are plotted with red, green, and blue curves, respectively (Ekström et al. 2012). We set the values for G0.120-0.048 as intermediate between those of the Pistol star and FMM362, as the K-band spectra are all similar (Figer et al. 1998; Geballe et al. 2000; Mauerhan et al. 2010).
Download figure:
Standard image High-resolution image
7. Conclusions
We revise the classification of IRAS 16115−5044 from a protoplanetary nebula to a candidate LBV based on K-band spectra and photometry. Photometric variations of ≈20% are detected in DIRBE data, while mid-infrared imaging confirms the presence of a circumstellar nebula. The spectroscopic variability exhibited is replicated almost exactly by the bona fide LBV qF362. We estimate a distance of 3.68 kpc,  , and temperature in the range of 10.5–13 kK. From the luminosity and temperature, along with a model, we infer an initial mass of ≈40 M⊙. All of the observed and inferred properties are similar to those of well-established LBVs. We consider IRAS 16115−5044 to be a compelling candidate LBV and suggest further photometric and spectroscopic monitoring to confirm this assertion.
We acknowledge the efforts to produce the data from IRAS, DIRBE, GSC, USNO, 2MASS, DENIS, GLIMPSE, MIPSGAL, AKARI, and WISE surveys, and the Science Archive of the European Southern Observatory. We thank John Hillier for providing the CMFGEN code and James Urquhart for information on the radio emission from IRAS 16115−5044. This work was partially supported by the National Natural Science Foundation of China (NSFC-11421303), and USTC grant KY2030000054. F.N. acknowledges financial support through Spanish grants ESP2017-86582-C4-1-R and PID2019-105552RB-C41 (MINECO/MCIU/AEI/FEDER) and from the Spanish State Research Agency (AEI) through the Unidad de Excelencia Mara de Maeztu-Centro de Astrobiologa (CSIC-INTA) project No. MDM-2017-0737.