


Abstract
The chemical compounds carrying the thiol group (-SH) have been considered essential in recent prebiotic studies regarding the polymerization of amino acids. We have searched for this kind of compound toward the Galactic Center quiescent cloud G+0.693–0.027. We report the first detection in the interstellar space of the trans-isomer of monothioformic acid (t-HC(O)SH) with an abundance of ∼1 × 10⁻¹⁰. Additionally, we provide a solid confirmation of the gauche isomer of ethyl mercaptan (g-C2H5SH) with an abundance of ∼3 × 10⁻¹⁰, and we also detect methyl mercaptan (CH3SH) with an abundance of ∼5 × 10⁻⁹. Abundance ratios were calculated for the three SH-bearing species and their OH analogs, revealing similar trends between alcohols and thiols with increasing complexity. Possible chemical routes for the interstellar synthesis of t-HC(O)SH, CH3SH, and C2H5SH are discussed, as well as the relevance of these compounds in the synthesis of prebiotic proteins in the primitive Earth.
Export citation and abstract BibTeX RIS
1. Introduction
Among different theories of origin of life, one recurrent conundrum is the abiotic polymerization of amino acids since it requires ribosomes, macromolecular machines containing ribonucleic acid (RNA) and proteins. How could the first proteins form if they were needed to synthesize others? Following the ideas of Foden et al. (2020), a possible solution involves a thiol-based scenario in which SH-bearing molecules, together with the family of thioacids (R-C(O)SH) and thioesters (R-S-R'), have important properties as energy carriers and catalysts (Chandru et al. 2016; Leman & Ghadiri 2017). Although these types of compounds could be created in situ by an H2S-mediated chemistry under prebiotically plausible conditions on early Earth (Shalayel et al. 2020), they also could have been delivered exogenously. Hence, observations of thiol-based molecules in space could shed some light on the availability of such compounds on a primitive Earth, and on their role in the prebiotic synthesis of proteins.
More than 220 molecules have been detected in the interstellar medium (ISM) and circumstellar shells 9 to date. However, sulfur-containing species only account for 20 of them. Furthermore, while molecules detected carrying C, H, or N range from 2 up to 13 atoms, the vast majority of S-bearing molecules have, at most, 4 atoms (such as H2CS; Sinclair et al. 1973). This could be due to the relatively low cosmic abundance of atomic sulfur (≈10−5 with respect to H2, that is, more than 10 times lower than C or O; Asplund et al. 2009) together with its ability to have many different oxidation states and allotropes when compared to the more abundant elements (Jiménez-Escobar et al. 2014; Shingledecker et al. 2020) and its capacity of depleting fast in dense molecular clouds (Laas & Caselli 2019).
As a consequence, very few S-bearing molecules containing more than four atoms have firmly been detected in the ISM so far. One example is methyl mercaptan (hereafter CH3SH), which has been detected in several environments, such as prestellar cores (Gibb et al. 2000), massive star-forming regions like Sagittarius B2 (Linke et al. 1979; Müller et al. 2016), and Solar-like protostars (Majumdar et al. 2016). The other one is ethyl mercaptan (hereafter C2H5SH), which was tentatively detected toward Orion KL (Kolesniková et al. 2014). Other searches for complex S-bearing molecules were unsuccessful, such as CH3CHS (thioacetaldehyde; Margulès et al. 2020), NH2CHS (thioformamide; Motiyenko et al. 2020), and CH3SC(O)H (S-methyl thioformate; Jabri et al. 2020).
In this Letter, we report the first detection in the ISM of the trans-isomer of monothioformic acid (hereafter HC(O)SH), the simplest thiol acid. We also report a solid confirmation of the gauche isomer of C2H5SH, together with the detection of CH3SH. These molecules are found toward the quiescent Giant Molecular Cloud G+0.693–0.027 located in the Galactic Center (hereafter G+0.693). This source shows a very rich chemistry with up to 40 different complex organic molecules 10 detected (see, e.g., Requena-Torres et al. 2008; Rivilla et al. 2018, 2019; Zeng et al. 2018; Rivilla et al. 2020; Jiménez-Serra et al. 2020). Studies suggest that this cloud could be undergoing a cloud–cloud collision (Zeng et al. 2020), which induces large-scale shocks that sputter dust grains and that enhances the gas-phase abundance of molecules by several orders of magnitude (Requena-Torres et al. 2006).
2. Observations
We have used a spectral line survey toward G+0.693 covering several windows between 32 GHz to 172 GHz with an average resolution of 1.5 km s−1, although the final spectral resolution employed in the figures has been smoothed up to 3 km s−1. We stress that this is for a proper line visualization and does not alter in any form the analysis done.
For the observations, we used both the IRAM 30 m telescope located at Pico Veleta (Granada, Spain) and the Yebes 40 m telescope
11
(Guadalajara, Spain). The equatorial coordinates of the molecular cloud G+0.693 are α(J2000.0) = 17h47m22s and δ(J2000.0) = −28°21'27''. The position switching mode was used in all the observations with the off position located at (−885'', 290'') from the source. The line intensity of the spectra was measured in units of  as the molecular emission toward G+0.693 is extended over the beam (Requena-Torres et al. 2006; Martín et al. 2008; Rivilla et al. 2018). In all the observations, each frequency setup was repeated shifting the central frequency by 20–100 MHz in order to identify spurious lines or contamination from the image band.
The IRAM 30 m observations were performed during three different sessions in 2019: April 10–16, August 13–19, and December 11–15. The dual polarization receiver EMIR was used connected to the fast Fourier transform spectrometers (FFTSs), which provided a channel width of 200 kHz in the 3 and 2 mm radio windows. The observations with the Yebes 40 m radiotelescope were carried out in 2020: from February 3 to 9 and from February 15 to 22. In this case, the Nanocosmos Q-band (7 mm) HEMT receiver was used, which enables ultra-broadband observations in two linear polarizations (Tercero et al. 2021). The receiver was connected to 16 FFTSs providing a channel width of 38 kHz and an instantaneous bandwidth of 18.5 GHz per polarization, covering the frequency range between 31.3 GHz and 50.6 GHz.
3. Analysis and Results
We used the software madcuba
12
(Martín et al. 2019) to perform the data analysis and line identification The Spectral Line Identification and Modelling (SLIM) tool of madcuba uses the spectroscopic data entries from different molecular catalogs, and generates a synthetic spectra based under the assumption of local thermodynamic equilibrium (LTE) conditions, and considering line opacity effects. The fitted parameters used to reproduce the molecular emission are column density (N), excitation temperature ( ), local standard of rest velocity (vLSR), and FWHM.
Both HC(O)SH and C2H5SH have two rotamers, associated with the rotation of their respective C-S bond. HC(O)SH has one cis (c-HC(O)SH) and one trans (t-HC(O)SH) rotamer, the former being ∼330 K higher in energy (Hocking & Winnewisser 1976). C2H5SH has two degenerated ± gauche isomers (g-C2H5SH) and one antiperiplanar.
For our analysis we have used the following spectroscopic entries from the the CDMS 13 catalog: entries 062515/062516 for trans/cis isomers of HC(O)SH (Hocking & Winnewisser 1976), 062523/062524 for gauche/anti isomers of C2H5SH (Kolesniková et al. 2014; Müller et al. 2016), and 048510 for CH3SH (Xu et al. 2012; Zakharenko et al. 2019).
3.1. Detection of t-HC(O)SH
The fitting procedure was performed considering the total emission of any other identified molecule in the spectral survey. This evaluation was carried out introducing all the compounds already detected in the ISM and in G+0.693 (see Requena-Torres et al. 2006, 2008; Zeng et al. 2018; Rivilla et al. 2019; Jiménez-Serra et al. 2020). For the analysis, it was also assumed a cosmic microwave background temperature (Tbg) of 2.73 K and no background continuum source (Zeng et al. 2020).
The global fit of all rotational lines to the observed data is shown in blue lines in Figure 1, while in red we show the fit of the individual lines of t-HC(O)SH, and the observational data in black. As shown in both Figure 1 and Table 1, we have detected a total of nine a-type transitions in the 7 mm and 3 mm bands, each one of them detected above the 5σ level in integrated intensity. Note that the SLIM synthetic spectrum shows small deviations with respect to the observations. These deviations are larger that the ones obtained for CH3SH and g-C2H5SH (see Figures 3 and 4 in Appendix A). This is due to the fact that the t-HC(O)SH lines are significantly weaker than those of CH3SH and g-C2H5SH (3–7 mK versus 5–12 mK and >40 mK, respectively). However, the fit of all clean t-HC(O)SH lines is consistent with the noise. We also note that for the three slightly blended lines of t-HC(O)SH, the contribution of the other molecules is less than 10% of the total intensity. Despite that the remaining two appear blended, the predicted LTE intensities are consistent with the observed lines. Note that the rest of the t-HC(O)SH lines covered within the observed frequency range are not shown due to strong blending issues.
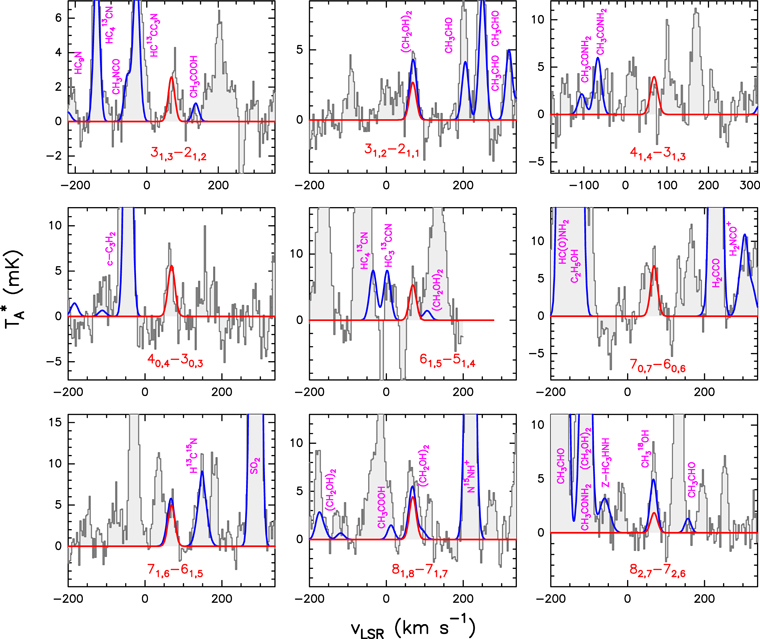
Figure 1. Cleanest and brightest lines of t-HC(O)SH detected toward G+0.693 labeled with their corresponding quantum numbers in red. The red line shows the best LTE fit to the observed spectra (represented by the black lines). The data have been smoothed up to 3 km s−1 for an optimal line visualization. The blue lines show the spectra including the emission of all the molecules searched toward G+0.693. Note that these lines are tagged with their corresponding molecular compound in pink.
Download figure:
Standard image High-resolution imageTable 1. Lines of t-HC(O)SH Detected toward G+0.693 with Their Corresponding Quantum Numbers (QNs), Logarithm of the Einstein Coefficients ( ) , Degeneracy (
 ), and Energy (
 ) of the Upper State
| Rest Frequency | QNs a | gu | Eu |

| rms |
 b
b
| S/N b | Comments |
|---|---|---|---|---|---|---|---|---|
| (MHz) | (K) | (s−1) | (mK) | ( ) ) | ||||
| 34248.82 |

| 7 | 4.3 | −6.4784 | 1.4 | 56 | 7.3 | clean transition |
| 35915.48 |

| 7 | 4.4 | −6.4164 | 1.4 | 58 | 7.6 | blended with HOCH2CH2OH |
| 45659.99 |

| 7 | 6.0 | −6.0647 | 2.4 | 88 | 13.4 | clean transition |
| 46737.73 |

| 7 | 3.4 | −6.0064 | 2.6 | 122 | 8.6 | clean transition |
| 71800.18 |

| 13 | 11.3 | −5.4428 | 3.5 | 121 | 6.3 | clean transition |
| 81630.08 |

| 15 | 11.8 | −5.2587 | 3.4 | 153 | 8.2 | slightly blended with CH3CH2CHO |
| 83749.29 |

| 15 | 14.8 | −5.2342 | 3.4 | 116 | 11.8 | slightly blended with CH3COOH |
| 91251.84 |

| 17 | 18.1 | −5.1166 | 1.7 | 104 | 11.2 | slightly blended with (CH2OH)2 and unidentified species |
| 93505.09 |

| 17 | 26.5 | −5.1061 | 1.4 | 46 | 6.0 | blended with CH3 18OH |
Notes. The integrated signal (  ) and rms noise level are also provided and used to calculate the signal-to-noise ratio (S/N) of the detections.
 (where the double prime indicates the upper state).
b
S/N is calculated from the integrated signal and noise level
(where the double prime indicates the upper state).
b
S/N is calculated from the integrated signal and noise level  , where
  is the velocity resolution of the spectra.
Download table as: ASCIITypeset image
The physical parameters obtained from the fit are listed in Table 2. The values obtained for Tex and FWHM are consistent with those obtained previously for other molecular species toward this cloud ( 5–20 K and line widths around 20 km s−1; Zeng et al. 2018; Rivilla et al. 2020). The low
  indicates that the emission of the molecules in G+0.693 is subthermally excited as a result of the low H2 densities of this source (
 150 K; Requena-Torres et al. 2006; Zeng et al. 2018).
Table 2. Physical Parameters of the Species Derived by LTE Analysis in madcuba
| Molecular Formula | N | Tex | vLSR | FWHM | Abundance |
|---|---|---|---|---|---|
| (×1013 cm−2) | (K) |

|

| ( ) ) | |

| 1.6 ± 0.1 | 10 ± 1 | 69.0 a | 21.0 a | 1.2 ± 0.2 |

| ≤0.3 | 10.0 | 69.0 a | 21.0 a | ≤0.2 |

| 4 ± 2 | 10 ± 5 | 69.0 a | 20.0 a | 3 ± 1 |

| ≤2.3 | 9.91 | 69.0 a | 20.0 a | ≤1.7 |

| 46.8 ± 0.5 | 8.5 ± 0.1 | 68.0 ± 0.1 | 21.2 ± 0.3 | ⋯ |

| 18.6 ± 0.7 | 14.9 ± 0.5 | 68.8 ± 0.3 | 22.0 ± 0.7 | ⋯ |

| 65 ± 2 | ⋯ | ⋯ | ⋯ | 48 ± 5 |

| 20 ± 4 | 10 ± 2 | 68 ± 2 | 22 ± 5 | 15 ± 4 |
Note.
a Value fixed in the fit.Download table as: ASCIITypeset image
For t-HC(O)SH, the fitted column density gives (1.6 ± 0.1)×1013 cm−2. In addition, we derived a 3σ upper limit of ≤3 × 1012 cm−2 for c-HC(O)SH (Table 2), as no clear transition has been detected within our data set. For the calculation, we have assumed the same  ,
,  , and FWHM as for t-HC(O)SH. A ratio c-HC(O)SH/t-HC(O)SH ≤ 0.2 was obtained.
3.2. Detection of g-C2H5SH and CH3SH
This molecule was tentatively detected in Orion KL (Kolesniková et al. 2014), based on a few isolated transitions assigned to this isomer. We report here an unambiguous detection of this isomer that confirms it presence in the ISM. We have listed in Table 4 (Appendix A) the transitions measured toward G+0.693. Note that eight of the targeted lines are totally clean (Figure 3, Appendix A) and above the 5σ level in integrated intensity. We derived a total column density of (4 ± 2) × 1013 cm−2 (Table 2).
In the case of CH3SH, the the fit was carried out separating the targeted lines into its Ka = 0 and Ka = 1 levels 14 . The brightest transitions fall into the 3 mm and 2 mm bands as presented in Figure 4 and Table 5 (Appendix B). Note that the agreement between the predicted and observed spectra is excellent for all clean transitions. The column density using the Ka = 0 and Ka = 1 levels is (6.5 ± 0.2) × 1014 cm−2 (Table 2). This gives a ratio of CH3SH/g-C2H5SH = 16 ± 7. Note that the column density of Ka = 2 and remaining transitions in CH3SH contribute less than a 10% in the total determined.
Finally, we note that both 13C and 34S isotopologues of CH3SH have also been detected with a few clean lines and will be presented in a forthcoming paper (L. Colzi et al. 2021, in preparation).
3.3. Molecular Abundances and Comparison with Their O-bearing Analogs
To derive the fractional abundances of these species relative to H2, we have assumed a H2 column density of  cm−2 (Martín et al. 2008). This gives ∼ 3 × 10⁻¹⁰, ∼1 × 10⁻¹⁰, and ∼5 × 10⁻⁹ for g-C2H5SH, t-HC(O)SH, and CH3SH, respectively (Table 2).
In Figure 2 we have plotted these values and compared them with the abundances obtained for their OH molecular analogs, namely, C2H5OH (ethanol), HC(O)OH (formic acid), and CH3OH (methanol). We obtained a ratio CH3OH/CH3SH = 23, C2H5OH/C2H5SH = 15, and HC(O)OH/HC(O)SH = 13. Although these OH analogs are more abundant by a factor ≥10, the resulting trend is strikingly similar. Note, however, that this trend is lost when we compare molecules such as carbon monosulfide (CS) and thioformaldehyde (H2CS) with their O-bearing analogs, resulting in H2CO/H2CS = 3.5 and CO/CS = 3.5 × 10³ (Figure 2).

Figure 2. Molecular abundances with respect to H2 for the reported detections and their OH analogs (CH3OH, C2H5OH, and HC(O)OH) including CS, CO, H2CO, and H2CS. The lines that connect each dot do not have any physical meaning but are just a visual aid.
Download figure:
Standard image High-resolution imageSince CH3OH, C2H5OH, H2CO, CO, and CS are optically thick toward G+0.693, the column density of these molecules was inferred from CH3 18OH, 13CH3CH2OH, H2C18O, C18O, and 13C34S. It was assumed 16O/18O = 250 and 12C/13C = 21 (Armijos-Abendaño et al. 2015) and 32S/34S = 22 (Wilson 1999). For HC(O)OH, the main isotopologue of HC(O)OH was employed as the ratio H12C(O)OH/H13C(O)OH, which is consistent with the 12C/13C ratio. For the sulfur analogs, except CS, we do not expect opacity issues due to their much lower abundances. The fit and transitions selected for these molecules are listed in Appendix B (Figures 5 and 6 and Tables 6, 7, 8, 9, and 10).
4. Discussion
4.1. Comparison with Previous Observations
We have compared different column density ratios obtained between the S-bearing compounds measured toward G+0.693 and two other sources, namely, Orion KL (Kolesniková et al. 2014) and Sgr B2(N2) (Müller et al. 2016; see Table 3).
Table 3. Relative Abundances of Molecules and Comparison with Other Sources
| Source | CH3SH/C2H5SH | CH3OH/C2H5OH | CH3OH/CH3SH | C2H5OH/C2H5SH |
|---|---|---|---|---|
| G+0.693 | 16 ± 7 | 24 ± 4 c , d | 23 ± 3 c | 15 ± 7 d |
| Sgr B2(N2) a | ≥21 | 20 | 118 | ≥125 |
| Orion KL b | 5 | 31 | 120 | 20 |
Notes.
a Data taken from Müller et al. (2016). b Data taken from Kolesniková et al. (2014). c Data inferred from CH3 18OH assuming 16O/18O = 250 (Armijos-Abendaño et al. 2015). d Data inferred from 13CH3CH2OH assuming 12C/13C = 21 (Armijos-Abendaño et al. 2015).Download table as: ASCIITypeset image
From this table, we find that all abundance ratios measured in G+0.693 are strikingly similar. For instance, when we compare SH-bearing molecules with their OH analogs (CH3OH/CH3SH and C2H5OH/C2H5SH) we recover the trend already found in Figure 2, which might indicate a similar chemistry between OH- and SH-bearing species. The CH3OH/CH3SH ratio measured in G+0.693 is a factor of 5 lower than those found in Sgr B2(N2) and Orion KL, which indicates that G+0.693 is richer in sulfur-bearing species than the two massive hot cores. This may be related to the fact that the chemistry of this cloud is affected by large-scale shocks (Requena-Torres et al. 2006; Zeng et al. 2018). Since sulfur is heavily depleted on grains (possibly in the form of S8 and other sulfur allotropes; Shingledecker et al. 2020), the sputtering of dust grains induced by shocks could liberate a significant fraction of the locked sulfur.
The C2H5OH/C2H5SH ratio is comparable to the value determined toward Orion KL while there is a difference by a factor of 10 between G+0.693 and the upper limit toward Sgr B2(N2). All these ratios suggest that sulfur is less incorporated into molecules than oxygen, which again might be due to the fact that a significant fraction of sulfur is locked up in grains.
4.2. Interstellar Chemistry of Thiols
In order to understand the chemistry of S-bearing compounds, different models have been proposed based on the simple molecules detected in the gas phase (Müller et al. 2016; Gorai et al. 2017; Lamberts 2018; Laas & Caselli 2019). CH3SH is thought to be formed on grain surfaces by sequential hydrogenations starting from CS:


The last step could also yield other products, but theoretical calculations show a branching ratio (br) of ∼75% for CH3SH (Lamberts 2018). This is a viable mechanism since approximately half of the CS present in the ices is available to undergo hydrogenation, while the other half is converted to OCS (Palumbo et al. 1997). Once formed, CH3SH could remain stored in the ices until released by grain sputtering in the large-scale shocks present in G+0.693 (Requena-Torres et al. 2006; Zeng et al. 2020).
Likewise, ethyl mercaptan is proposed to be formed by radical–radical reactions (Müller et al. 2016; Gorai et al. 2017) such as


Observations of the reactants could give us a hint of the dominant reaction based on the measured column densities. However, chemical modeling is needed to understand the efficiency of these formation routes. Note that CH2SH is the main product of the hydrogenation of H2CS (Lamberts 2018).
To our knowledge, there is no information available in the literature about the chemistry of HC(O)SH. However, we can make a guess and assume similar astrochemical pathways for the SH-based species as the ones for their OH analogs. A possible pathway to HC(O)SH could mimic the formation of HC(O)OH. Ioppolo et al. (2011) showed that the formation of HC(O)OH starts from CO and the OH radical in the ice. The thiol-equivalent reaction would be

The first step has been found to be efficient by Adriaens et al. (2010), but further experimental and/or theoretical work is needed to investigate whether HSCO could be hydrogenated further.
Another possibility could be

or

The first reaction was initially proposed for HC(O)OH by Garrod & Herbst (2006) and could be a viable mechanism since SH can be formed on surfaces from S+H or H+H2S via tunneling (Vidal et al. 2017). The second involves the sequential hydrogenation of OCS, which is a molecule detected in ices (Palumbo et al. 1997) and it is moderately abundant in the gas phase in G+0.693 (N > 1015 cm−2; Armijos-Abendaño et al. 2015). Theoretical studies about these chemical networks are currently under work and will be presented in a forthcoming paper (G. Molpeceres et al. 2021, in preparation).
4.3. Implications for Theories on the Origin of Life
As it was previously stated, thioacids and thioesters have been proposed as key agents in the polymerization of amino acids into peptides and proteins (Foden et al. 2020; Muchowska & Moran 2020). In some of these works, it is stressed the importance of cystein, HSCH2CH(NH2)COOH, as the primary organic source of sulfide in biology and a key catalyst in the abiotic polymerization of peptides. Smaller thiols such as CH3SH and C2H5SH are also believed to play a key role in prebiotic chemistry and in theories about the origin of life, since they are precursors for the synthesis of the amino acids methionine and ethionine (Parker et al. 2011). In turn, HC(O)SH could be an important ingredient in the phosphorylation of nucleosides as demonstrated by Lohrmann & Orgel (1968).
The idea of an extraterrestrial delivery of SH compounds onto Earth, is supported by the detection of CH3SH in Murchinson carbonaceous chondrite (Tingle et al. 1991) and in the coma of the 67P/Churyumov–Gerasimenko comet (Calmonte et al. 2016). In the latter, C2H6S was also detected (either in the form of C2H5SH or CH3SCH3, dimethyl sulfide) with an abundance ratio CH3SH/C2H6S ∼ 10 that is consistent with the value obtained in G+0.693 (Table 3). This resemblance could be possibly indicate a presolar origin of these compounds. Still, further studies are required within other regions in the ISM and planetary bodies to make a proper connection.
In summary, not only have our observations confirmed the presence of sulfur-bearing complex organics such as CH3SH and C2H5SH, but they also have revealed the existence of the simplest thioacid known, HC(O)SH, in the ISM.
We acknowledge the anonymous reviewers for their useful comments that have helped to improved our manuscript. L.F.R.-A. acknowledges support from a JAE-intro ICU studentship funded by the Spanish National Research Council (CSIC). L.F.R.-A., V.M.R., and L.C. also acknowledge support from the Comunidad de Madrid through the Atracción de Talento Investigador Modalidad 1 (Doctores con experiencia) Grant (COOL: Cosmic Origins Of Life; 2019-T1/TIC-15379; PI: V.M.Rivilla). I.J.-S. and J.M.-P. have received partial support from the State Research Agency (AEI) through project numbers PID2019-105552RB-C41 and MDM-2017-0737 Unidad de Excelencia "María de Maeztu"—Centro de Astrobiología (CSIC-INTA). P.d.V. and B.T. thank the support from the European Research Council through Synergy Grant ERC-2013-SyG, G.A. 610256 (NANOCOSMOS) and from the Spanish Ministerio de Ciencia e Innovación (MICIU) through project PID2019-107115GB-C21. B.T. also thanks the Spanish MICIU for funding support from grants AYA2016-75066-C2-1-P and PID2019-106235GB-I00.
Facilities: IRAM 30 m - , Yebes 40 m. -
Software: madcuba.
Appendix A: Detections of C2H5SH and CH3SH in G+0.693
In Figures 3 and 4 and Tables 4 and 5 the fit of g-C2H5SH and CH3SH is shown. The fitting procedure followed has been the same as t-HC(O)SH, explained in the main text.

Figure 3. Cleanest and brightest lines of g-C2H5SH detected toward G+0.693. The red line shows the best LTE fit to the observed spectra (represented by the black lines) with their corresponding quantum numbers in red ( see Table 4 for a description of their tunneling states). The data have been smoothed up to 3 km s−1 for an optimal line visualization. The blue lines show the spectra including the emission of all the molecules searched toward the cloud. Note that these lines are tagged with their corresponding molecular compound in pink.
Download figure:
Standard image High-resolution image
Figure 4. Cleanest and brightest lines of CH3SH detected toward G+0.693. The red line shows the best LTE fit to the observed spectra (represented by the black lines) with their corresponding quantum numbers in red ( see Table 5 for the description of their torsional states). The data have been smoothed up to 3 km s−1 for an optimal line visualization. The blue lines show the spectra including the emission of all the molecules searched toward the cloud. Note that these lines are tagged with their corresponding molecular compound in pink.
Download figure:
Standard image High-resolution image
Figure 5. Selected lines of CH3 18OH detected toward G+0.693. Black, red, and blue lines represent the observational data, the individual lines of CH3 18OH, and the global fit considering all the species detected, respectively. See Table 9 for a complete description of their quantum numbers).
Download figure:
Standard image High-resolution image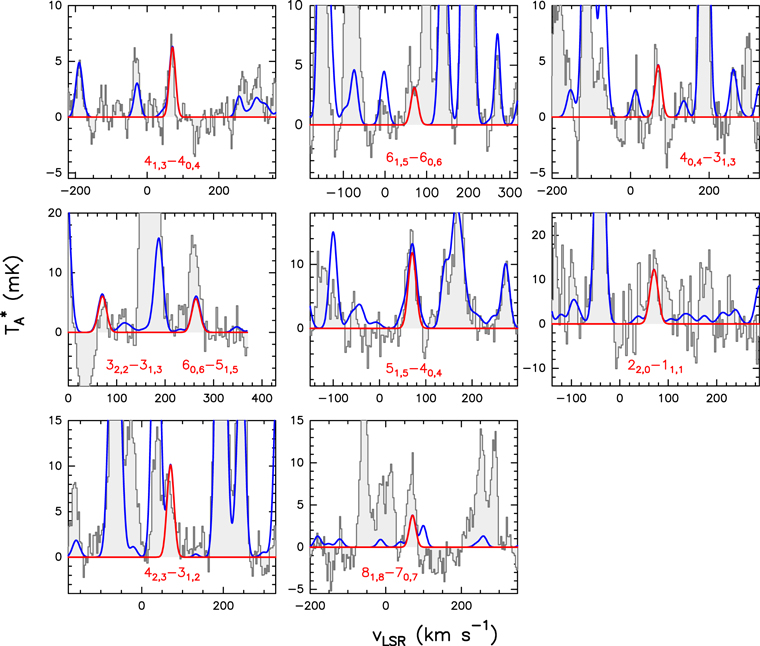
Figure 6. Selected lines of anti-13CH3CH2OH detected toward G+0.693. Black, red, and blue lines represent the observational data, the individual lines of 13CH3CH2OH, and the global fit with all species, respectively.
Download figure:
Standard image High-resolution imageTable 4. Lines of g-C2H5SH Detected toward G+0.693 with Their Corresponding QNs and Tunneling States (TSs),  ,
,  , and
, and 
| Rest Frequency | QNs | TS | gu | Eu |

| rms |

| S/N | Comments |
|---|---|---|---|---|---|---|---|---|---|
| (MHz) |

| (K) | (s−1) | (mK) | ( ) ) | ||||
| 40499.173 |

|

| 9 | 3.0 | −6.1161 | 1.4 | 225 | 29 | clean transition a |
| 40499.591 |

|

| 9 | 2.9 | −6.1163 | 1.4 | ⋯ | ⋯ | ⋯ |
| 40558.849 |

|

| 9 | 7.6 | −6.2391 | 1.2 | 107 | 16 | clean transition a |
| 40559.284 |

|

| 9 | 7.5 | −6.2392 | 1.2 | ⋯ | ⋯ | ⋯ |
| 40576.963 |

|

| 9 | 13.2 | −6.2004 | 1.2 | 72 | 11 | clean transition a |
| 40577.299 |

|

| 9 | 13.2 | −6.2004 | 1.2 | ⋯ | ⋯ | ⋯ |
| 40577.432 |

|

| 9 | 13.2 | −6.2004 | 1.2 | ⋯ | ⋯ | ⋯ |
| 40577.769 |

|

| 9 | 13.2 | −6.2004 | 1.2 | ⋯ | ⋯ | ⋯ |
| 40622.316 |

|

| 9 | 7.6 | −6.2370 | 1.2 | 107 | 16 | clean transition a |
| 40622.792 |

|

| 9 | 7.5 | −6.2371 | 1.2 | ⋯ | ⋯ | ⋯ |
| 72466.861 |

|

| 15 | 11.7 | −5.3458 | 2.8 | 261 | 17 | clean transition a |
| 72468.152 |

|

| 15 | 11.6 | −5.3459 | 2.8 | ⋯ | ⋯ | ⋯ |
| 79204.501 |

|

| 17 | 14.6 | −5.2243 | 1.8 | 204 | 24 | clean transition a |
| 79204.501 |

|

| 17 | 14.6 | −5.2243 | 1.8 | ⋯ | ⋯ | ⋯ |
| 82782.441 |

|

| 17 | 15.2 | −5.1667 | 1.8 | 233 | 30 | slightly blended with unidentified line a |
| 82783.912 |

|

| 17 | 15.1 | −5.1668 | 1.4 | ⋯ | ⋯ | ⋯ |
| 90516.341 |

|

| 19 | 17.6 | −5.0412 | 1.2 | 223 | 34 | slightly blended with unidentified line a |
| 90516.926 |

|

| 19 | 17.5 | −5.0414 | 1.2 | ⋯ | ⋯ | ⋯ |
| 93082.083 |

|

| 19 | 19.1 | −5.0096 | 2.0 | 191 | 18 | clean transition a |
| 93083.720 |

|

| 19 | 19.1 | −5.0097 | 2.0 | ⋯ | ⋯ | ⋯ |
| 100391.240 |

|

| 21 | 21.9 | −4.9042 | 1.8 | 171 | 17 | blended with CH3COCH3 a |
| 100391.791 |

|

| 21 | 21.8 | −4.9042 | 1.8 | ⋯ | ⋯ | ⋯ |
Notes.
 and rms are also provided and used to calculate the S/N of the detected lines.
Table 5. Lines of CH3SH Detected toward G+0.693 with Their Corresponding Quantum Numbers (QNs) and Torsional Symmetry (Ts), Logarithm of the Einstein Coefficients ( ), Degeneracy (
 ), and Energy (
 ) of the Upper State
| Rest Frequency | QNs | Ts | gu | Eu |

| rms | Ipeak | S/N | Comments |
|---|---|---|---|---|---|---|---|---|---|
| (MHz) | (K) | (s−1) | (mK) | (mK) | |||||
| 75085.898 |

| A+ | 7 | 8.7 | −5.5086 | 2.7 | 39 | 14 | clean transition |
| 75862.889 |

| A+ | 7 | 3.6 | −5.4444 | 2.3 | 260 | 113 | clean transition |
| 75864.422 |

| E | 7 | 5.1 | −5.4443 | 2.3 | 221 | 96 | clean transition |
| 100110.219 |

| A+ | 9 | 12.3 | −5.0966 | 3.1 | 55 | 18 | clean transition |
| 101139.150 |

| A+ | 9 | 7.3 | −5.0554 | 2.9 | 271 | 93 | clean transition |
| 101139.655 |

| E | 9 | 8.7 | −5.0543 | 2.9 | 230 | 79 | clean transition |
| 101284.366 |

| E | 9 | 13.5 | −5.0818 | 2.9 | 51 | 18 | blended with 
|
| 125130.863 |

| A+ | 11 | 17.1 | −4.7869 | 6.2 | 61 | 10 | slightly blended with 
|
| 126403.834 |

| E | 11 | 13.6 | −4.7556 | 6.4 | 183 | 29 | clean transition |
| 126405.676 |

| A+ | 11 | 12.2 | −4.7556 | 6.4 | 215 | 34 | clean transition |
| 126683.419 |

| A+ | 11 | 18.4 | −4.7707 | 6.5 | 56 | 9 | clean transition |
| 151654.218 |

| E | 13 | 19.6 | −4.5123 | 5.4 | 116 | 22 | clean transition |
| 151660.047 |

| A+ | 13 | 18.2 | −4.5123 | 5.4 | 136 | 25 | clean transition |
| 152129.018 |

| E | 13 | 24.4 | −4.5210 | 4.5 | 52 | 12 | clean transition |
Note. The peak intensity (Ipeak) and rms noise level are also provided and used to calculate the signal-to-noise ratio (S/N) of the detected lines.
Download table as: ASCIITypeset image
Table 6. Lines of 13C34S Detected toward G+0.693 with Their Corresponding Spectroscopic Information and Parameters Derived from the LTE Fit
| Rest Frequency | QNs | gu | Eu |

| rms |

| S/N | Comments |
|---|---|---|---|---|---|---|---|---|
| (MHz) | (K) | (s−1) | (mK) | ( ) ) | ||||
| 45463.424 |

| 3 | 0.0 | −5.8546 | 2.0 | 364 |

| clean transition |
| 90926.026 |

| 5 | 2.0 | −4.8723 | 2.5 | 854 |

| clean transition |
| 136387.028 |

| 7 | 6.6 | −4.3141 | 2.1 | 796 |

| clean transition |
Download table as: ASCIITypeset image
Table 7. Lines of H2CS Detected toward G+0.693 with  and Their Corresponding Spectroscopic Information and Parameters Derived from the LTE Fit
| Rest Frequency | QNs | gu | Eu |

| rms | Ipeak | S/N | Comments |
|---|---|---|---|---|---|---|---|---|
| (MHz) | (K) | (s−1) | (mK) | (K) | ||||
| 101477.8048 |

| 21 | 2.0 | −4.8996 | 2.9 | 1.213 |

| clean transition |
| 103040.447 |

| 7 | 5.0 | −4.8285 | 2.6 | 0.951 |

| clean transition |
| 104617.027 |

| 27 | 18.2 | −4.8599 | 2.1 | 1.169 |

| clean transition |
| 135298.26 |

| 27 | 22.9 | −4.4859 | 7.0 | 1.213 |

| clean transition |
| 137371.21 |

| 9 | 9.9 | −4.438 | 3.1 | 0.823 |

| clean transition |
| 139483.68 |

| 27 | 23.2 | −4.4462 | 2.7 | 1.197 |

| clean transition |
Download table as: ASCIITypeset image
Table 8. Lines of H2C18O Detected toward G+0.693 with Their Corresponding Spectroscopic Information and Parameters Derived from the LTE Fit
| Rest Frequency | QNs | gu | Eu |

| rms |

| S/N | Comments |
|---|---|---|---|---|---|---|---|---|
| (MHz) | (K) | (s−1) | (mK) | ( ) ) | ||||
| 134435.920 |

| 15 | 2.0 | −4.3361 | 6.7 | 839 | >20 | slightly blended with CH3CHO |
| 138770.86 |

| 5 | 3.3 | −4.1697 | 2.7 | 814 | >20 | clean transition |
| 143213.07 |

| 15 | 15.3 | −4.2536 | 2.1 | 824 | >20 | clean transition |
Download table as: ASCIITypeset image
Table 9. Lines of CH3 18OH Detected toward G+0.693 with Their Corresponding Spectroscopic Information and Parameters Derived from the LTE Fit
| Rest Frequency | QNs | Ts | gu | Eu |

| rms |

| S/N | Comments |
|---|---|---|---|---|---|---|---|---|---|
| (MHz) | (K) | (s−1) | (mK) | ( ) ) | |||||
| 46364.313 |

| A | 12 | 0.0 | −4.8985 | 2.8 | 709 | >20 | clean transition |
| 93505.902 |

| A | 20 | 16.6 | −5.6353 | 1.9 | 68 | 7 | blended with t-HC(O)SH |
| 150698.06 |

| E | 12 | 7.8 | −4.7223 | 3.1 | 466 | >20 | clean transition |
| 150704.121 |

| E | 28 | 19.0 | −4.7330 | 3.1 | 127 | 8 | clean transition |
| 150704.173 |

| E | 20 | 12.3 | −4.7266 | 3.1 | 328 | 19 | clean transition |
Download table as: ASCIITypeset image
Table 10. Lines of anti-13CH3CH2OH Detected toward G+0.693 with Their Corresponding Spectroscopic Information and Parameters Derived from the LTE Fit
| Rest Frequency | QNs | gu | Eu |

| rms |

| S/N | Comments |
|---|---|---|---|---|---|---|---|---|
| (MHz) | (K) | (s−1) | (mK) | ( ) ) | ||||
| 32509.32 |

| 9 | 8.2 | −6.4293 | 1.3 | 134 | 19 | clean transition |
| 40435.51 |

| 13 | 17.0 | −6.2050 | 1.5 | 67 | 8 | slightly blended with unidentified transition |
| 44748.194 |

| 9 | 6.0 | −6.3778 | 2.1 | 100 | 9 | clean transition |
| 82170.297 |

| 13 | 13.1 | −5.4772 | 3.5 | 121 | 6 | blended with unidentified transition |
| 82223.219 |

| 7 | 6.0 | −5.5620 | 2.8 | 130 | 9 | clean transition |
| 102934.258 |

| 11 | 8.2 | −5.1178 | 2.6 | 253 | 18 | clean transition |
| 113369.368 |

| 5 | 2.1 | −4.9878 | 6.8 | 262 | 7 | clean transition |
| 143297.176 |

| 9 | 6.3 | −4.8286 | 2.2 | 216 | 18 | clean transition |
| 144465.114 |

| 17 | 22.7 | −4.6339 | 1.7 | 81 | 9 | blended with unidentified transition |
Download table as: ASCIITypeset image
Appendix B: Figures and Tables of 13C34S, H2CS, H2C18O, CH3 18OH, and 13CH3CH2OH
We show a few of the intense lines selected within the targeted frequency coverage in G+0.693 for some of the species used in the molecular abundances calculations in Figure 2. Note that other visible lines not shown in these figures or tables are either heavily blended or in a bad part of the spectra.
Footnotes
- 9
- 10
These are usually referred as carbon-based molecules that have six or more atoms (Herbst & Van Dishoeck 2009).
- 11
Yebes Observatory is operated by the Spanish Geographic Institute (IGN, Ministerio de Transportes, Movilidad y Agencia Urbana).
- 12
MAdrid Data CUBe Analysis is a software developed at the Center of Astrobiology in Madrid: https://cab.inta-csic.es/madcuba/Portada.html.
- 13
Cologne Database for Molecular Spectroscopy (Endres et al. 2016), https://cdms.astro.uni-koeln.de/classic/.
- 14
The moments of inertia of CH3SH frame it in the limiting prolate case,
 .
.
