


Abstract
The possible existence of primordial black holes in the stellar-mass window has received considerable attention because their mergers may contribute to current and future gravitational-wave detections. Primordial black hole mergers, together with mergers of black holes originating from Population III stars, are expected to dominate at high redshifts (z ≳ 10). However, the primordial black hole merger rate density is expected to rise monotonically with redshift, while Population III mergers can only occur after the birth of the first stars. Next-generation gravitational-wave detectors such as the Cosmic Explorer (CE) and Einstein Telescope (ET) can access this distinctive feature in the merger rates as functions of redshift, allowing for direct measurement of the abundance of the two populations and hence for robust constraints on the abundance of primordial black holes. We simulate four months' worth of data observed by a CE-ET detector network and perform hierarchical Bayesian analysis to recover the merger rate densities. We find that if the universe has no primordial black holes with masses of  , the projected upper limit on their abundance fPBH as a fraction of dark matter energy density may be as low as
  , about two orders of magnitude lower than the current upper limits in this mass range. If instead fPBH ≳ 10−4, future gravitational-wave observations would exclude fPBH = 0 at the 95% credible interval.
Export citation and abstract BibTeX RIS
1. Introduction
Over the past few decades, it was suggested that primordial black holes (PBHs) may be formed in the early universe, shortly after the Big Bang (Zel'dovich & Novikov 1966; Hawking 1971; Carr & Hawking 1974). Although various experiments constrain the abundance of these objects (see, e.g., Carr et al. 2021 for a recent review), in certain mass ranges, PBHs could comprise a significant fraction of the dark matter, seed supermassive BHs at high redshift (Volonteri 2010; Clesse & García-Bellido 2015; Serpico et al. 2020), and contribute to current (Clesse & Garcia-Bellido 2020; De Luca et al. 2021a; Franciolini et al. 2022) and future (Chen & Huang 2020; De Luca et al. 2021b, 2021c; Pujolas et al. 2021; Auclair et al. 2022) gravitational-wave (GW) observations.
PBHs generated from the collapse of sizable Gaussian overdensities in the radiation-dominated early universe (Ivanov et al. 1994; Garcia-Bellido et al. 1996; Ivanov 1998; Blinnikov et al. 2016) are expected to possess small spins (De Luca et al. 2019; Mirbabayi et al. 2020) and are not clustered (Ali-Haï 2018; Ballesteros et al. 2018; Desjacques & Riotto 2018; Inman & Ali-Haïmoud 2019; Moradinezhad Dizgah et al. 2019; De Luca et al. 2020a) at the formation epoch. In this scenario, they may gravitationally decouple from the Hubble flow before the matter–radiation equality and get bound in binaries (Nakamura et al. 1997; Ioka et al. 1998) (see Polnarev & Khlopov 1985; Khlopov 2010; Sasaki et al. 2018; Franciolini 2021; Green & Kavanagh 2021 for reviews). These high-redshift (i.e., z ≳ 103) PBHs can produce merging binary black holes (BBHs) of primordial origin, with a merger rate that is expected to increase monotonically with redshift.
High-redshift astrophysical BBHs may also originate from Population III (Pop III) stars (Schneider et al. 2000, 2002, 2003; Kinugawa et al. 2014; Hartwig et al. 2016; Kinugawa et al. 2016; Belczynski et al. 2017). Because these BBHs can only form after the collapse of Pop III stars in the matter-dominated era, the Pop III BBH merger rate is expected to decay at high redshifts, as we approach the birth epoch of the first stars. While observations remain elusive, estimates from cosmological theories and simulations suggest that the first stars might have been born at redshifts z ≲ 50 (Bromm 2006; Tornatore et al. 2007; Trenti & Stiavelli 2009; de Souza et al. 2011; Koushiappas & Loeb 2017; Mocz et al. 2020). Together with the typical time delay between the formation and merger for Pop III stars,  , one expects the epoch of Pop III mergers to start at z ≲ 40 and peak at z ≲ 10 (Kinugawa et al. 2014; Hartwig et al. 2016; Kinugawa et al. 2016; Belczynski et al. 2017; Inayoshi et al. 2017; Liu & Bromm 2020a, 2020b; Kinugawa et al. 2020; Tanikawa et al. 2021b, 2022b).
Observations of these high-redshift populations will be made possible by the proposed next-generation (NG) ground-based GW detectors (Kalogera et al. 2021), the Cosmic Explorer (CE) (Abbott et al. 2017; Reitze et al. 2019; Evans et al. 2021a) and Einstein Telescope (ET) (Punturo et al. 2010; Maggiore et al. 2020), both of which will be able to observe BBHs with a total mass of  at redshifts up to z ∼ 100 (Hall & Evans 2019). Combining these high-redshift BBH observations allows for precise measurements of the branching ratios and detailed properties of PBH and Pop III mergers, and thus for robust constraints on the PBH abundance (typically presented in terms of the fraction fPBH ≡ ΩPBH/ΩDM of the dark matter energy density in the form of PBHs) from direct measurements in the ∼ [10–50] M⊙ mass window, which is the most sensitive mass range of CE and ET (Evans et al. 2021a).
In this study we only make use of a simple, general property of the PBH and Pop III merger rate densities: The former rises monotonically, while the latter decays rapidly as the redshift increases. We first review theoretical predictions for the merger rate densities of these two high-redshift populations and the Bayesian statistical framework in the population analysis. We then simulate four months' worth of data in a detector network of CE and ET with realistic redshift uncertainty estimates and infer the morphology of the merger rate densities at z ≥ 8, relying on redshift measurements only. In the absence of PBH mergers, the derived upper limit on fPBH is almost two orders of magnitude lower than the current constraints. If a fraction of PBHs as low as fPBH ∼ 10−4 exists in the universe, we show that fPBH could be measured precisely. Finally, we discuss why our results are conservative and how one could further improve the constraints by including any other feature that might help distinguish the two channels, namely BBH mass, spin, and eccentricity.
2. Merger Rates Densities at High Redshift
2.1. Primordial Black Hole Mergers
Throughout this paper, we assume the standard PBH formation scenario describing the collapse of large Gaussian overdensities in the radiation-dominated early universe (Zel'dovich & Novikov 1967; Hawking 1974; Carr 1975; Chapline 1975; Ivanov et al. 1994; Garcia-Bellido et al. 1996; Ivanov 1998; Blinnikov et al. 2016; Musco et al. 2021; Escrivà 2022). In this setting, PBHs follow a Poisson spatial distribution at formation (Ali-Haï 2018; Ballesteros et al. 2018; Desjacques & Riotto 2018; Inman & Ali-Haïmoud 2019; Moradinezhad Dizgah et al. 2019), which triggers PBH binary formation already at very high redshift. Indeed, it was shown that this process typically takes place before the matter–radiation equality, and it is due to gravitational attraction leading to PBH pairs decoupling from the Hubble flow (Nakamura et al. 1997; Ioka et al. 1998). We will assume that the PBH mass distribution is described by a log-normal function

centered at the mass scale Mc (not to be confused with the binary chirp mass) with width σ. This model-independent parameterization of the mass function can describe a population arising from a symmetric peak in the power spectrum of curvature perturbations in a wide variety of formation models (see e.g., Dolgov & Silk 1993; Carr et al. 2017) and is often used in the literature to set constraints on the PBH abundance from GW measurements (Garcí 2017; Chen & Huang 2018; Raidal et al. 2019; De Luca et al. 2020b; Gow et al. 2020; Hall et al. 2020; De Luca et al. 2021a, 2021b; Bavera et al. 2022; Bhagwat et al. 2021; Franciolini et al. 2022; Hütsi et al. 2021; Mukherjee & Silk 2021; Mukherjee et al. 2022; Wong et al. 2021).
PBHs are subject to the accretion of baryonic matter during their cosmic evolution, which can impact both their mass and spin distributions (De Luca et al. 2020c, 2020d), as well as hardening PBH binaries and enhancing the merger rate (De Luca et al. 2020b). We refer to De Luca et al. (2020b) for a thorough discussion of uncertainties in the accretion model. In the mass range of interest for next-generation detectors, similar to the one currently probed by the LIGO/Virgo/KAGRA Collaboration (LVKC) detectors, accretion is never efficient for z ≳ 30, while it may have an impact on the PBH population at smaller redshift. In this work, we ignore the role of accretion. This means that the constraints we set on the PBH abundance based on merger rate estimates are the least stringent and may be translated to smaller values of fPBH if a strong accretion phase is assumed. This is because accretion enhances the merger rate, allowing to probe smaller abundances.
We compute the differential volumetric PBH merger rate density following Raidal et al. (2019), Vaskonen & Veermäe (2020), and De Luca et al. (2020a, 2020b) as

where M = m1 + m2, η = m1 m2/M, and t0 is the current age of the universe. The suppression factor S < 1 accounts for environmental effects in both the early- and late-time universe. In the early universe, these are a consequence of interactions between PBH binaries and both the surrounding dark matter inhomogeneities, as well as neighboring PBHs at high redshift (Ali-Haïmoud et al. 2017; Eroshenko 2018; Liu et al. 2019; Raidal et al. 2019). In the late universe, they are due to successive disruption of binaries that populate PBH clusters formed from the initial Poisson conditions (De Luca et al. 2020a; Jedamzik 2020a, 2020b; Tkachev et al. 2020; Vaskonen & Veermäe 2020; Young & Hamers 2020; Hütsi et al. 2021; Trashorras et al. 2021) throughout the evolution of the universe. An analytic expression for S can be found in Hütsi et al. (2021) and, for the small abundance values of interest here, it can be approximated as

Therefore, assuming a small-enough abundance fPBH ≪ 10−3, one can write the PBH merger mass function as

This reveals a key feature that we will exploit in our analyses, namely that the volumetric merger rate density of PBHs has a power-law dependence on the age of the universe t(z) extending up to z ≳ 103:

Given a choice of mass function and fPBH, the local rate density of PBH mergers can be obtained by integrating Equation (2), evaluated at redshift z = 0, over m1 and m2. The result of this integration will be used below to translate posterior distributions of the local PBH merger rate to constraints on the abundance fPBH.
2.2. Pop III Mergers
We use the phenomenological model for the volumetric merger rate density of Pop III BBHs from Ng et al. (2021). This model is a simple fit to the merger rate density predicted from population synthesis studies (Belczynski et al. 2017):

where aIII, bIII, and zIII characterize the upward slope at z < zIII, the downward slope at z > zIII, and the peak location of the volumetric merger rate density, respectively. The normalization of  is the same as in Ng et al. (2021): We first choose the ratio between the peak of
  and the Pop I/II merger rate density to be 1/10 (supported by population synthesis studies; e.g., Belczynski et al. 2017; Tanikawa et al. 2022b) and obtain
  by matching the simulated Pop I/II merger rate density (Belczynski et al. 2016; Ng et al. 2021) with a local merger rate density of 25 Gpc−3 yr−1, consistent with current measurements (Abbott et al. 2021; Green & Kavanagh 2021). Our choice of
  corresponds to a substantial astrophysical foreground that is a few times larger than the tail of the Pop I/II merger rate beyond z > 8, and thus we can safely ignore the contribution of Pop I/II mergers.
The initial conditions of Pop III stars, and hence the mass spectrum of Pop III BBHs, are highly uncertain (Belczynski et al. 2017; Inayoshi et al. 2017; Kinugawa et al. 2020, 2021a; Tanikawa et al. 2021a; Kinugawa et al. 2021b; Tanikawa et al. 2021b; Hijikawa et al. 2021; Tanikawa et al. 2022b). We further assume the mass spectrum of Pop III BBHs to be exactly the same as that of PBH mergers. This implies that the mass spectra of the two populations are indistinguishable, and only redshift measurements are informative in the inference of branching ratios between the two populations. This is a conservative approach, as differences in the mass spectrum could be used to distinguish between the two populations, yielding more precise measurements than the ones we present below.
3. Statistical Model
It is more convenient to work with the normalized redshift distribution of the kth subpopulation,

where dVc /dz is the differential comoving volume and the factor of 1 + z accounts for the cosmological time dilation. The differential merger rate of the whole population in the detector frame as a function of redshift is then

where βPBH is the fraction of the PBH merger rate to the total merger rate, and R = ∫(dR/dz)dz is the total merger rate in the detector frame. In this phenomenological model, we have five hyperparameters: (aIII, bIII, zIII, βPBH, R).
Given Nobs BBH detections,  , we can use hierarchical Bayesian inference to extract the posterior of the hyperparameters of dR/dz (Farr et al. 2015; Mandel et al. 2019; Thrane & Talbot 2019; Wysocki et al. 2019; Vitale et al. 2020). Because we focus on the redshift range in which the GW detectors are not fully sensitive to the emission from BBHs (Hall & Evans 2019), we have to take into account the selection effect due to the detection efficiency as a function of redshift (Mandel et al. 2019; Thrane & Talbot 2019; Wysocki et al. 2019; Vitale et al. 2020). In this study, we only infer dR/dz, but not the mass function of the two populations. To achieve this, we assume that the BBH mass measurements of individual events are completely uninformative. The mathematical details of the statistical inference are given in Appendix A.
The phenomenological hyperparameters implicitly depend on the physical parameter of interest, i.e., the PBH abundance fPBH. To obtain the posterior of fPBH, one first obtains the posterior of the PBH merger rate density by subtracting the contribution of Pop III mergers from Equation (8). Then, if the two PBH mass function parameters, (Mc
, σ) are known or measured, one can convert the posterior of  to the posterior of fPBH through the normalization in Equation (2). Besides the phenomenological model discussed above, we also employ Gaussian process regression (GPR) to repeat the analysis with minimal assumptions. In this unmodeled approach, we parameterize dR/dz as a piecewise-constant function over several redshift bins and assume that the rate of each bin is drawn from a Gaussian process with a squared-exponential kernel. This model does not contain any information on the two subpopulations, hence one cannot directly infer fPBH without further modeling assumptions. However, it serves as an independent cross-check of the phenomenological approach in which model systematics may be of concern. The mathematical details of GPR are given in Appendix B.
4. Simulations
In the following, we consider five simulated universes with different ratios of βPBH = 0, 1/9, 1/5, 1/3, and 1/2. The GW detector network consists of one CE in the United States and one ET in Europe. The Pop III merger rate density is fixed to the benchmark values of (aIII, bIII, zIII) = (0.66, 0.3, 11.6), which are the best-fit values
7
to the simulations in Belczynski et al. (2017). We simulate 800 Pop III BBHs and 800βPBH/(1 − βPBH) primordial BBHs whose true redshifts are drawn from  and
and  , respectively, and true masses are sampled from the same mass function in Equation (4) with (Mc
, σ) = (30M⊙, 0.3), which encompasses the most sensitive mass range of the next-generation GW detectors. This amounts to four months' worth of data. To create a mock data set of redshift measurements, we assume a log-normal likelihood for each simulated event. The width of the likelihood scales inversely with the signal-to-noise ratio (S/N) of the signal and is calibrated by the simulated catalog of the full Bayesian posteriors using IMRPhenomPv2 waveforms (Hannam et al. 2014; Husa et al. 2016; Khan et al. 2016; Vitale & Evans 2017) (see Section 6 for a discussion about higher-order modes). The details of the calibration are presented in Appendix C.
, respectively, and true masses are sampled from the same mass function in Equation (4) with (Mc
, σ) = (30M⊙, 0.3), which encompasses the most sensitive mass range of the next-generation GW detectors. This amounts to four months' worth of data. To create a mock data set of redshift measurements, we assume a log-normal likelihood for each simulated event. The width of the likelihood scales inversely with the signal-to-noise ratio (S/N) of the signal and is calibrated by the simulated catalog of the full Bayesian posteriors using IMRPhenomPv2 waveforms (Hannam et al. 2014; Husa et al. 2016; Khan et al. 2016; Vitale & Evans 2017) (see Section 6 for a discussion about higher-order modes). The details of the calibration are presented in Appendix C.
As we are only interested in the high-redshift region, where the astrophysical BBHs originated from Pop I/II stars are negligible, we downselect the events whose true redshifts are above 8. This is justified by the comparison between the Pop I/II merger rates and the Pop III merger rate in simulation studies (Belczynski et al. 2017; Tanikawa et al. 2022b). Finally, we discard signals that are below a network S/N threshold of 12. The remaining events form the total set of Nobs detections. We note that Nobs depends on the merger mass function and total merger rate because the S/N depends on both the masses and redshifts of the BBHs.
5. Results
We first compare the measurement of fPBH in all universes derived from the modeled hierarchical inference. The resulting posteriors of fPBH,

in the various universes we simulated are shown in Figure 1. This expression assumes that Mc
and σ are known and equal to the "true" values used to generate the simulated signals, while in reality, one should marginalize over those unknown parameters. However, we observe that varying Mc
within [10, 50] M⊙, which is the typical uncertainty in the source-frame primary mass at z ∼ 30 (Ng et al. 2022), only changes the true value of fPBH by  . Similarly, the variation of σ in [0.1, 0.5] has a negligible impact on the values of fPBH. As such, we skip the marginalization over the uninformative prior of (Mc
, σ), which would roughly average out the variation in the values of fPBH within the mass range of interest. Even with four months of observations, the posteriors for βPBH ≥ 1/9 exclude fPBH = 0 within the 95% highest-posterior-density credible interval (CI). This implies we can measure fPBH ∼ 10−4 with a relative uncertainty of ≲ 50% in realizations of a universe with more than 10% PBH mergers compared to Pop III mergers. In a universe without PBH mergers (βPBH = 0), we can constrain the upper limit of fPBH ≲ 6 × 10⁻⁵ at the 95% CI, leading to more than an order-of-magnitude improvement when compared to the existing constraints in this mass range, which are dominated by the one drawn from the current GW LVKC data.
. Similarly, the variation of σ in [0.1, 0.5] has a negligible impact on the values of fPBH. As such, we skip the marginalization over the uninformative prior of (Mc
, σ), which would roughly average out the variation in the values of fPBH within the mass range of interest. Even with four months of observations, the posteriors for βPBH ≥ 1/9 exclude fPBH = 0 within the 95% highest-posterior-density credible interval (CI). This implies we can measure fPBH ∼ 10−4 with a relative uncertainty of ≲ 50% in realizations of a universe with more than 10% PBH mergers compared to Pop III mergers. In a universe without PBH mergers (βPBH = 0), we can constrain the upper limit of fPBH ≲ 6 × 10⁻⁵ at the 95% CI, leading to more than an order-of-magnitude improvement when compared to the existing constraints in this mass range, which are dominated by the one drawn from the current GW LVKC data.

Figure 1. Posteriors of fPBH given (Mc , σ) = (30M⊙, 0.3) at βPBH = 0, 1/9, 1/5, 1/3, and 1/2. The true values of fPBH corresponding to βPBH are marked by squares in each violin plot. The solid black lines indicate the 95% CIs. The prior is reweighted to be uniform in fPBH.
Download figure:
Standard image High-resolution imageNext, we explore how differences in the PBH mass spectrum affect the projected upper limit. To bypass the need to repeat the mock data analysis for each set of true (Mc
, σ), we account for the relative change of Nobs caused by the variation of the merger mass function. Making the reasonable assumption that the statistical uncertainty in the hierarchical inference has reached the  regime, our goal is then accomplished by scaling the uncertainty of fPBH with
  .
.
In Figure 2, we show the projected upper limit of fPBH as a function of Mc ∈ [10, 50] M⊙ with one year 8 of observations (blue lines, nearly entirely overlapping) and compare it with the current constraints (see the caption). Different blue curves correspond to different values of σ in the range [0.1–0.5]. This constraint worsens quickly for larger or smaller masses as the NG detectors' horizon shrinks and the number of observations at high redshift drastically decreases outside of the mass range we consider. Figure 2 shows how NG detectors can improve the upper limit derived from the current GW observations (LVKC curve) within the stellar-mass window by almost two orders of magnitude. In the near future, the number of BBH observations made by the advanced detectors at design sensitivity may increase by a factor of ∼10 within z ≲ 2 (Aasi et al. 2015; Acernese et al. 2015; Green & Kavanagh 2021; Akutsu et al. 2021), and hence the current upper limit on fPBH may decrease by a factor of ∼3 (Wong et al. 2021). In practice, local constraints rely on being able to distinguish the mass and spin spectra between primordial and astrophysical BBHs (Franciolini et al. 2022, 2022; Franciolini & Pani 2022). Therefore, interpreting these local BBHs will still be limited by the model uncertainties of other astrophysical formation channels dominating the late-time universe, which heavily depends on the detailed dynamics of binary formation and stellar evolution. In contrast, the projected upper limit derived in this work takes advantage of the distinctive "smoking-gun" feature of the redshift evolution at high redshifts and is only limited by the actual Pop III merger rate density in the high redshift.

Figure 2. Projected upper limit on fPBH as a function of Mc
drawn from the merger rate density measurement in the simulated universe without PBHs and scaled to one year of observations. We also show the current most stringent constraints in this mass range coming from microlensing searches (assuming Poisson initial condition at formation; Gorton & Green 2022; Petač et al. 2022) by MACHO/EROS (E) (Alcock et al. 2001; Allsman et al. 2001) and Icarus (I) (Oguri et al. 2018); measurements of galactic X-rays (Xr) (Manshanden et al. 2019) and X-ray binaries (XRayB) (Inoue & Kusenko 2017); CMB distortions by spherical or disk accretion (Planck S and Planck D, respectively) (Ali-Haïmoud & Kamionkowski 2017; Serpico et al. 2020); and dwarf galaxy heating (DGH) (Lu et al. 2020; Takhistov et al. 2022). LVKC stands for the constraint coming from the LIGO/Virgo/Kagra Collaboration merger rate measurements (Ali-Haïmoud et al. 2017; Raidal et al. 2017; Vaskonen & Veermäe 2020; Franciolini et al. 2022; Wong et al. 2021). We ignore the role of accretion, which has been shown to affect constraints on masses larger than  (De Luca et al. 2020b, 2020c, 2020d). For more details, see the review in Carr et al. (2021). In yellow, we show forecasts for the limits that will be set by microlensing searches with the Rubin observatory (Drlica-Wagner et al. 2019; Bird et al. 2022).
Download figure:
Standard image High-resolution imageNext, we compare our phenomenological results on the merger rate density—Figure 3, top panel—with what we obtain using the unmodeled GPR approach (bottom panel) in a universe with βPBH = 1/5 (fPBH ≈ 10−4). With the phenomenological model we can measure the peak of the Pop III merger rate density within ∼30% relative uncertainty, consistent with previous studies (Ng et al. 2021). The 95% CIs of the merger rate densities of the two populations at z ≳ 30 do not overlap with each other. With the GPR model, we obtain a similar result, except the posterior for each redshift bin has a larger relative uncertainty, which grows to a factor of 10 in the last redshift bin 32 ≤ z < 40. In all cases, the true merger rate densities lie within the 95% CI. In Appendix D, we list the hyperpriors used in both models and show the full hyperposterior of the phenomenological model for a universe with βPBH = 1/5. We stress that the inference of the hyperparameters, and thus of the merger rate, is not affected by the assumption that Mc and σ are known.

Figure 3. Posterior of the merger rate densities of the total mergers (black), PBH mergers (green), and Pop III mergers (red) using phenomenological models (top panel) and Gaussian process regression (bottom panel) in a universe with βPBH = 1/5 (fPBH ≈ 10−4). The darker (light) color band corresponds to 68% (95%) CI. The dashed and solid lines indicate the median of the inferred rate densities and the true rate densities, respectively. Because we cannot model each subpopulation in GPR, there are no posteriors of the merger rate densities of the individual subpopulations.
Download figure:
Standard image High-resolution imageWe can perform a back-of-the-envelope estimate of how increasing the Pop III merger rate would affect the upper limit on fPBH. While the noise floor increases with the actual Pop III merger rate density, the uncertainty of the total merger rate also decreases with more detectable sources. This uncertainty may be directly translated to an upper limit on fPBH because the excessive fluctuation may be fully misidentified as PBH mergers at worst. Let us assume the average Pop III merger rate density is  in the high-redshift region 25 ≤ z ≤ 40. There are two possible sources of uncertainties on the merger rate: Poisson fluctuation (scaling as
  ) and the individual redshift measurement uncertainties. To be conservative, we calibrate the uncertainty of the total merger rate by the posteriors of the ,GPR merger rate model, that is, ∼4 Gpc−3 yr−1 at
  between 25 ≤ z ≤ 40 (Figure 3). The expected uncertainty of the total merger rate density in this redshift range is
  within four months of observations. For fPBH ≲ 10−3, we have
  , and hence the upper limit on fPBH scales as
  for one year of observations. As a validation of this estimate, the scaled upper limit is ∼4 × 10⁻⁵ for r ∼ 0.1 Gpc−3yr−1 in our simulation, consistent with the value inferred by the phenomenological model. The scaling of r1/4 causes a slow increase in the upper limit of fPBH. In other words, our projected upper limit on fPBH does not weaken and does not exceed fPBH ≲ 10−4, unless the Pop III merger rate density in the high-redshift region is ∼100 higher than the current estimate suggested by population synthesis studies (e.g., Hartwig et al. 2016; Belczynski et al. 2017; Liu & Bromm 2020b; Hijikawa et al. 2021; Tanikawa et al. 2022b).
6. Discussion
We have shown that a measurement of the redshift evolution of high-redshift BBHs detectable by NG detectors can lead to a two-orders-of-magnitude improvement on the constraints of the PBH abundance relative to the current constraints derived by the LVKC merger rate measurements. Considering a mixture of stellar-mass BBHs originating from Pop III stars and PBHs, we simulated four months' worth of data at z ≥ 8 with a network of CE in the US and ET in Europe. Using hierarchical Bayesian inference with a phenomenological model of the merger rate density, we may measure a nonzero PBH abundance as low as fPBH ≳ 1 × 10⁻⁴ within an uncertainty of ∼50%. If, instead, the data do not support an excess of BBHs beyond z ≳ 30, we may obtain an upper limit of  . The total merger rate density inferred by a Gaussian process model, while showing a larger uncertainty, is also consistent with the phenomenological analysis.
The inference of fPBH benefits mainly from the distinctive features in the redshift evolution of the Pop III and PBH merger rates: As the redshift increases, the former decays quickly, while the latter rises monotonically. This feature helps in measuring the relative abundance between the two populations, and hence the PBH abundance from the inferred PBH merger rate density, even in the absence of other distinguishing features, e.g., the mass spectra. Even though the quoted figure of merit depends on the detailed assumptions on the Pop III merger rate density at high redshifts, our projected upper limit is a conservative estimate for the following reason. The normalization of the Pop III rate used in this study already supports a significant number of detectable Pop III BBHs beyond z ≳ 8 when compared to Pop I/II BBHs. If the actual Pop III rate were much smaller, the fewer Pop I/II mergers would become the "noise floor," and the derived upper limit of fPBH would decrease even further. One may also worry that a PBH population could modify the Pop III formation scenario studied assuming ΛCDM. As shown by recent work (Liu et al. 2022), the small values of the PBH abundance considered in this work are not expected to have an impact on the formation of Pop III stars.
We end by discussing a few caveats associated with our analyses, as well as possible future avenues. First, we have assumed that the GWs are dominated by the (2, 2) harmonic, which limits the precision of distance measurements due to the distance–inclination degeneracy (Chen et al. 2019; Usman et al. 2019). Ng et al. (2022) show that including higher-order modes in the waveform modeling may improve the precision of distance measurements by ∼30%–50% for stellar-mass BBHs at z ≥ 10, which propagates to an improvement in the measurement of the merger rate density, and hence of fPBH. Second, we have assumed that the mass and spin spectra between Pop III and PBH mergers are the same. This is generally not expected as their formation mechanisms are different in nature. A joint inference of the distribution of redshift, masses, and spins may provide additional information for distinguishing these two high-redshift populations (Franciolini et al. 2022). This also implies that it is not obvious that measuring Mc and σ from the data and marginalizing over them—instead of fixing them to some value as we have done—will necessarily make the inference on fPBH more uncertain. While extra degrees of freedom generally increase the statistical uncertainty in each parameter, information on the mass would provide an additional way of distinguishing the two channels, thus reducing the uncertainty.
Finally, the main modeling uncertainty comes from the initial conditions of the Pop III stars, which directly affect the nominal value of the Pop III merger rate density (Belczynski et al. 2017; Tanikawa et al. 2021a, 2021b; Kinugawa et al. 2021c; Hijikawa et al. 2021; Tanikawa et al. 2022a, 2022b). In this work, we have chosen the benchmark values of (aIII, bIII, zIII) by fitting the simulations of Belczynski et al. (2017). We note that recent studies have explored the impact of the initial conditions of Pop III stars on the merger rate of the black holes they form, finding a similar behavior for their decaying tails but smaller redshift peaks (Kinugawa et al. 2016; Belczynski et al. 2017; Kinugawa et al. 2020; Hijikawa et al. 2021; Tanikawa et al. 2022b). Our chosen values are thus conservative because a higher redshift for the peak of Pop III black holes would decrease the contrast between that population and the PBBHs. This may be better constrained by near-future facilities such as the James Webb Space Telescope, Euclid, or the Roman space telescope, which may probe the properties of Pop III stars by gravitational lensing in blind surveys of Pop III galaxies (Vikaeus et al. 2022).
The authors would like to thank Valerio De Luca, Vishal Baibhav, and Kaze Wong for suggestions and comments. G.F. and K.K.Y.N. thank Johns Hopkins University for kind hospitality during the completion of this project. K.K.Y.N. and S.V., members of the LIGO Laboratory, acknowledge the support of the National Science Foundation through the NSF grant No. PHY-1836814. LIGO was constructed by the California Institute of Technology and Massachusetts Institute of Technology with funding from the National Science Foundation and operates under Cooperative Agreement No. PHY-1764464. E.B. is supported by NSF grant Nos. AST-2006538, PHY-2207502, PHY-090003, and PHY-20043, and NASA grants No. 19-ATP19-0051, 20-LPS20- 0011 and 21-ATP21-0010. This work has received funding from the European Unions Horizon 2020 research and innovation program under the Marie Skłodowska-Curie grant agreement No. 690904. A.R. is supported by the Swiss National Science Foundation (SNSF), project The Non-Gaussian universe and Cosmological Symmetries, project number: 200020-178787. G.F. and P.P. acknowledge financial support provided under the European Union's H2020 ERC, Starting Grant agreement no. DarkGRA-757480, under the MIUR PRIN, FARE programmes (GW-NEXT, CUP: B84I20000100001) and H2020-MSCA-RISE-2020 GRU. This is ET document ET-0068A-22 and CE document CE-P2200005.
Appendix A: Hierarchical Bayesian Inference with Selection Effect
Here, we review the mathematical details of the hierarchical Bayesian inference framework (Farr et al. 2015; Mandel et al. 2019; Thrane & Talbot 2019; Wysocki et al. 2019; Vitale et al. 2020). In the following, we assume that the mass distribution is nonevolving and focus on the redshift measurements alone. In both the phenomenological and GPR models, the differential merger rate in the detector frame,  , depends on the hyperparameters (Λ, R) that control the morphology and the normalization, respectively.
Given a set of Nobs observations  , the posterior of Λ in the presence of the selection effect is

where  is the set of Mi
samples drawn from the individual likelihood of the ith redshift measurement LGW(zi
) ≡ p(di
∣zi
) obtained from GW observations. We approximate the integrals in the second line by an importance sum in the third line of Equation (A1). The remaining pieces are the hyperprior on the hyperparmeters, π(Λ, R), the time window over which observations occur in the detector frame, T, and the detectable total rate
is the set of Mi
samples drawn from the individual likelihood of the ith redshift measurement LGW(zi
) ≡ p(di
∣zi
) obtained from GW observations. We approximate the integrals in the second line by an importance sum in the third line of Equation (A1). The remaining pieces are the hyperprior on the hyperparmeters, π(Λ, R), the time window over which observations occur in the detector frame, T, and the detectable total rate  that accounts for the selection effect (Mandel et al. 2019; Thrane & Talbot 2019; Wysocki et al. 2019; Vitale et al. 2020),

where  is the detection efficiency of sources with a full set of parameters θ (including masses, spins, redshift, etc.). In our simulation, a source is detectable if its network S/N is larger than 12. To estimate
  , we first perform a Monte Carlo simulation of the sources drawn from a baseline population that can surpass the S/N threshold. The baseline redshift distribution is constant in merger rate density, p0(z) ∝ dVc
/dz/(1 + z). The mass distribution is the same as in the simulations (see Equation (1) in the main text), and we conservatively assume that measurements of the mass spectrum are uninformative. Hence, the selection effect due to the variation of the mass spectrum only changes the total number of observations. This has been accounted for in the scaling of the projected uncertainties shown in the main text. We fix the spins to be zero and use uniform priors on other parameters, such as the sky location, orbital orientation, and polarization angle. Once we have a set of parameters of Nsel sources that surpass the S/N threshold,
, we first perform a Monte Carlo simulation of the sources drawn from a baseline population that can surpass the S/N threshold. The baseline redshift distribution is constant in merger rate density, p0(z) ∝ dVc
/dz/(1 + z). The mass distribution is the same as in the simulations (see Equation (1) in the main text), and we conservatively assume that measurements of the mass spectrum are uninformative. Hence, the selection effect due to the variation of the mass spectrum only changes the total number of observations. This has been accounted for in the scaling of the projected uncertainties shown in the main text. We fix the spins to be zero and use uniform priors on other parameters, such as the sky location, orbital orientation, and polarization angle. Once we have a set of parameters of Nsel sources that surpass the S/N threshold,  , we can evaluate the integral in Equation (A2) by importance sampling and reweighing the baseline population prior. In summary, we approximate Equation (A2) in the redshift-only analysis to be

Appendix B: Gaussian Process Regression
This section provides details on the implementation of the GRP model to infer  over finite redshift bins. We define dR/dz as a piecewise-constant function over W = 8 redshift bins between 8 ≤ z ≤ 40. The bins are uniformly distributed in each redshift range: 4 bins in [8, 16], 2 bins in [16, 24], and 2 bins in [24, 40]. We intentionally choose coarse intervals to make sure each bin has enough samples and avoid numerical fluctuations. The merger rate
  is thus

where ΔRi
is the merger rate in ith redshift bin Δzi
≡ zi
− zi−1, so that  . Following Ng et al. (2021), we infer
  in natural-log space for computational efficiency. The Gaussian process prior is based on a squared-exponential kernel on
  that prevents overfitting (Foreman-Mackey et al. 2014),

where  is the midpoint of the ith redshift bin,
  is the variance of {Xi
}, and l is the correlation length in redshift space. The multivariate Gaussian process prior on the vector of binned merger rate
is the variance of {Xi
}, and l is the correlation length in redshift space. The multivariate Gaussian process prior on the vector of binned merger rate  with a mean vector
μ
X
and a covariance matrix
K
≡ {Kij
} is
with a mean vector
μ
X
and a covariance matrix
K
≡ {Kij
} is

and we decompose K into a lower-triangular matrix L ,

where  follows from a multivariate standard normal distribution. Because we know that dR/dz is proportional to dVc
/dz/(1 + z), we choose the mean vector to be
follows from a multivariate standard normal distribution. Because we know that dR/dz is proportional to dVc
/dz/(1 + z), we choose the mean vector to be


so that the variable ΔμX captures the fluctuation of R.
Appendix C: Calibration of the Mock Likelihood
We approximate the redshift likelihood as a log-normal distribution. Calibrated by the simulations in Vitale & Evans (2017) using the IMRPhenomPv2 waveform (Hannam et al. 2014; Husa et al. 2016; Khan et al. 2016), the relative uncertainty of redshift scales linearly with the true redshift (Ng et al. 2021). This uncertainty relation is only valid for the redshift range with a negligible selection effect. At larger redshift, the S/Ns of the sources are close to the threshold, and the redshift uncertainties no longer follow the linear scaling. In this study, we instead calibrate the standard deviation of the log-normal,  , as a function of network S/N, ρnet:

for the detector network consisting of CE in the US and ET in Europe. This returns a ∼20% 1σ relative uncertainty for ρnet = 12. We note that this fit only reflects the median of the uncertainties in the simulation set (Vitale & Evans 2017). The actual uncertainty obtained by full Bayesian inference can deviate by a factor of 2 from the fit at each ρnet. This is because using ρnet alone cannot capture the correlation between redshift and other extrinsic parameters, which may deform the marginalized redshift likelihood.
Appendix D: Hyperpriors and Hyperposteriors
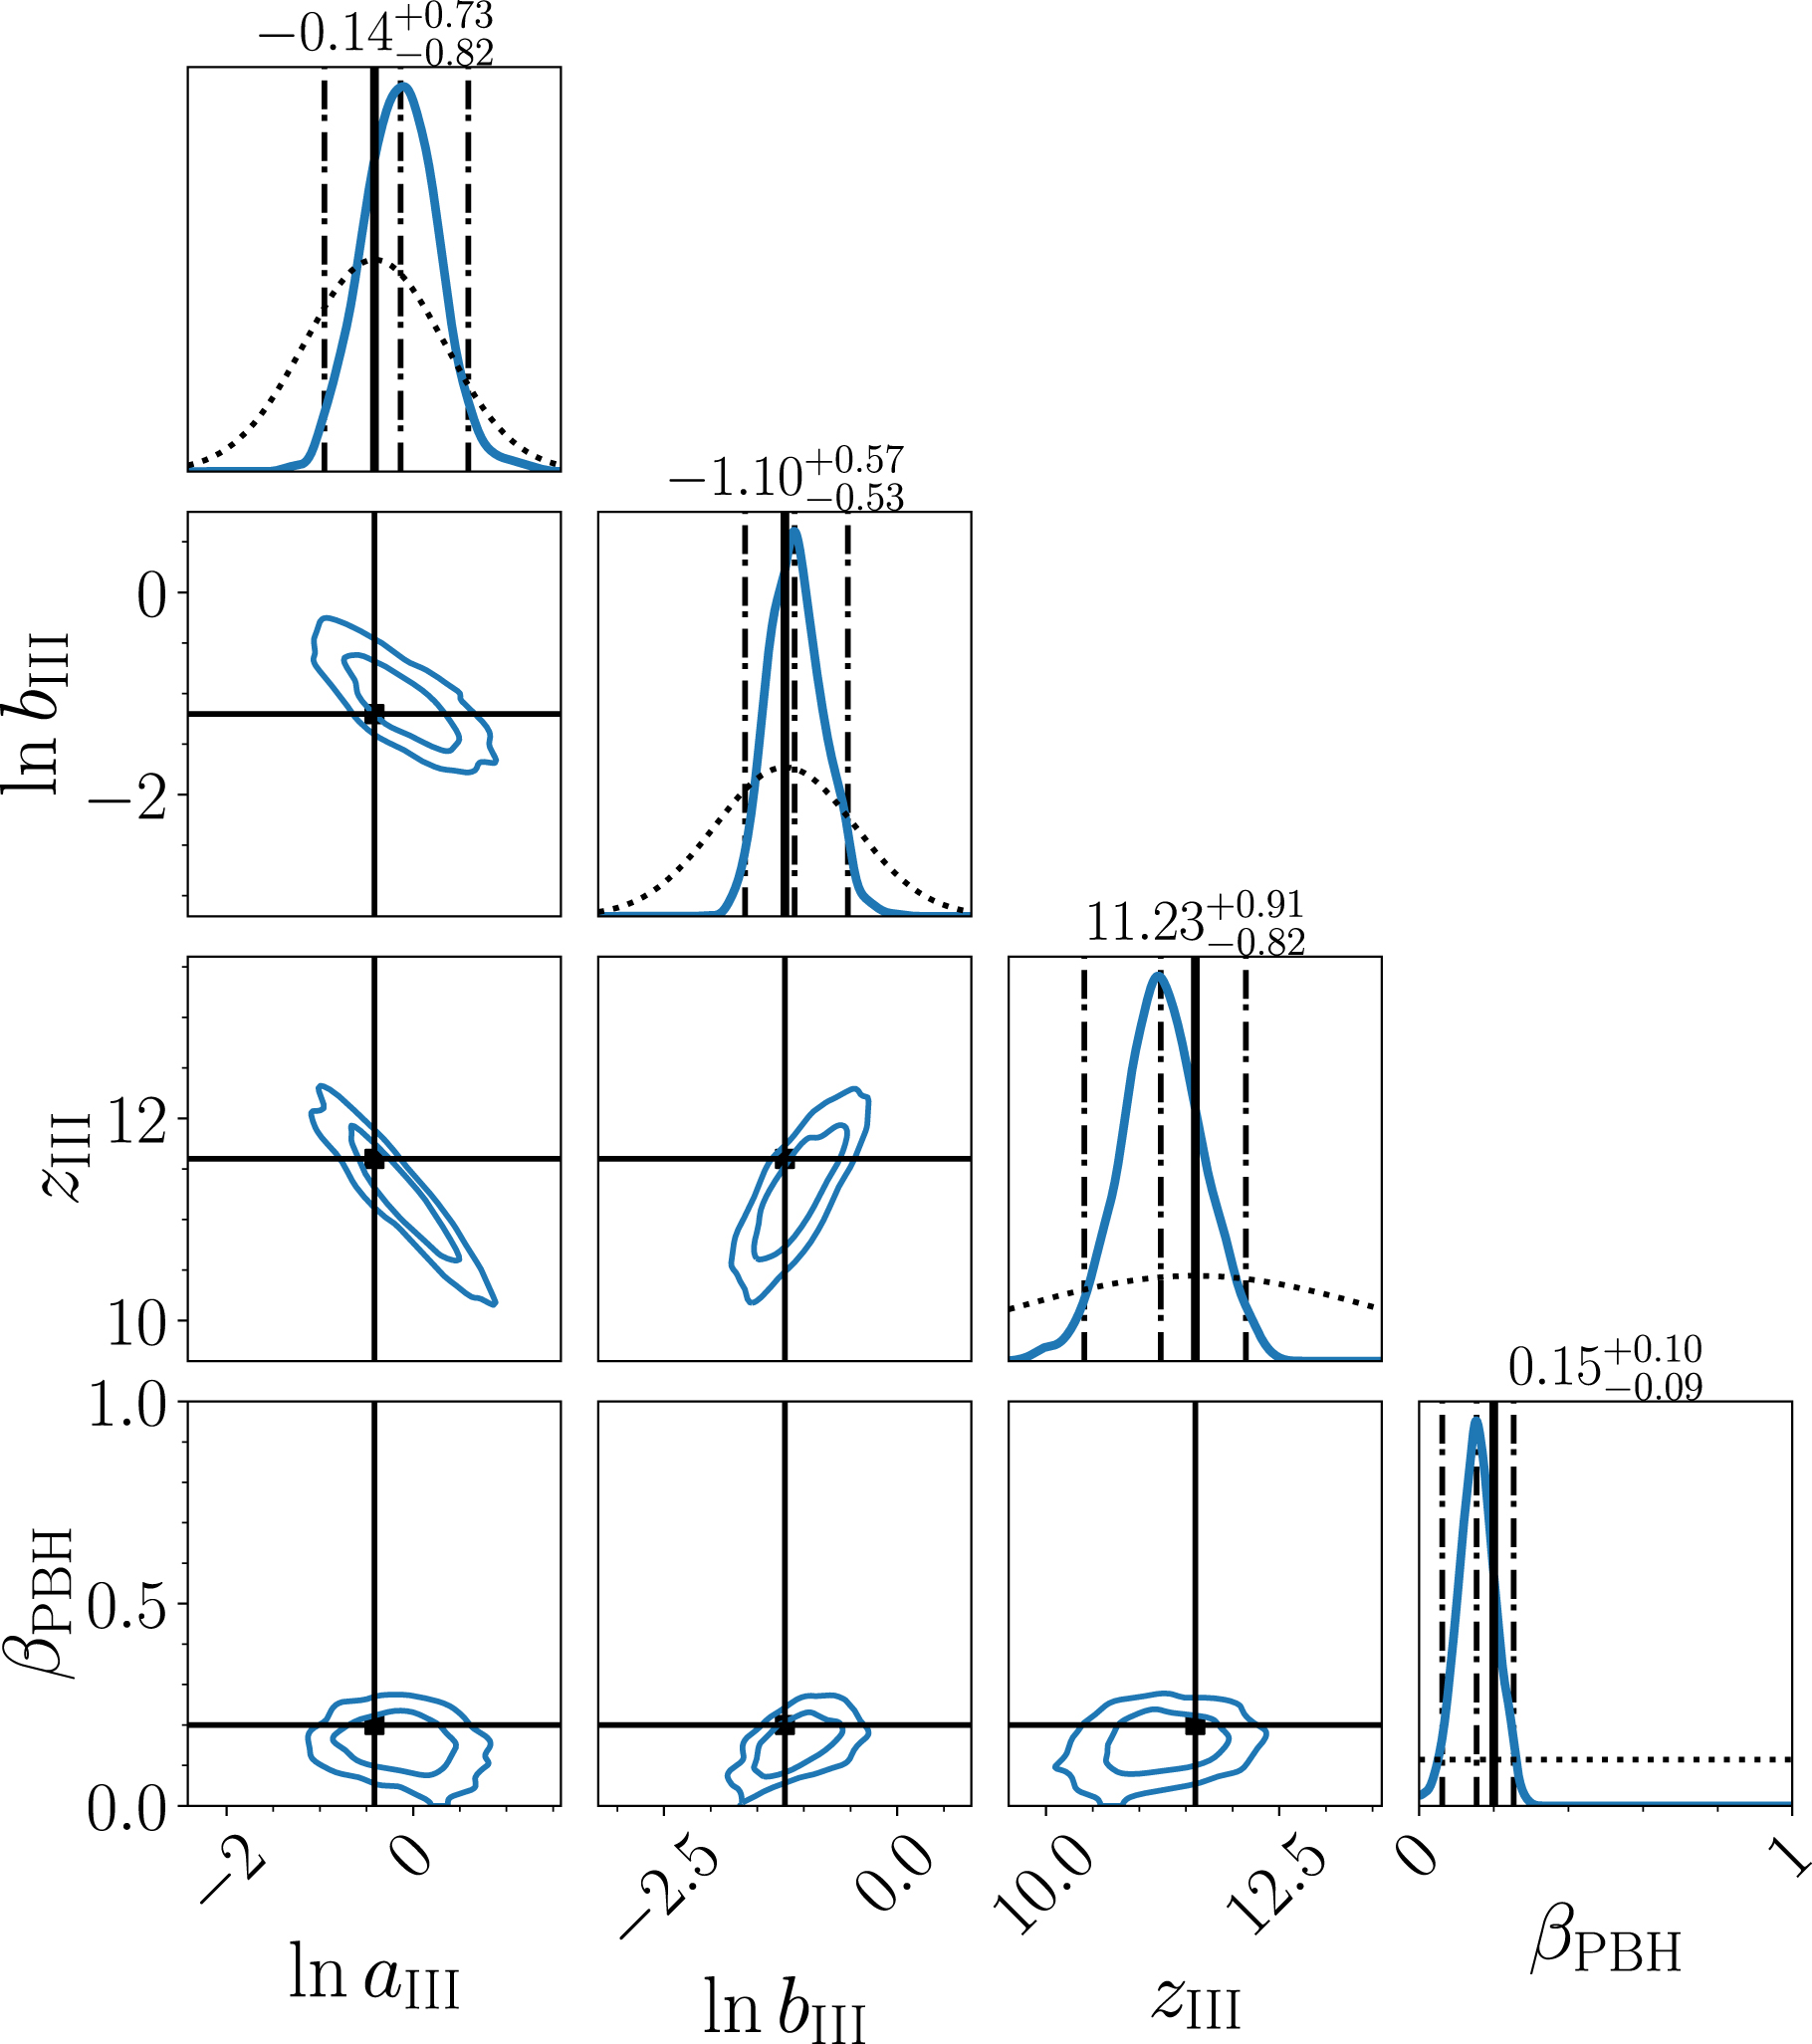
The priors on the hyperparameters of the GPR model and phenomenological model, ΛGPR,i and ΛPM,i , are tabulated in Tables 1 and 2, respectively. Figure 4 shows the corner plot of the posteriors of the four hyperparameters, (aIII, bIII, zIII, βPBH), for a universe with βPBH = 1/5.

Figure 4. Corner plot of the posteriors of the four hyperparameters (aIII, bIII, zIII, βPBH), for a universe with βPBH = 1/5. 2D contours and black dashed lines represent the 68% and 95% CIs of the marginalized 2D and 1D posteriors, respectively. True values are marked by black solid lines. Dotted lines in the diagonal slots show the uncorrelated priors on the hyperparameters.
Download figure:
Standard image High-resolution imageTable 1. Hyperpriors for the GPR Model
| ΛGPR,i | Prior Function | Prior Parameters | Domain |
|---|---|---|---|
| ηi | Normal | (μN, σN) = (0, 1) a | (−∞ , +∞) |
| ΔμX | Normal | (μN, σN) = (0, 10) | (−∞ , +∞) |
| σX | Log-normal |

| (0, +∞) b |
| l | Log-normal |

| (0, +∞) |
Notes.
a μN and σN are the mean and standard deviation of the normal distribution, respectively. b and
and  are the mean and standard deviation of the log-normal distribution, respectively.
Download table as: ASCIITypeset image
Table 2. Hyperpriors for the Phenomenological Models
| ΛPM,i | Prior Function | Prior Parameters | Domain |
|---|---|---|---|
| aIII | Log-normal |

| (0, 2] |
| bIII | Log-normal |

| (0, 2] |
| zIII | Normal |

| [8, 20] |
| βPBH | Uniform | ⋯ | [0, 1.0] |
| RT | Half Cauchy | γC = Nobs a | [0, +∞ ] |
Note.
a γC is the scale parameter of the Cauchy distribution.Download table as: ASCIITypeset image
Footnotes
- 7
While the model of Equation (6) with these values is a good fit to the simulated rate in Belczynski et al. (2017) around the peak (8 ≲ z ≲ 15), we found that it may overestimate both lower and higher redshift tails by a factor of a few. This introduces a higher noise floor for mapping the redshift "tail" of PBH mergers at z ≳ 30 and hence leads to a more conservative estimate of the upper limit in fPBH.
- 8
This result is obtained from our four months' worth of simulations by scaling the uncertainties as
 .
.
