


Abstract
We present the results of a series of laboratory low-speed impacts (< 4 m s−1) of centimeter-sized spherical projectiles into simulated dry and icy regolith samples. The target material was comprised of JSC-1 (Johnson Space Center) lunar simulant grains in the size range 100–250 μm, mixed with similar-sized water ice grains. Impacts were performed under vacuum, either at room temperature for JSC-1 samples or at cryogenic temperatures (<150 K) for icy mixtures. We measured the ejecta masses from a collection plate and impact crater dimensions from post-impact crater photographs. We find that both the ejecta masses and crater diameters followed trends predicted by established scaling laws, albeit with different fitting parameters, and we were able to fit a strength regime π scaling to our measured crater diameters. The water ice in our target material took two forms: grains mixed with the regolith grains and frost from air condensation coating regolith grains. In both cases, the presence of water ice in the sample led to lower ejected masses and smaller crater sizes. In addition, our measured crater sizes were several orders of magnitude larger than expected for impacts into solid rock or water ice. Using our measured scaling parameters, we applied our findings to a planetary context for the study of secondary craters on icy moons, as well as eroding collisions occurring in Saturn's rings. We found that the deviation of our measurements from solid targets and from commonly used scaling parameters allowed us to reconcile our measurements with the models in both cases.
Export citation and abstract BibTeX RIS
1. Introduction
Understanding the mechanics of impacts into granular material is essential to the study of many phenomena in planetary sciences, ranging from the cratering of regolith-covered surfaces to the dust population evolution in environments such as planetary rings or protoplanetary disks. For this reason, it has been studied extensively, both experimentally (Schmidt 1980; Schmidt & Housen 1987; Cintala et al. 1999; Uehara et al. 2003; Walsh et al. 2003; Dowling & Dowling 2013; Suárez-Cortés et al. 2021) and numerically (e.g., Tsimring & Volfson 2005; Wada et al. 2006). The scaling relationships developed in these works show that many important aspects of large-scale crater formation can be meaningfully studied by laboratory experiments on granular media. In particular, high-speed impacts (> 1 km s−1) have led to the application of π scaling laws (Buckingham 1914) to impacts into granular targets (e.g., Housen & Holsapple 2003). Scaling has also been proposed for low-speed impacts (down to a few meters per second), although a reconciliation with high-speed impacts has not been entirely successful so far (Yamamoto et al. 2005; Housen & Holsapple 2011).
Given the ubiquitous presence of water ice in the solar system, several experimental studies have investigated how water ice influences cratering behavior (Croft 1981; Shrine et al. 2002; Grey & Burchell 2003). These studies have been of particular interest to investigations of Saturn's ring particles (e.g., Kato et al. 1995), while impacts into solid ice and solid ice–silica mixtures (Lange & Ahrens 1987; Koschny & Grün 2001a, 2001b) were used to study the surfaces of icy moons in the outer solar system. Impacts into granular ice–silica mixtures have also been investigated: Arakawa et al. (2002) impacted snow and sintered snow between 100 and 370 m s−1 to study the impacts into small icy bodies and cometary nuclei (Leliwa-Kopystyński 2002). Koschny et al. (2001) performed impacts into granular ice targets at higher speeds around 1–4 km s−1. They found that the ejected masses display the same dependency on impact parameters as the solid targets, with the difference that crater volumes are much larger because of the porosity of the granular targets.
In the present work, we investigate the low-speed regime (< 4 m s−1) of impacts into icy granular targets. Our purpose is to understand if the scaling laws determined for cratering processes in high-speed regimes are still valid for impacts that will generate subsonic waves in such targets (the speed of sound in snow was found to depend on the density, with a minimum at 200 m s−1; Lee & Rogers 1985). In particular, we are interested in understanding the crater sizes for secondary impacts on small icy bodies. Secondary craters have been shown to be a key component of crater populations on various surfaces, ranging from the Moon (Dundas & McEwen 2007) to Mars (McEwen et al. 2005) to icy moons such as Europa and Ganymede (Bierhaus et al. 2005; Zahnle et al. 2008; Singer et al. 2013). The study of such craters is not only important for accurately dating these surfaces (Bierhaus et al. 2018), but also for determining the ejecta size distributions from primary impacts (Singer et al. 2013, 2020), thus verifying the validity of the cratering models (Melosh 1984) and scaling laws (Housen & Holsapple 2011) at planetary scales.
In addition, impacts in the meters per second speed range in icy regoliths are occurring in Saturn's ring system, with smaller particles impacting larger aggregates at very low speeds (Borderies et al. 1984; Longaretti 1989). Particle erosion mechanisms due to micrometeoroid impacts on the rings have been shown to play an important role in ring dynamics (Durisen et al. 1992), and could be determined by extrapolation from low-speed impacts, if the scaling laws span over several orders of magnitude in impact speed.
In order to study cratering and mass ejection in the low-speed regime on icy granular material, we have performed a series of projectile drops into cooled targets composed of mixtures of lunar simulant JSC-1 (Johnson Space Center) grains (McKay et al. 1994; Willman et al. 1995) and water ice grains. The impact speeds ranged from 3 to 4 m s−1, using spherical projectiles 2 cm in diameter composed of Teflon, glass, and brass. The first set of drops was performed into a room-temperature, dry JSC-1 target. It was followed by a set of drops into cryogenically cooled (LN2) JSC-1 targets, which developed a frost layer at their surface. Finally, we mixed JSC-1 with water ice grains in various volumetric fractions.
In Section 2, we describe the experiment setup and the materials studied, and we present our measurements and results in Section 3. We discuss these results in Section 4, and present our conclusions in Section 5.
2. Experiment Method
In this section, we describe the hardware setup of the Impacts into Cryogenic regolith Experiment (ICE), as well as the measurements performed. We also present the projectile and target materials used in our investigation.
2.1. Hardware Setup
The ICE setup consists of a drop mechanism placed above a target sample cup (Figure 1). The drop mechanism consists of an electromagnet able to hold 2 cm sized spherical projectiles, on which a metal pin has been affixed for capture by the magnet. This magnet is installed at an adjustable height above the target sample. During the experiment's preparation, the magnet is powered and the projectile is installed (as seen in the left panel of Figure 1). When the target is ready, the magnet is switched off, releasing the projectile, which is accelerated due to gravity and impacts the target at a final speed dependent on the drop height.

Figure 1. The setup of the ICE. Left: overall view of the vacuum chamber (1) and drop mechanism (2). Top and center right: view of the target area, with the empty sample cup (copper) and the ejecta collection plate (3). The arrows point to three (of eight) etched concentric circles used for mass measurements. Bottom right: detailed view of the empty sample cup (4) in its cooling copper block (5). The sample temperature is measured using two thermocouples, one close to the surface of the filled cup and one at half height.
Download figure:
Standard image High-resolution imageThe sample was contained in a copper cup of 78.85 mm inner diameter and 48.75 mm height (237.9 cm3 sample volume). This cup was fitted into a copper block that was cooled via liquid nitrogen flowing through tubing wound around it. The temperature of the cup and the sample were measured using thermocouples, two of which were placed inside the sample, one close to the surface and one at the mid-height of the cup (Figure 1). During an experiment run, the copper block was cooled to 77 K using liquid nitrogen, which led to typical sample temperatures between 130 and 140 K.
In order to collect the material ejected from the sample upon impact, a 350 mm diameter aluminum collection plate was placed around the cup, flush with the sample surface. This plate was supported by the copper block holding the cup and was therefore also cooled. Concentric rings were etched on the plate to mark distances of 50, 60, 70, 80, 100, 125, and 150 mm from the center of the sample cup.
The drop mechanism, the target cup, and the plate were kept inside a vacuum chamber. This chamber was evacuated to 10 mTorr during an experiment run, thus eliminating air drag on projectile and ejecta particles, as well as air moisture interfering with the cooled sample. In order to record the ejecta curtain, a high-speed camera was placed level with the sample surface and collection plate, outside the vacuum chamber, in front of a window flange. The sample was illuminated using a thin laser beam in a plane at 90° to the line of sight of the camera. The laser thus illuminated the ejecta plume only in that plane, which allowed for the recording of the two-dimensional evolution of the plume particles.
2.2. Measurements
With the ICE setup described above, we collected the following types of data:
- 1.Environmental data, such as system temperature and chamber pressure. This data was mostly used to determine the constraints for experiment runs. For example, impacts were only performed for a core sample temperature <150 K and pressures <200 mTorr.
- 2.Video recordings of the ejecta plume illuminated in the plane perpendicular to the camera's line of sight (see Figure 2). These videos were recorded at a frame rate of 400 fps, with a resolution of 1080p.
- 3.Ejected target material masses collected on the ringed plate. After each impact, the chamber was carefully vented using a valve placed under the collection plate, so as not to disturb the sample material. Upon opening the chamber, the plate was retrieved and the ejecta from each of its rings were collected and weighed.
- 4.Pictures of the crater were taken after each impact (see Figure 2). As the size of the cup and the geometry of the picture angle were known, these pictures were used to measure crater sizes and depths.
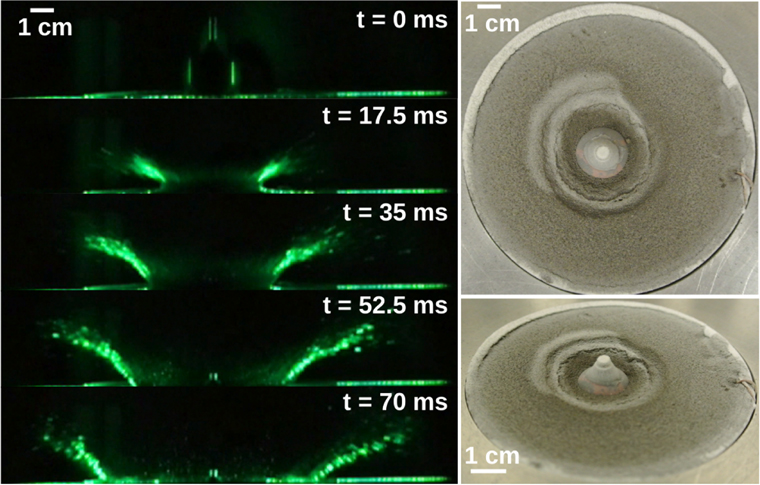
Figure 2. The ICE data collected. Left: time-lapse images of an impact of the glass projectile into frosted regolith (5.6.15.0 in Table 3). The evolution of the ejecta plume in two dimensions can be followed thanks to the laser sheet illumination. Right: crater pictures of the same impact after venting and opening the vacuum chamber.
Download figure:
Standard image High-resolution image2.3. Projectiles and Target Material
Three types of projectiles were used: metal, glass, and Teflon. All projectiles were 2 cm spheres. Their masses were measured to include the 0.46 g metal pin, and were divided by the volume of the sphere to determine their density. The projectile densities are listed in Table 3, and ranged from 7.67 to 9.46 g cm−3 for metal, from 2.52 to 2.77 g cm−3 for glass, and 1.45 g cm−3 for Teflon.
Three types of target material were prepared: dry regolith at room temperature, frosted regolith at cryogenic temperatures, and regolith–water ice mixtures at cryogenic temperatures.
The regolith component of the target material was comprised of JSC-1 lunar simulant granular material. The JSC-1 grains were sieved to a size distribution between 100 and 250 μm. Scanning Electron Microscope pictures of these JSC-1 grains were presented in Brisset et al. (2018).
Frosted regolith was prepared by cooling the JSC-1 samples above to temperatures below 150 K in air. This led to the formation of a frost layer at the surface of the grains. A detailed density analysis showed that this frosting constituted about a 5% volumetric ice content in the target samples. Therefore, we listed these frosted samples with a 5% volumetric ice content in Table 3.
Water ice grains were prepared by spraying liquid water onto the cold metal surface of a mortar (<150 K using liquid nitrogen) and crushing it into fine grains using a cooled pestle. In order to determine the grain size distribution, we prepared several ice samples and placed the grains on thin cooled metal plates, which we observed under a microscope. We recorded about 30 pictures of such samples and ran automated image analysis to determine the grain sizes. Figure 3 shows the resulting size distribution, which follows a power law except for an additional population of millimeter-sized grains. These water ice grains were then mixed with the cooled JSC-1 sample at volumetric proportions of 33%, 50%, and 75%. During the sample preparation, chamber evacuation, and impact, the frosted and ice mixture samples were continuously cooled using an LN2 cooling loop around the target cup.

Figure 3. Size distribution of the water ice grains prepared for the ICE impacts. The inset shows a microscope picture of a 75% dust–ice mixture used as target material.
Download figure:
Standard image High-resolution imageThe targets were prepared by pouring the material into the sample cup, while avoiding any types of vibrations. The cup was overfilled and delicately leveled off using a thin metal ruler. For cold targets (frosted and water ice mixtures), this process was performed under cryogenic conditions. The cup was then weighed and placed in the impact setup, while continuing to avoid vibration as much as possible. If the target material was still level with the top of the cup once it was in the impact setup, the procedure was considered successful. If not, it was repeated until it was successful. Figure 4 shows the recorded porosities for the various target types that we studied.
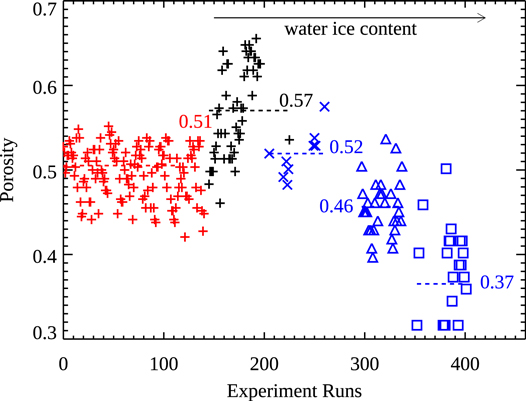
Figure 4. Measured porosities of the target samples for room-temperature impacts (red), cold targets without ice (black), and targets with water ice grains (blue). The latter are divided into samples with 33% (crosses), 50% (triangles), and 75% (squares) water ice by volume. The average porosity values are indicated for each target type.
Download figure:
Standard image High-resolution image2.4. Experiment Plan
The parameters that varied in our experiment plan were the impact energy (the drop height of the projectile), projectile density, and target material. In the first step, a set of impacts were performed at room temperature into pure JSC-1 targets. In the second step, the JSC-1 grains were cooled to <150 K, but no ice was added. Finally, the JSC-1 grains were cooled and mixed with water ice grains at 33%, 50%, and 75% volumetric ice content. For all the target materials, a minimum of three impacts per projectile per impact energy were performed. Table 3 in Appendix lists the experiments performed, with several parameter sets having many more drops, as they were used for hardware setup and testing but occurred at relevant conditions.
3. Results
In the following, we have limited our analysis to the ejecta masses and crater sizes. Due to the impossibility of recognizing individual grains in ejecta plumes, it was difficult to extract their launch positions and speeds from our video data. Given our goal of comparing our data to established scaling laws, we therefore decided to forgo the tracking of individual ejecta grains, and to focus on ejecta masses and crater sizes.
3.1. Ejecta Masses
In Figure 5, we show the total ejecta masses retrieved from the collection plate after impacts in dependence on the impact energy (left) and the water ice content (right). As intuitively expected, we observe a general trend of the ejected mass increasing with increasing impact energy. The trend with varying water ice content is not as obvious, with the 50% samples producing the largest amounts of ejecta among the cooled samples.
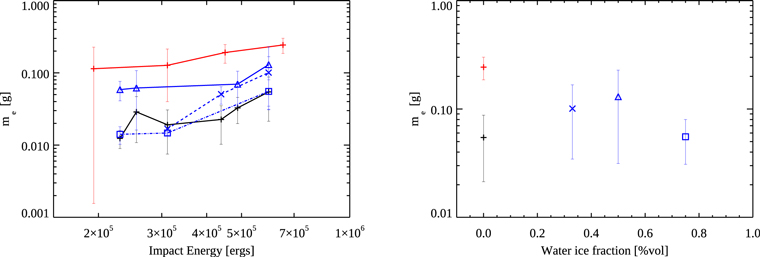
Figure 5. Total ejecta masses measured on the collection plate for various impact energies and volumetric water ice content. Left: the red plus signs show impacts into dry regolith at room temperature, the black plus signs show impacts into frosted regolith without additional water ice, and the blue symbols show impacts into regolith–ice mixtures. The mixtures contain water ice in volumetric proportions of 33% (crosses; dashed line), 50% (triangles; solid line), and 75% (squares; dashed–dotted line). We do not show collected masses for impacts with energies larger than 106 ergs, as these resulted in significant ejecta landing beyond the collection plate. Right: the total ejecta masses for impacts between 6 and 7 × 10⁵ ergs with varying volumetric water ice content of the target.
Download figure:
Standard image High-resolution imageThe room-temperature samples produced the largest amounts of ejecta overall, while the frosted samples without water ice produced the least. We observed up to one order of magnitude less ejecta when the target samples were cooled to cryogenic temperatures. Introducing water ice grains into the samples increased the ejecta masses until 50% volume, then decreased them beyond that.
In order to compare our results to well-established impact scaling laws, we used the concentric rings on our collection plate to measure the cumulative ejecta masses with ejection speed (Figure 6). As seen in the point-source scaling laws presented by Housen & Holsapple (2011), the cumulative ejecta masses of our low-speed impacts present a power-law regime, which breaks down for large ejection velocities (>1 m s−1). While the point-source assumption used in Housen & Holsapple (2011) is usually only appropriate when ejecta are studied at ranges greater than the impactor radius, and for impact velocities greater than the target sound speed, the authors note that there are cases where its applicability is found to extend beyond those limits. Here, we observe that, despite the large impactor size compared to the target sample and the low impact speeds (≈3 m s−1), the impact ejecta still follow a power-law regime with the ejection speed. A notable difference with the point-source cases involves the numerical values of the slope coefficient calculated: in the works by Holsapple (1993) and Housen & Holsapple (2011), the coefficient μ is known to vary between 1/3 and 2/3, with μ = 0.41 for dry soils. In our low-speed impact experiments, we find μ = 0.8 for frosted and ice mixture samples, and μ = 1.6 for dry samples.

Figure 6. Average normalized cumulative ejecta mass M(>v)/m as a function of launch speed ve for the four types of targets investigated: dry regolith at room temperature (the red plus signs; μ = 1.6); frosted cryogenic regolith (the black plus signs; μ = 0.8); frosted regolith–ice mixtures (the blue triangles; μ = 0.8); and dry cryogenic regolith (the black diamonds; μ = 1.6). We only show drops with a glass projectile. The respective dashed lines show the power-law fits for each target type. The corresponding μ coefficients are calculated following the Housen & Holsapple (2011) scaling law.
Download figure:
Standard image High-resolution image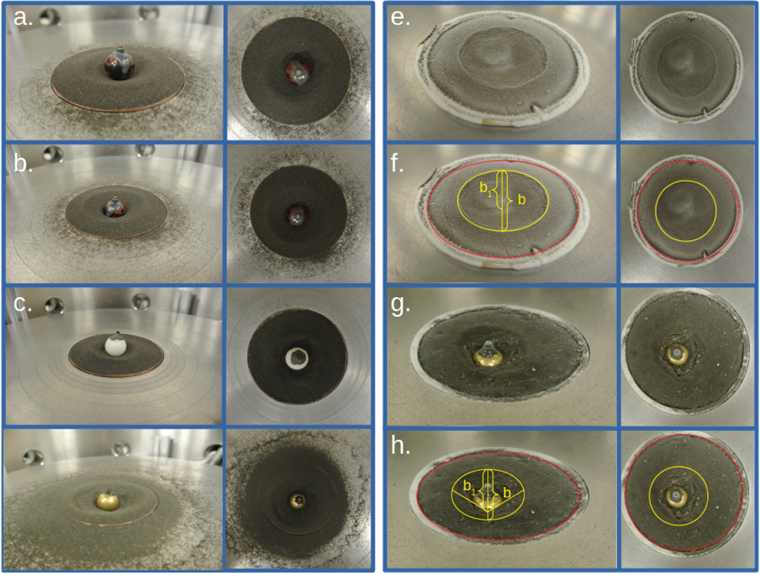
Figure 7. Examples of the craters produced during our investigation. (a) Impact 10.18.16.3; glass projectile dropped from a height of 45 cm into dry regolith. In these kinds of impacts, the projectile did not embed itself into the target. For the crater depth measurements, it was removed from the crater (see panel (e)). (b) Impact 10.18.16.0; glass from 50 cm into dry regolith. Here, the projectile partially embedded itself into the target. We left it in place to measure the crater characteristics, so as to modify the crater as little as possible after impact. (c) Impact 10.18.16.1; Teflon from 50 cm into dry regolith. (d) Impact 10.18.16.2; brass from 50 cm into dry regolith. (e) Impact 3.24.15.0; brass from 45 cm into frosted regolith (5% volume water ice). The projectile was removed after impact. (f) The same impact as (e), with the crater rim marked in yellow and the measured lengths b and b1 used for the crater depth measurements. The sample cup is measured in red and used in each picture to determine the pixel size. The top pictures were used for the crater size measurements, and the side pictures were used for the crater depth measurements. (g) Impact 6.16.16.0; brass from 45 cm into 50% volume water ice mixture. The projectile is partially buried in the target. (h) The same impact as panel (g), with crater size and depth measurement markings. For the crater depth measurements when the projectile was partially embedded, the slopes of the crater were extended to intersect. The point of intersection was chosen as the crater depth.
Download figure:
Standard image High-resolution imageIn Figure 6, we also observe that the room-temperature samples strongly differ from their cryogenic counterparts, when no water ice is added. The ejecta masses are up to an order of magnitude less for cryogenic samples, and the slope of the power-law fit is halved compared to the room-temperature samples.
While investigating this change in sample behavior upon cooling, we considered the fact that we are cooling the granular material in air, which leads to the deposition of a layer of frost at the surface of the grains, due to the condensation of air humidity. This frost can change the surface properties of the grains and impact the strength of the material (Hatzes et al. 1991). In order to verify whether this could be the cause of the discrepancy between the room-temperature and cryogenic sample behaviors, we prepared "dry" cryogenic samples in N2 vapor, rather than air. In Figure 6, we show the measured ejecta masses for these additional samples as black diamonds. The ejecta masses were very close to the room-temperature ones, both in quantity and cumulative power-law slope. Therefore, we concluded that grain surface frosting, since it generated higher interparticle cohesion, introduced sample behavior changes, with the frosted targets producing much less ejecta than the dry ones, as well as a reduced-speed cumulative mass power-law slope.
This new insight also allowed for a tentative interpretation of the ejecta mass variation with sample water ice content, as seen to the right of Figure 5. As all the samples containing water ice were prepared in air, it is to be expected that their grains should be frosted. If grain frosting and adding ice grains both reduce the impact ejecta mass, then the curve observed to the right of Figure 5 can result from the competition between these two processes. As the effect of surface frosting is expected to be dependent on the total surface available for frost deposition, it should be more pronounced for regolith grains, which are more irregular in shape than the ice grains (see the inset in Figure 3). Therefore, for the samples with low–water ice fractions, the frost coating of the grains could be the dominant mechanism reducing the ejecta masses. As the fraction of regolith grains is reduced, the available deposition surface decreases and the ejecta masses increase. For more than 50% volume ice content, surface frosting should not be dominant any more, and the influence of the presence of ice grains should prevail: the ejecta masses would then decrease with increasing ice fractions.
On the other hand, the low ejecta masses seen for 75% ice mixtures could also be linked to the presence of a population of larger grains in the water ice fraction of the samples.
3.2. Crater Radius
In Figure 7, we show crater examples from impacts of our investigation. In Figure 8, we show the crater diameters measured for the impacts into dry (red), frosted (black), and ice mixture (blue) samples. As expected, we see the crater diameter increase with impact energy. Given that the main change in impact energy resulted from different projectile masses, rather than from different drop heights, we also show the averages for the impacts performed with the same projectile (Teflon, glass, and brass).
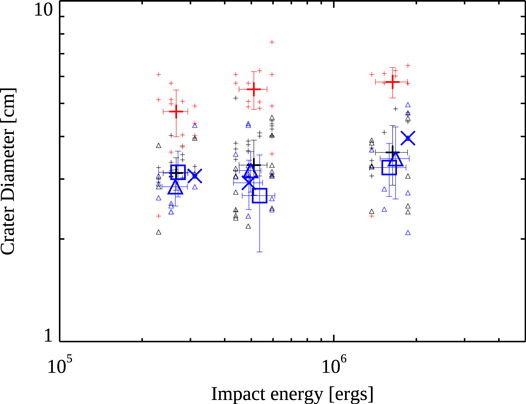
Figure 8. The crater sizes measured for the impacts into dry room-temperature regolith (the red plus signs), frosted regolith (the black plus signs), and water ice mixtures (blue, crosses for 33%, triangles for 50%, and squares for 75% volume ice content). The large symbols show the averages for each type of projectile (Teflon, ρ ∼ 1.5 g/cm3; glass, ρ ∼ 3 g/cm3; and brass, ρ ∼ 9 g/cm3).
Download figure:
Standard image High-resolution imageWe note that the crater diameters are very similar for the frosted and water mixture samples, but significantly larger for the dry samples. If we compare these crater size data to the ejecta mass data (Figure 6), we see that more ejecta (ice grains versus ice frost) does not correspond to larger craters, for the frosted and ice mixture samples. Given that the crater depths did not vary significantly between the frosted and ice mixture samples (Table 2), this could indicate that frosted regolith gets displaced upon impact, rather than ejected, in comparison to the ice mixtures.
Next, we compare our impact data to the crater scaling laws presented in Housen & Holsapple (2011). In the first step, we need to estimate whether our impacts occur in the strength or gravity regimes.
3.2.1. Impact Regime
The distinction between the strength and gravity regimes is dictated by the target material strength Y, its density ρ, the ambient gravity acceleration g, and the projectile radius a. Impacts for which Y > ρ ga are expected to occur in the strength regime. Which material strength value to consider in this relationship is still a matter of discussion (Holsapple 2007; Housen & Holsapple 2011). Options include the compression, tensile, or shear strength (Housen & Holsapple 2011), or an effective strength calculated from the material's cohesion (Prieur et al. 2017). Here, we evaluate these options using strength values measured on the same or very similar samples as the ones that we used as target material.
In Brisset et al. (2022), we measured compressive, tensile, and shear strengths for dry, frosted, and ice mixture samples comprised of an asteroid soil simulant similar to JSC-1 (Metzger et al. 2019). Samples of this asteroid simulant (AS) were prepared in the same manner as our target material (grain sizes and frosting, and the inclusion of water ice grains). For the strength measurements, the samples were poured in a similar way as for the impact sample preparation, displaying porosities toward the lower end of the spectrum for dry samples (0.4) and the higher end for frosted and ice mixture samples (0.7 and 0.4, respectively).
The compressive strength was measured with a confined compression setup. In this setup, we lower a circular plate connected to a force gauge onto a sample. The sample material was contained in a cylinder with an inner diameter only slightly larger than the circular plate. During the measurement, we recorded the stress and strain on the sample from first contact to yield. Due to the granular nature of the sample, the material response was nonlinear (Omidvar et al. 2012). For such materials, several Young Moduli (YM) can be defined. We used an exponential fit to calculate the YM at 1 MPa of normal stress.
The shear strength of the samples was measured using a shear cell. In this setup, a rectangular container was filled with sample material and sheared in its middle, while a normal force was applied to the top of the sample. The shear yield measurements allowed us to calculate the sample's internal cohesion and tensile strength.
In order to validate the use of these AS strength values for estimating the strength of our JSC-1 samples, we also replicated the compressive measurements on the dry, frosted, and ice mixture samples for JSC-1. The results of our measurements are shown in Table 1.
Table 1. Strength Values Measured on AS Material and JSC: Compressive and Shear Strengths at 1 MPa of Normal Stress (E and G, Respectively), Tensile Strength (Ts ), Cohesion (C; Brisset et al. 2022), and Effective Strength (YEFF = 21*C; Prieur et al. 2017).
| Sample Type | E (Pa) AS | E (Pa) JSC | G (Pa) | Ts (Pa) | C (Pa) | YEFF (Pa) |
|---|---|---|---|---|---|---|
| Dry | 1.40E+06 | 0.90E+06 | 0.46E+06 | 852 | 384 | 8064 |
| Frosted | 1.90E+06 | 1.02E+06 | 0.50E+06 | 859 | 437 | 9177 |
| 50% volume Ice Mixture | 8.10E+06 | 4.06E+06 | 0.29E+06 | 885 | 264 | 5544 |
Download table as: ASCIITypeset image
We find compressive and shear strengths on the order of the MPa. The tensile strength is on the order of the kPa, and the effective strength based on cohesion is on the order of several kPa. For the grain sample properties of our targets, we have ρ ga at about 200 Pa. This means that, for any of the strengths considered (compressive, shear, tensile, or effective), the ratio Y/ρ ga is always >1, with the lowest values at about 4, if the tensile strength is used as the value for strength. We note that Housen & Holsapple (2011) recommend the use of either the compressive or shear strength for cohesionless granular soils, while Prieur et al. (2017) define an effective strength for cohesive granular material. If we consider these other strength values, we get Y/ρ ga >> 1.
In any case, this analysis supports the assumption of the impacts occurring in the strength regime, which we apply to the rest of our analysis.
3.2.2. Crater Size Scaling
In the strength regime, Housen & Holsapple (2011) give the following scaling equation for the crater radius R:

with m, δ, and U being the projectile mass, density, and speed, and H2, ν, and μ being scaling parameters. By investigating the dependence in our data set of this scaled radius on each of the factors to the right of Equation (1), we find that H2 = 4.34, ν = 0.23, and μ = 0.5 (Figure 9).
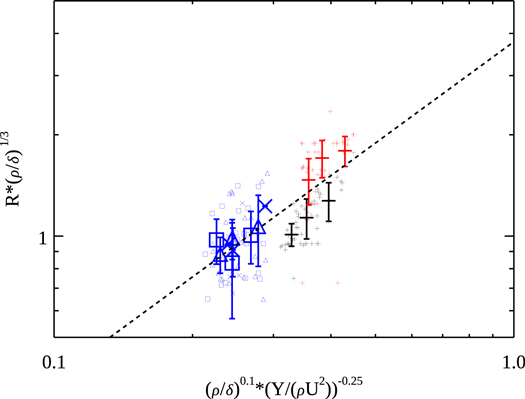
Figure 9. Scaled crater radii in the strength regime. The data point colors correspond to the sample types: dry (red), frosted (black), and ice mixtures (blue, crosses for 33%, triangles for 50%, and squares for 75% volume ice content). For each target type, the three large data points correspond to various impact energies averaged over individual projectiles (as in Figure 8). Associated error bars are shown. The dashed line corresponds to the linear fit ![$R{\left(\displaystyle \frac{\rho }{m}\right)}^{\tfrac{1}{3}}=4.34{\left(\displaystyle \frac{\rho }{\delta }\right)}^{0.1}{\left[\tfrac{Y}{\rho {U}^{2}}\right]}^{-0.25}$](https://content.cld.iop.org/journals/2632-3338/3/7/176/revision1/psjac779aieqn1.gif) .
.
Download figure:
Standard image High-resolution imageWe note that the numerical values for the scaling parameters H2, ν, and μ are different than reported for dry soils and porous materials (μ ≈ 0.4 and ν ≈ 0.4; Housen & Holsapple 2011). This comes as no surprise, as we are studying impacts that cannot be considered within the point-source approximation. We also note that the parameter μ deduced from the crater analysis is different from the one that we deduced from the ejecta mass analysis (Section 3.1). A possible explanation for this discrepancy is the fact that, in our crater size analysis, we considered a constant parameter μ for the three types of target material in our investigation, thus neglecting the dependency of μ with the target material strength. However, the ejecta mass analysis suggests otherwise, with at least two different values for μ for dry and ice mixture samples.
3.3. Crater Depth
As shown in Figure 7, the crater depth was taken as either the deepest point of the crater or, if the projectile partially embedded itself into the target, as the intersection of the crater slopes. Geometric analysis shows that the crater depth h can be written as h = b1 − b/2, with b1 and b being the lengths defined in Figure 7. This equation still applies if b1 > b.
Table 2 lists the crater depth-to-diameter (d/D) ratios that we measured for the impacts into dry, frosted, and ice mixture samples and projectile types (corresponding to the impact energy levels). We did not observe a significant dependency of d/D with either impact energy (i.e., projectile) or target type. The values of ∼0.1 that we find are consistent with the ones measured for secondary craters across the solar system (Bierhaus et al. 2018).
Table 2. Crater d/D Ratios for Impacts into Dry Room-temperature Regolith and Ice Mixtures
| Projectile | Dry | Frosted | Ice Mixture |
|---|---|---|---|
| Teflon | 0.12 ± 0.03 | 0.15 ± 0.06 | 0.12 ± 0.03 |
| Glass | 0.12 ± 0.02 | 0.13 ± 0.05 | 0.15 ± 0.05 |
| Brass | 0.13 ± 0.03 | 0.13 ± 0.03 | 0.13 ± 0.03 |
Download table as: ASCIITypeset image
4. Discussion
Our measurements indicate that despite the obvious differences between our experiment conditions and point-source impacts, both the ejecta masses and crater sizes produced follow power-law profiles, as expected by the scaling laws outlined in Housen & Holsapple (2011). However, these scaling laws are not entirely followed, as the power-law coefficients do not transfer well between scaling for ejecta and scaling for crater sizes. The power-law coefficients for ejecta masses are much larger than expected in point-source impacts (μ < 0.67 in Housen & Holsapple 2011, but 0.8 and 1.6 in our measurements). This indicates that the ejecta blankets around low-speed impacts into dry or icy regolith have a thickness that decays much more rapidly than for point-source impacts into hard rock, more so for dry regolith than for icy regolith. This means that the gardening effect of secondary impacts on small bodies (which can have escape speeds of a few meters per second) is spatially restricted, and can only provide for very limited material relocation.
4.1. Crater Sizes
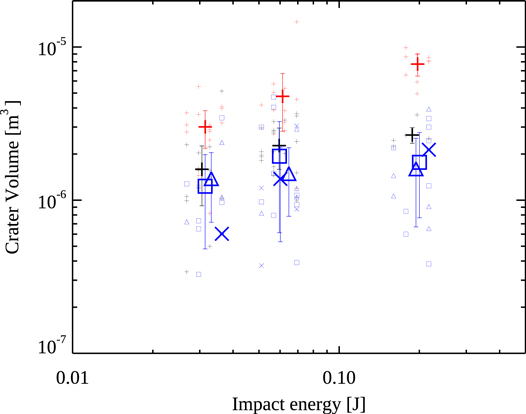
The scaling of the crater sizes that we measure in our impacts is somewhat in line with results of other experiments used to validate the scaling laws of Housen & Holsapple (2011). The power-law coefficient that we find between the scaled crater size and the Π3 = Y/ρ U2 parameter in the strength regime is within the range of commonly used numbers (0.41 for dry soils and 0.55 for nonporous materials). However, the constant fitting parameter H2 that we find is much higher than is found in Housen & Holsapple (2011). So, while our crater sizes scale with material strength in the same way as point-source impacts in hard rock, they are offset and much larger than predicted. Indeed, if we estimate our crater volumes based on a conical crater shape and our measurements for crater diameter and depth, we find values between 10−6 and 10−5 m3 (Figure 10). If we compare these values to data extrapolated from impacts into basalt targets (Moore et al. 1963; Gault 1973, for impact energies between 10 and 1000 J or 108 to 1010 ergs), we find that the craters that we generate in JSC-1 granular targets are about five orders of magnitude larger. Similarly, we compare our data to measurements performed on impacts into solid water ice (Lange & Ahrens 1987, also for impact energies around 1000 J or 1010 ergs). Again, the craters generated in our ice–regolith mixture targets are about five orders of magnitude larger than expected from extrapolating these solid ice data.
Figure 10. Crater volume estimated assuming a conical crater shape for our low-energy impacts. The colors and symbols follow the same pattern as in previous figures, with red showing room-temperature regolith samples, black showing frosted regolith samples, and blue showing water ice mixtures. The large symbols show the average for each target type and energy level with the associated error bar.
Download figure:
Standard image High-resolution image
We suggest that these differences are due to the granular nature of the target material (both Moore et al. 1963 and Lange & Ahrens 1987 use solid target blocks). Indeed, experiments by Burchell et al. (2001) were performed in the same impact energy range as ours (around 0.01 J or 105 ergs, albeit with much smaller projectiles and larger impact speeds) using pure water ice blocks. They find crater sizes that are smaller than ours by more than three orders of magnitude, indicating that the impact energy differences between the experiment types are not the cause of the differences in crater sizes. Koschny & Grün (2001a) also investigate silica–ice mixtures prepared as solid blocks in this same impact energy range, and find crater sizes that are smaller than ours by about four orders of magnitude. Therefore, mixed composition with minerals and water ice is also not responsible for the crater size differences.
Uehara et al. (2003) and Walsh et al. (2003) performed low-speed impact experiments into spherical glass beads. They find crater sizes around 5 cm, which is similar to the values that we found in the ICE impacts, and supports the idea that impacts into granular media produce much larger craters than impacts into solid targets. In order to compare our results to these impacts into granular media, we calculate the scaled crater diameters and scaled impact energies, following the example of Walsh et al. (2003). We find that the crater sizes in our experiments vary normally with scaled energy, with a slope of 0.1. This is flatter than the 0.245 slope found by Walsh et al. (2003) and displays a behavior closer to the finest grain sizes they used (45–90 μm). This could be indicative of the increased intergrain cohesion present in our samples of irregular grains compared to the spherical beads studied in Walsh et al. (2003), which becomes more apparent with their finer-grained samples.
The crater d/D ratios that we find in our experiments are in line with the values found in other experiments (0.125 in Walsh et al. 2003, for example) as well as in secondary craters throughout the solar system (around 0.1 in Robbins et al. 2018). Such secondary craters result from impacts at lower speeds compared to the primary craters, as only ejecta speeds at the lower tail of the generated ejecta distribution stay captured by the gravity field of the parent body. These lower-impact speeds make it more likely for craters to form mostly in the regolith layers covering the rocky surface. Therefore, our experiment results are more relevant to secondary craters than to primary ones.
In that context, if we consider the results that we find in Section 3.2, we would expect secondary craters on regolith-covered surfaces to be larger than expected by point-source scaling laws: while the crater size evolution trends are similar with a μ coefficient within the range of values commonly used when applying these laws (Housen & Holsapple 2011), the scaling constant in the strength regime H2 is larger by about a factor of 10. Therefore, secondary craters on small bodies, where the strength regime would apply, would be expected to be about 10 times larger than predicted by using the Housen & Holsapple (2011) scaling. If we assume that this transfers to impacts in the gravity regime, we can expect secondary craters to be larger than predicted on all planetary bodies. This is actually found by Singer et al. (2013), in their study of impact fragment sizes on Europa. In their work, the fragment sizes are estimated using the diameters of secondary craters, combined with the Housen & Holsapple (2011) scaling laws and classical ballistic mechanics. For impacts in the gravity regime, this boils down to fragment diameters dfrag following

with Dsec being the diameter of the secondary crater produced by this fragment, vfrag being its impact speed, and H1 and μ the Housen & Holsapple (2011) scaling parameters for impacts in the gravity regime. All things remaining the same, a larger H1 by a factor of 10 leads to smaller fragment sizes by a factor of 0.38. This would reconcile the results of Singer et al. (2013) with the fragment sizes expected from the spallation model of Melosh (1984).
4.2. Impact Yield
One application for impacts in ice targets is the dynamics of Saturn's rings. Durisen et al. (1989, 1992) discuss in their papers the ballistic transport in planetary ring systems due to particle erosion mechanisms. One input parameter to their model is the crater yield Y, which is the ratio between the ejected mass after impact and the projectile mass before impact. In the analysis of their experiment results, Koschny & Grün (2001a) attempt to match the yields produced in their laboratory impacts to the values estimated by the model developed in Durisen et al. (1992). They find that the crater yields that they produce when impacting solid ice–silica mixture targets would require the majority of projectiles impacting ring particles to be meter-sized. This is at odds with the size distribution of interplanetary particles, which peaks between micrometer and millimeter sizes (Fechtig et al. 1974; Grün et al. 1985). Here, we apply our cratering data in granular targets to the Durisen et al. (1992) model, following the method used by Koschny & Grün (2001a). For this, we rewrite their yield equation to adapt it to our data set, which does not contain 100% water ice targets. If we use our 50% ice–regolith mixtures instead, this yield equation can be written as

with V1,50 and b being the fitting parameters of the 50% ice mixture crater volume data in Figure 10, and ρt the target density. The fitting parameters can be extracted from Figure 10 as V1,50 = 1.73 × 10⁻⁶ m3 and b = 0.15. On average, ρt = 1100 kg m−3 for 50% ice mixtures (see Table 3). For the yield and impact speeds, we choose the same values as Durisen et al. (1992) and Koschny & Grün (2001a), i.e., Y = 1.8 × 10⁶ and vi = 14,000 m s−1. With these values, we obtain an impactor mass of mi = 7.1 × 10⁻¹⁰ kg, which translates to an impactor grain diameter of 82.7 μm, assuming that it has a composition close to silica, and 111 μm, if it is composed of water ice. These particle sizes are much more plausible for interplanetary particles. The much larger yields produced by granular targets compared to solid ones seem to be able to reconcile laboratory impact data with the model developed in Durisen et al. (1992), and support the proposition of Koschny & Grün (2001a) that ring particles are covered with, or entirely composed of, regolith.
5. Summary and Conclusion
In this paper, we present the measurement results for a series of low-speed impacts into regolith and icy regolith targets. The following points summarize our findings:
- 1.Ejecta masses follow trends predicted by established impact scaling laws (Housen & Holsapple 2011), albeit with scaling parameters out of the usual range (μ = 0.8 for dry target material and μ = 1.6 for frosted regolith or ice–regolith mixtures);
- 2.Ejecta masses decrease with target grain frosting and with the inclusion of a water ice grain fraction. For a given set of impact parameters (the same projectile and impact energy), frosted samples yield about one order of magnitude less ejecta mass than dry ones, while 50% volume ice–regolith mixtures yield about three times less ejecta;
- 3.The crater diameters also follow the trends predicted by established impact scaling laws (Koschny & Grün 2001a). Here, μ = 0.5, while ν ∼ 0.2 in the strength regime;
- 4.The crater diameters decrease with the inclusion of a water ice fraction in our target material. For the same impact parameters, craters in 50% volume ice–regolith mixtures were about two times smaller than craters in dry regolith; and
- 5.The crater d/D ratios were found to be around 0.1 for all impact and target parameters, except for Teflon and glass projectiles into ice–regolith mixtures, where they were closer to 0.2.
We discussed our results in the context of secondary crater sizes on small icy bodies (particularly Europa) and micrometeorite impact yields leading to the erosion of Saturn's main rings. We found that, in both cases, the deviations of our measurements from laboratory work studying high-speed impacts or solid targets allowed us to reconcile our observations with the models. We conclude that the exploration of the behavior of granular targets composed of relevant materials is key to the extrapolation of scaling laws to planetary scales.
We acknowledge support from the National Science Foundation under grant AST1413332; the National Aeronautics and Space Administration Origins of Solar Systems program under grant NNX09AB85G; and Space Florida in support of the Center for Microgravity Research.
Appendix: Experiment Run Table
In Table 3, we list the impacts analyzed in the present paper, including some of the key measurements performed.
Table 3. List of ICE Experiments Performed
| Identifier | Ice | Target | Projectile | Impact | Total Ejecta | Crater | Crater |
|---|---|---|---|---|---|---|---|
| 10.12.11.0 | 0 | 1.52 | 2.52 | 3.10E+05 | 1.38 | ||
| 10.12.11.0 | 0 | 1.5 | 2.52 | 3.10E+05 | 1.51 | ||
| 10.12.11.0 | 0 | 1.48 | 2.52 | 3.10E+05 | 1.5 | ||
| 10.17.11.0 | 0 | 1.57 | 2.52 | 3.10E+05 | 1.76 | ||
| 10.17.11.0 | 0 | 1.52 | 2.52 | 3.10E+05 | 1.23 | ||
| 10.17.11.0 | 0 | 1.49 | 2.52 | 3.10E+05 | 1.05 | ||
| 10.17.11.0 | 0 | 1.47 | 2.52 | 3.10E+05 | 1.13 | ||
| 10.17.11.0 | 0 | 1.45 | 2.52 | 3.10E+05 | 0.51 | ||
| 10.18.11.0 | 0 | 1.53 | 2.52 | 3.10E+05 | 1.23 | ||
| 10.18.11.0 | 0 | 1.53 | 2.52 | 3.10E+05 | 1.47 | ||
| 10.19.11.0 | 0 | 1.57 | 2.52 | 3.10E+05 | 1.49 | ||
| 10.19.11.0 | 0 | 1.56 | 2.52 | 3.10E+05 | 1.44 | ||
| 2.24.15.0 | 5 | 1.45 | 8.67 | 2.17E+06 | 0.31 | 42.99 | 6.88 |
| 2.25.15.0 | 5 | 1.41 | 8.67 | 1.96E+06 | 0.63 | 40.98 | 6.88 |
| 3.5.15.0 | 5 | 1.41 | 8.67 | 2.17E+06 | 0.76 | 42.05 | 6.97 |
| 3.11.15.0 | 5 | 1.41 | 8.67 | 1.96E+06 | 0.63 | 40.09 | 4.09 |
| 3.17.15.0 | 5 | 1.41 | 2.77 | 6.25E+05 | 0.66 | 48.21 | 5.22 |
| 3.18.15.0 | 5 | 1.34 | 2.77 | 6.93E+05 | 0.47 | 46.92 | 3.65 |
| 3.24.15.0 | 5 | 1.37 | 2.77 | 6.93E+05 | 0.12 | 44.18 | 4.26 |
| 3.25.15.0 | 5 | 1.32 | 2.77 | 5.68E+05 | 0.3 | 41.12 | 5.28 |
| 3.31.15.0 | 5 | 1.22 | 8.67 | 1.78E+06 | 0.08 | 36.36 | 5.3 |
| 4.2.15.0 | 5 | 1.28 | 8.67 | 1.78E+06 | 0.41 | 36.07 | 8.86 |
| 4.8.15.0 | 5 | 1.2 | 1.45 | 3.63E+05 | 0.06 | 32.65 | 2.98 |
| 4.9.15.0 | 5 | 1.51 | 1.45 | 3.27E+05 | 0.11 | 30.27 | 1.38 |
Note. The water ice content is listed in volumetric percentage. The first part of the table lists all the room-temperature dry drops. The second part lists the cryogenic drops, with ice percentages ranging from 5% (frosted samples) to 75% (water ice mixtures). The "0-ff" ice percentages in the last part of the table denote samples that were prepared frost-free, i.e., in N2 vapor. Cells are left empty when no measurements were taken or the data did not allow for proper measurements. Table 3 is published in its entirety in machine-readable format. A portion is shown here for guidance regarding its form and content.
Only a portion of this table is shown here to demonstrate its form and content. A machine-readable version of the full table is available.
Download table as: DataTypeset image