the Creative Commons Attribution 4.0 License.
the Creative Commons Attribution 4.0 License.
 | 13 Jan 2020
Hyperspectral ultraviolet to shortwave infrared characteristics of marine-harvested, washed-ashore and virgin plastics
Shungudzemwoyo P. Garaba
Heidi M. Dierssen
Combating the imminent environmental problems associated with plastic litter requires a synergy of monitoring strategies, clean-up efforts, policymaking and interdisciplinary scientific research. Lately, remote sensing technologies have been evolving into a complementary monitoring strategy that might have future applications in the operational detection and tracking of plastic litter at repeated intervals covering wide geospatial areas. We therefore present a dataset of Lambertian-equivalent spectral reflectance measurements from the ultraviolet (UV, 350 nm) to shortwave infrared (SWIR, 2500 nm) of synthetic hydrocarbons (plastics). Spectral reflectance of wet and dry marine-harvested, washed-ashore, and virgin plastics was measured outdoors with a hyperspectral spectroradiometer. Samples were harvested from the major accumulation zones in the Atlantic and Pacific oceans, suggesting a near representation of plastic litter in global oceans. We determined a representative bulk average spectral reflectance for the dry marine-harvested microplastics dataset available at https://doi.org/10.21232/jyxq-1m66 (Garaba and Dierssen, 2019c). Similar absorption features were identified in the dry samples of washed-ashore plastics: dataset available at https://doi.org/10.21232/ex5j-0z25 (Garaba and Dierssen, 2019a). The virgin pellets samples consisted of 11 polymer types typically found in floating aquatic plastic litter: dataset available at https://doi.org/10.21232/C27H34 (Garaba and Dierssen, 2017). Magnitude and shape features of the spectral reflectance collected were also evaluated for two scenarios involving dry and wet marine-harvested microplastics: dataset available at https://doi.org/10.21232/r7gg-yv83 (Garaba and Dierssen, 2019b). Reflectance of wet marine-harvested microplastics was noted to be lower in magnitude but had similar spectral shape to that of dry marine-harvested microplastics. Diagnostic absorption features common in the marine-harvested microplastics and washed-ashore plastics were identified at ∼931, 1215, 1417 and 1732 nm. In addition, we include metrics for a subset of the marine-harvested microplastics related to particle morphology, including sphericity and roundness. These datasets are also expected to improve and expand the scientific evidence-based knowledge of optical characteristics of common plastics found in aquatic litter. Furthermore, these datasets have potential use in radiative transfer simulations exploring the effects of plastics on ocean colour remote sensing and developing algorithms applicable to remote detection of floating plastic litter.
- Article
(2465 KB) -
Supplement
(634 KB) - BibTeX
- EndNote


The amount of plastic litter in the natural environment is growing exponentially, and this challenge has led to a huge demand for integrated and sustainable monitoring strategies (Lebreton et al., 2018; Maximenko et al., 2016; G20, 2017; Werner et al., 2016). Remote sensing is a widely considered tool that can provide a complementary avenue of wide geospatial and spectral information about plastics in natural waters (Maximenko et al., 2016). Current key requirements expected from remote sensing are to detect, identify, quantify and track floating plastics. Feasibility studies centred on these four requirements have shown promising prospects in remote sensing of floating and submerged litter (Garaba et al., 2018; Aoyama, 2018; Kako et al., 2012; Topouzelis et al., 2019). Although current efforts are promising, there is a need to advance remote sensing of plastics and adapt future sensors to generate plastic-related end products. In line with this, a new generation of satellite missions (e.g. PRISMA – Italian Space Agency; EnMap – German Aerospace Centre; PACE – National Aeronautics and Space Administration) is anticipated to advance remote sensing of the environment through hyperspectral observations from the ultraviolet (UV, ∼350 nm) to shortwave infrared (SWIR, ∼2500 nm). While these future missions are not dedicated to plastic litter studies, they are likely to provide essential knowledge of high-quality, hyperspectral and wide geospatial coverage information pertinent to plastics. Going forward, many satellite missions will be supported by observations from unmanned aerial systems, aircrafts and high-altitude pseudo-satellites.
A limited number of high-quality hyperspectral measurements of plastic types found in marine litter have been reported or are in open-access repositories. We therefore conducted measurements from the UV–SWIR with the goals of contributing towards (i) creating a high-quality baseline hyperspectral reflectance dataset of weathered plastics being washed ashore or floating in the oceans, (ii) identifying absorption features of naturally weathered plastics, (iii) demonstrating the high reflectivity of plastics compared to other optically active constituents of the oceans, (iv) creating an open-access spectral reference library for improved radiative transfer simulations, and (v) proposing algorithms essential to “detect, identify, quantify, and track” plastics as unique from other floating debris. We present the detailed steps that were completed to acquire these measurements of the virgin and naturally weathered plastics found in marine and land-based litter.
2.1 Samples
We used a set of specimens consisting of macroplastics (diameter>5 mm) and microplastics (diameter<5 mm). The macroplastics were collected during clean-up activities along the western coastline of the United States of America (USA), now being used to create a public awareness campaign under the theme “Washed Ashore: Art to Save the Sea”, a travelling art exhibition in the USA. At the time of the experiment, around midday on 25 March 2015, the exhibit was at the Mystic Aquarium in Connecticut. We believe these objects (buoys, handles, bottle caps, containers, styrofoam, ropes, toys, diving fins and nets) had undergone natural weathering at sea and/or on land, based on careful visual inspection with particular interest in shapes, type of the original object and colour. The macroplastics had different colour shades including blue, green, yellow, orange, peach, beige, ivory and white (Garaba and Dierssen, 2018).
Marine-harvested microplastic samples were obtained from the western North Atlantic Ocean using a Neuston net (mesh size = 335 µm) in the top 0.25 m seawater layer (Law et al., 2010). After collection with the nets, the microplastics were left to dry followed by hand separation before storage in glass scintillation vials at Sea Education Association archives. Additional marine-harvested microplastic specimens used in this study were collected from Kamilo Point in Hawaii, USA, by Bill Robberson and Anna-Marie Cook (Environmental Protection Agency, USA). The Kamilo Point samples were not sieved as was done for the North Atlantic samples, due to the quantity that was available; we therefore classified them as aggregated microplastics. Dry virgin pellets of varying opacity were chosen to represent the polymer source types that have been identified in specimens harvested from sediments and aquatic sampling (GESAMP, 2015; Hidalgo-Ruz et al., 2012). The polymer types considered were polyvinyl chloride (PVC), polyamide or nylon (PA 6.6 and PA 6), low-density polyethylene (LDPE), polyethylene terephthalate (PET), polypropylene (PP), polystyrene (PS), fluorinated ethylene propylene teflon (FEP), terpolymer lustran 752 (ABS), Merlon, and polymethyl methacrylate (PMMA).
The variability in apparent colour and shape of the marine-harvested microplastics and washed-ashore macroplastics is a plausible representation of the plastic litter that is being found in the aquatic and terrestrial environment but may not necessarily represent all the plastic litter found globally.
2.2 Spectral reflectance measurements
Hemispherical directional reflectance measurements (Nicodemus et al., 1977) of all specimens were conducted outdoors during daylight hours ±3 h around midday using an Analytical Spectral Devices (ASD) FieldSpec® 4 hyperspectral spectroradiometer (Malvern Panalytical, USA) between 350 and 2500 nm. An 8.5∘ foreoptic was used during the spectral measurements of the dry macroplastics at a 45∘ nadir angle that was 10 cm above target object. A 99 % Spectralon® Lambertian plaque (Labsphere, USA) was used for white referencing and optimizing the integration time of the spectroradiometer. It was assumed that by using a Spectralon® Lambertian plaque for white referencing we eliminated the effects of varying setup geometry during measurements. Spectra were recorded first over the plaque, then from five different spots of each dry macroplastic object and then over the plaque. A single spectral measurement was derived as an average of 20 continuous automated scans. Microplastics were aggregated on a black neoprene rubber mat to create an optically dense target before each spectral measurement (Fig. 1). This black rubber mat was used as background target because it had a negligible spectral reflectance over the spectrum range observed. At a 0∘ nadir angle, a 1∘ foreoptic was placed 8 cm above the aggregated microplastics on the black rubber mat and reference measurements were made using a Spectralon® Lambertian plaque (Labsphere, USA). Again, here a spectrum was first collected over the plaque, followed by 10 measurements over the aggregated dry microplastics and then finally over the plaque. Before each measurement over the dry microplastics, we gently mixed the particles to rearrange the orientation and location of the particles in an effort to get the most representative bulk spectral signal. A similar approach was used to perform additional spectral measurements of wet microplastics in filtered seawater with a salinity of 30 ppt. Our selected setup was determined to be optimum and minimized instrument and user shading.
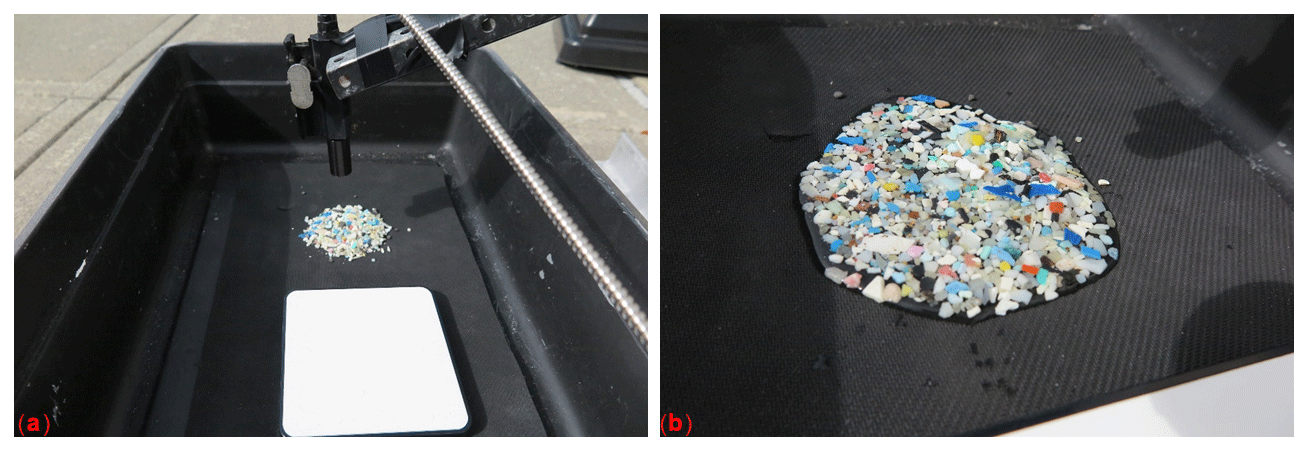
Figure 1Experimental setup with the aggregated (a) dry and (b) wet marine-harvested microplastics. Black neoprene rubber was used as a background in a dark spray-painted container to mitigate background light during spectral reflectance measurements.
2.3 Data processing
Lambertian-equivalent spectral reflectance (R) was calculated as the ratio of the measurement taken over the sample, divided by that taken over the plaque and normalized by the spectral calibration of the plaque. Natural outdoor lighting allowed us to measure spectral reflectance with good signal-to-noise ratio from the UV to SWIR, with the exception of certain SWIR regions where the atmosphere is opaque. These regions of the spectrum are shown as gaps in the continuous spectrum, from 1350 to 1410 nm and 1800 to 1950 nm in the dataset. Average spectra were calculated for each set of repeated measurements. All data processing, statistics and plots were generated in MathWorks MATLAB.
Spectral absorption features
In general, the spectral reflectance of an optically active object (e.g. plastic, corals and seawater) has a characteristic shape that explains how it can reflect or absorb light. The spectral shape is a combination of peak (reflection or fluorescence) features and trough (absorption) features that are distinctive optical properties of the objects. An absorption feature would occur at spectral wavebands where the object absorbs more light and reflects less light compared to the neighbouring wavebands. Here, a priori knowledge about typical absorption features in hydrocarbons or plastics was combined with visual inspection of measured R (Fig. 2a). Further verification of these identified absorption features was done by applying a moving-average filter with a window of 19 nm to derive a smoothed R. Second-order derivatives of the smoothed spectra were then computed to generate derivative R signals with enhanced absorption features (Fig. 2b). Using derivatives of spectra has been shown to be a robust analytical tool in remote sensing (Dierssen et al., 2015; Huguenin and Jones, 1986; Russell et al., 2016; Tsai and Philpot, 1998). Continuum removal was applied to the R, followed by calculating a relative band-depth index to enumerate the absorption intensity (Eq. 1). An end and start waveband was obtained from a MathWorks MATLAB R2016a convhull function. The function objectively locates the convex hull, i.e. wavebands immediately before (λ1) and after (λ3) the absorption feature waveband (Fig. 2c). The equation used to calculate the band depth (bd) at the central wavelength (λ2) from the reflectance at the three wavebands is as follows:
Band-depth indexes are widely used as proxies for detection and quantification of optically active objects in natural environments (Clark, 1983, 1999; Dierssen, 2019). Absorption features are thus enhanced after being normalized by the continuum removal approach (Fig. 2d). Diagnostic absorption features refer to those parts of the spectrum unique to a particular object such that they possess a similar shape and are located at a specific wavelength range (Clark et al., 2003). An inter-comparison to check for diagnostic absorption features was conducted using the macroplastic and microplastic spectra.

Figure 2(a) Example spectral reflectance used for visual inspection to identify absorption features highlighted by the vertical lines, (b) second derivative signal validating the location of absorption features, (c) continuum line generated from the convhull function and (d) continuum-removed signal.
The degree of spectral shape likeness among the measured R was calculated using a quantitative similarity scoring algorithm (Wan et al., 2002). A spectral contrast angle ranging from (0∘ being a very strong degree of similarity and 90∘ being no similarity) was determined after converting the spectra of two samples into a multi-dimensional vector that is not affected by the inherent intensity of the spectra but only depends on the shape (Eq. 2). Assuming x and y to be reflectance at a given wavelength of a sampled and reference target, the spectral contrast angle (Θ) is derived as follows:
A scale to evaluate spectral shape similarity classified the results of Eq. (2) as very strong (0∘ ∘), strong (5∘ ∘), moderate (10∘ ∘), weak (15∘ ∘) and very weak (20∘ <Θ) (Garaba and Dierssen, 2018).
2.4 Microplastic particle morphology
A Marathon electronic digital calliper was used to measure the size distribution of dry marine-harvested microplastic particles. Additional particle descriptors included sphericity, roundness and a qualitative description of colour. Particle sphericity and roundness were determined according to a qualitative scale (Powers, 1953).
3.1 Macroplastics
Spectral reflectance of the different dry washed-ashore macroplastics (Garaba and Dierssen, 2019a) had significant differences in the visible spectrum related to the intrinsic colour of each object (Fig. 3). Blue objects peaked around 450 nm, green objects around 550 nm, while white objects had a flatter reflectance in visible wavelengths. Beige and ivory coloured objects had rapidly increasing reflectance in the visible with an 8-fold reflectance magnitude rise from 400 to 700 nm. Yellow, peach and orange objects also had increasing reflectance in the visible but not as pronounced as in the beige and ivory objects, ranging from a 3- to 4-fold increase in reflectance. Overall, the highest reflectance was noted on the beige object: R=0.88 around 850 nm. For all the objects, the reflectance peaked in the near-infrared (NIR), followed by a general decrease in the SWIR with several absorption features resulting in localized dips and peaks. Despite the variations in the spectral magnitude and shape, absorption features common to all the macroplastics were located at wavebands centred close to 931, 1045, 1215, 1417, 1537, 1732, 2046 and 2313 nm (Fig. 3). The location of the absorption features was validated and confirmed by derivative analyses of each respective spectrum.
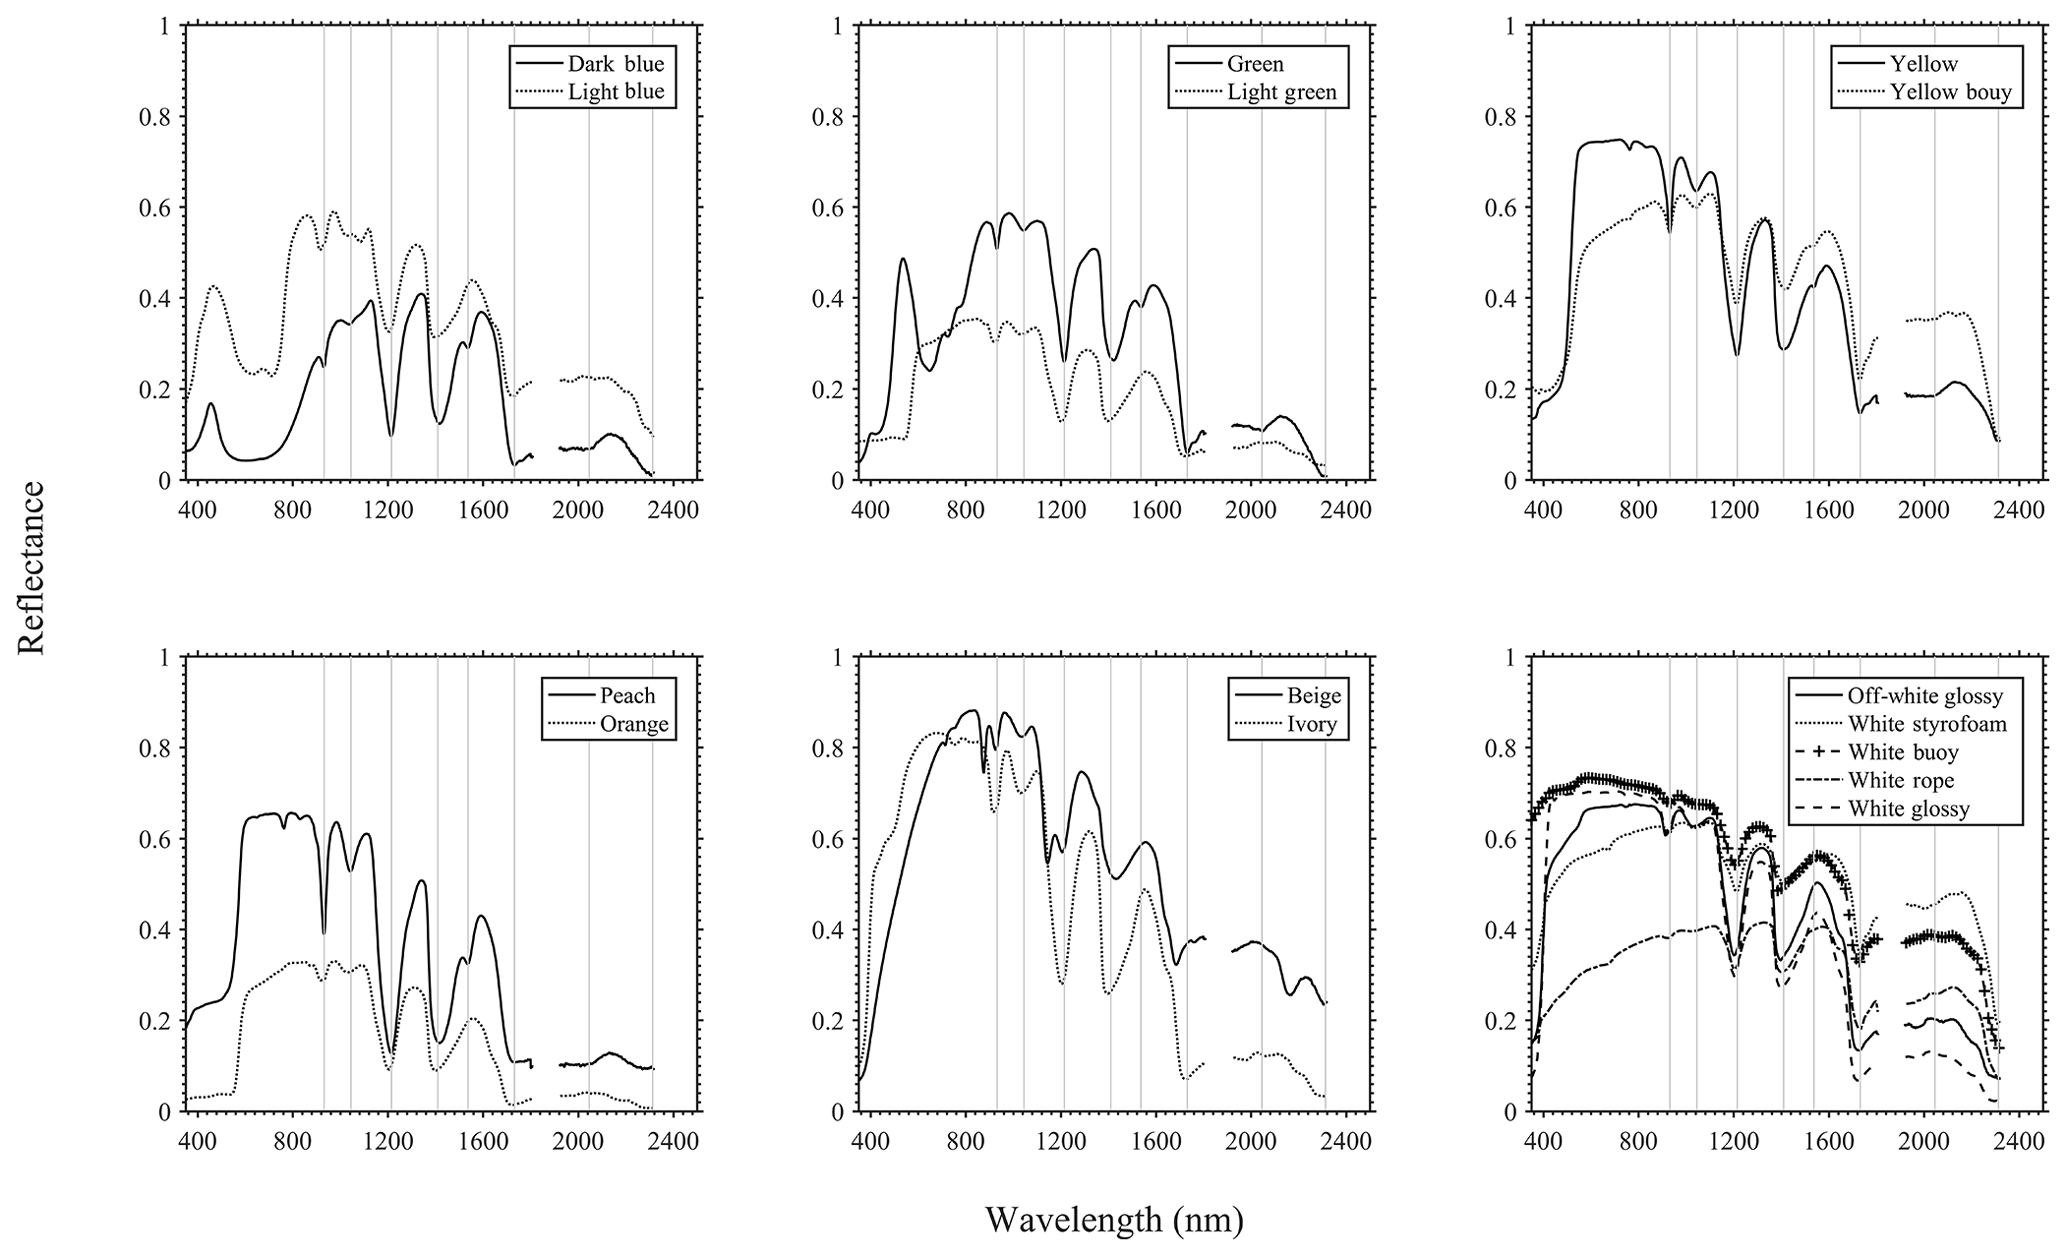
Figure 3Spectral reflectance of dry washed-ashore macroplastics harvested along the western coast of the USA. Absorption features noted in marine-harvested microplastics are highlighted by the vertical lines (centred around ∼931, 1045, 1215, 1417, 1537, 1732, 2046 and 2313 nm).
3.2 Marine-harvested microplastics
Spectral reflectance of the dry marine-harvested microplastics (Garaba and Dierssen, 2019c) increased with wavelength reaching the highest values in the NIR at 850 nm then decreasing towards the SWIR wavebands. All spectra were close to uniform in both spectral shape (mean Θ<5∘) and magnitude (percentage ranges <40 %) compared to the macroplastics. A non-parametric Kruskal–Wallis one-way analysis of variance was utilized to determine if any differences existed in the measured spectra of the dry marine-harvested microplastics. The statistical test suggested no significant differences (p<0.05) in the spectral reflectance from 350 to 2500 nm. We therefore determined a representative dry marine-harvested microplastic spectral endmember (Fig. 4). Absorption features identified in the dry washed-ashore macroplastic specimens (Fig. 3) were also found in the dry marine-harvested microplastics (Fig. 4).
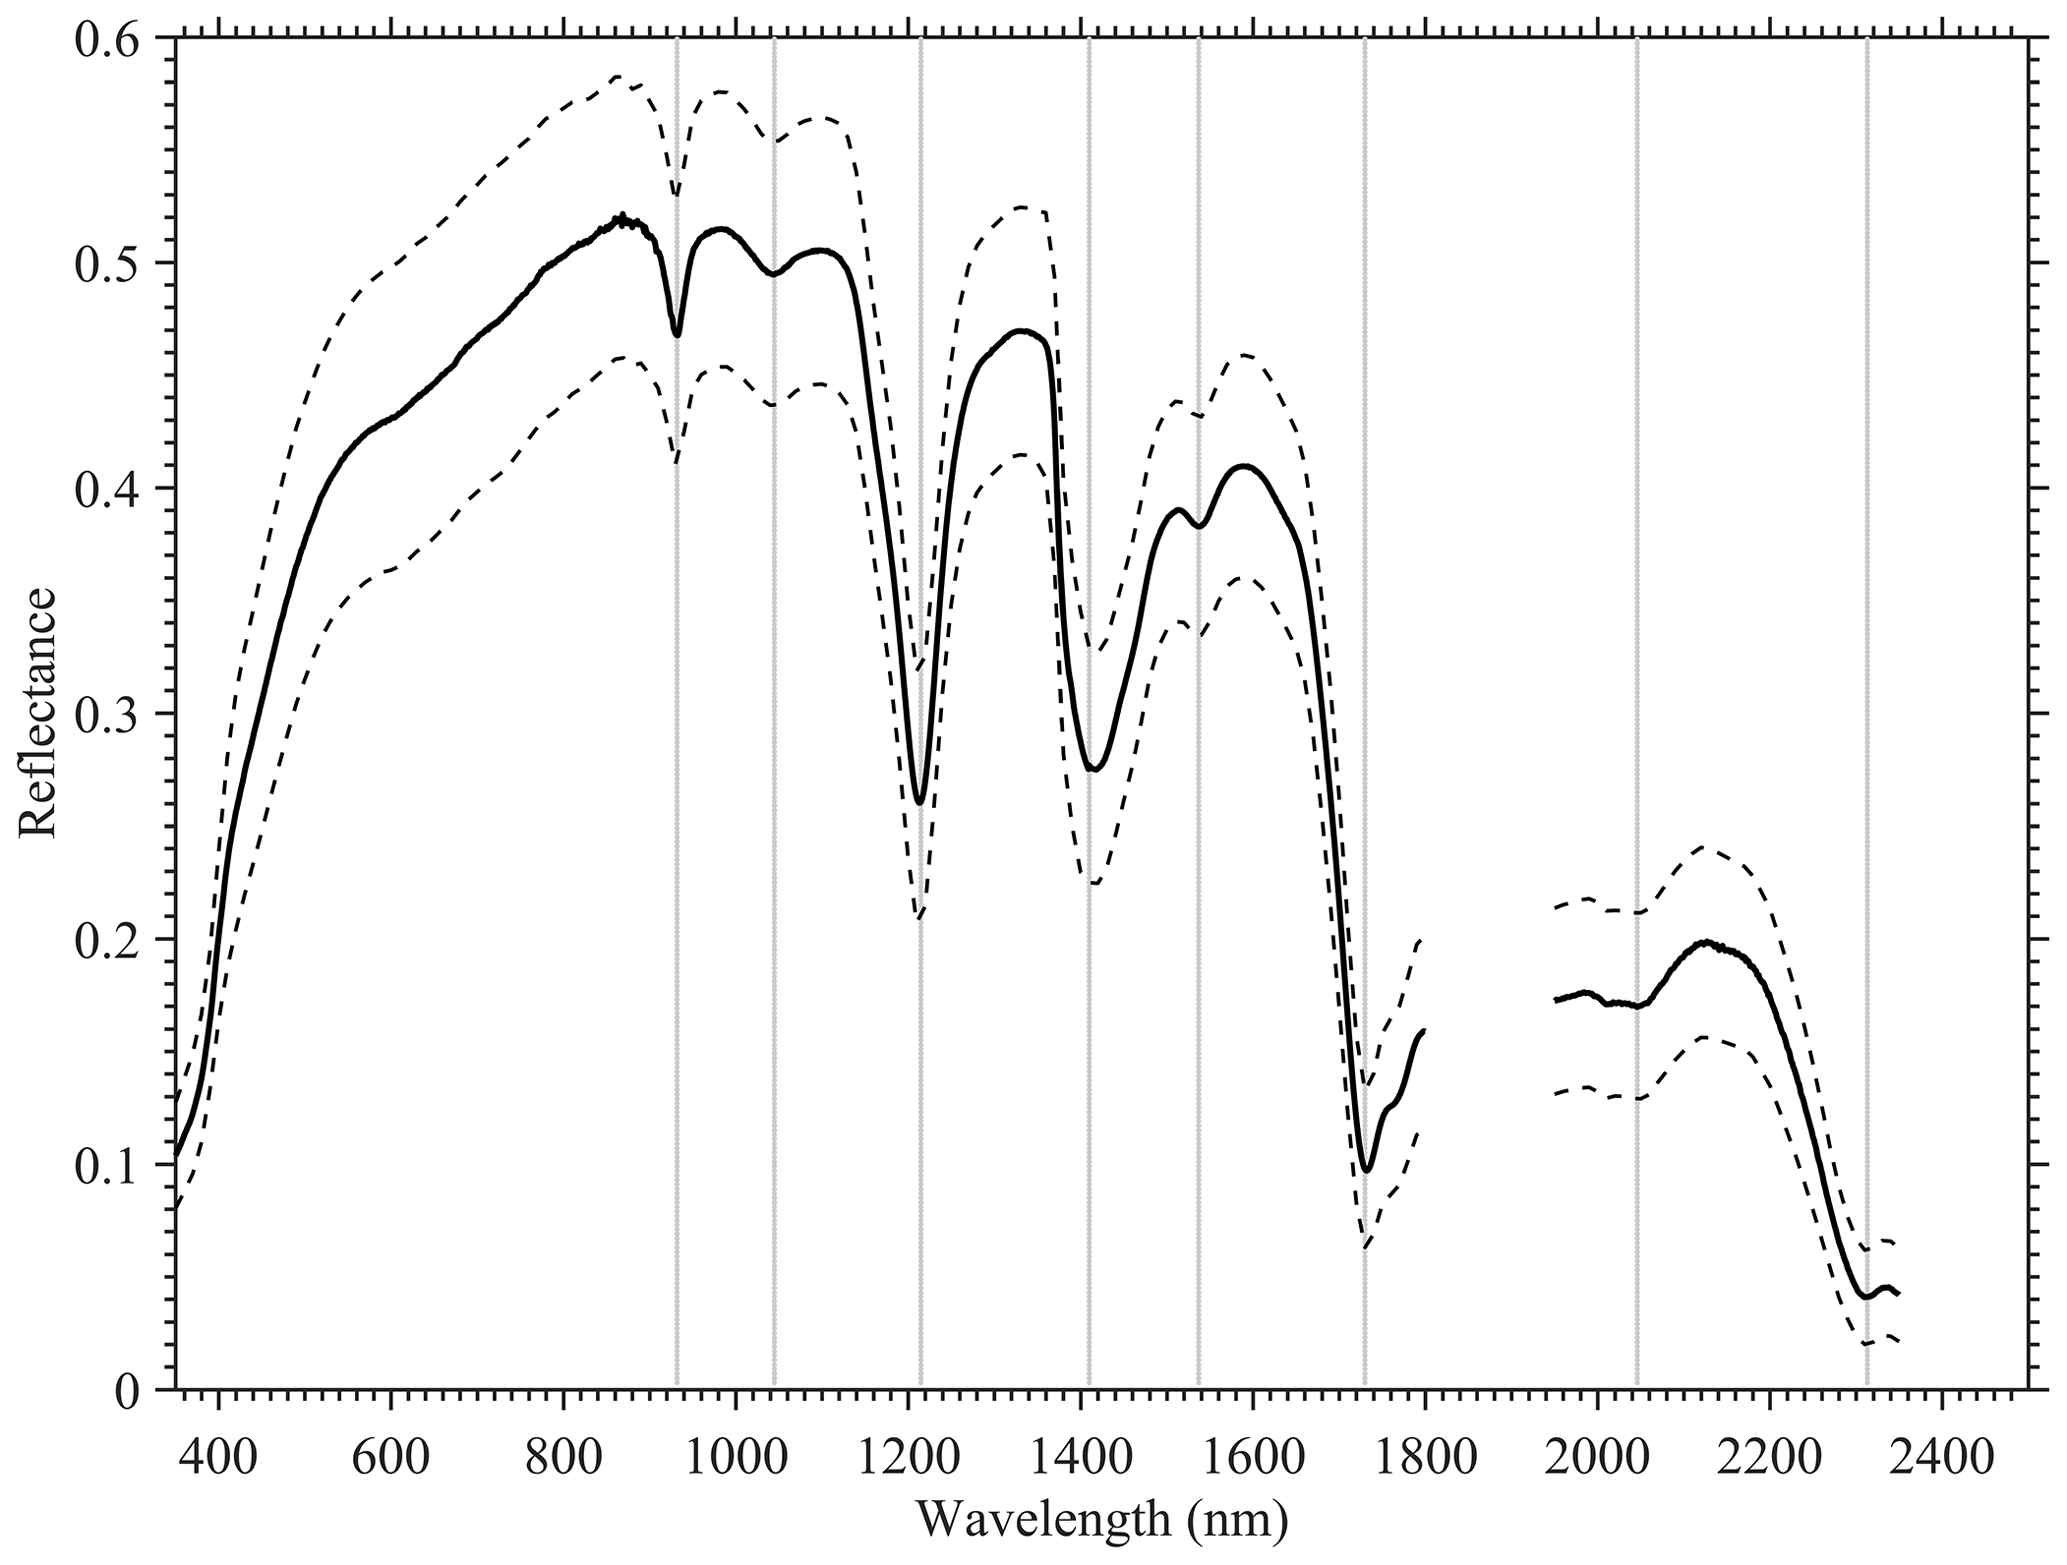
Figure 4Endmember spectral reflectance of the dry marine-harvested microplastics ± standard deviation (dashed lines). Identified unique absorption features are highlighted by the vertical lines and provide the wavebands that are outlined in grey (centred around ∼931, 1045, 1215, 1417, 1537, 1732, 2046 and 2313 nm).
Wet marine-harvested microplastics (Garaba and Dierssen, 2019b) had similar absorption features as found in the dry marine-harvested specimens (Fig. 5). However, the magnitude of R decreased by 12 % in the UV to 90 % in the SWIR, due to the presence of water mixed with the samples. The loss of reflectance in the plastics was observed to be consistent with the increase in the absorption coefficient of pure water (Fig. 5b). Average decrease in the measured R was 56±23 %. In addition, the spectral absorption features were less pronounced in the wet samples compared to the dry and some were not noticeable (1045, 1537 and all >2000)
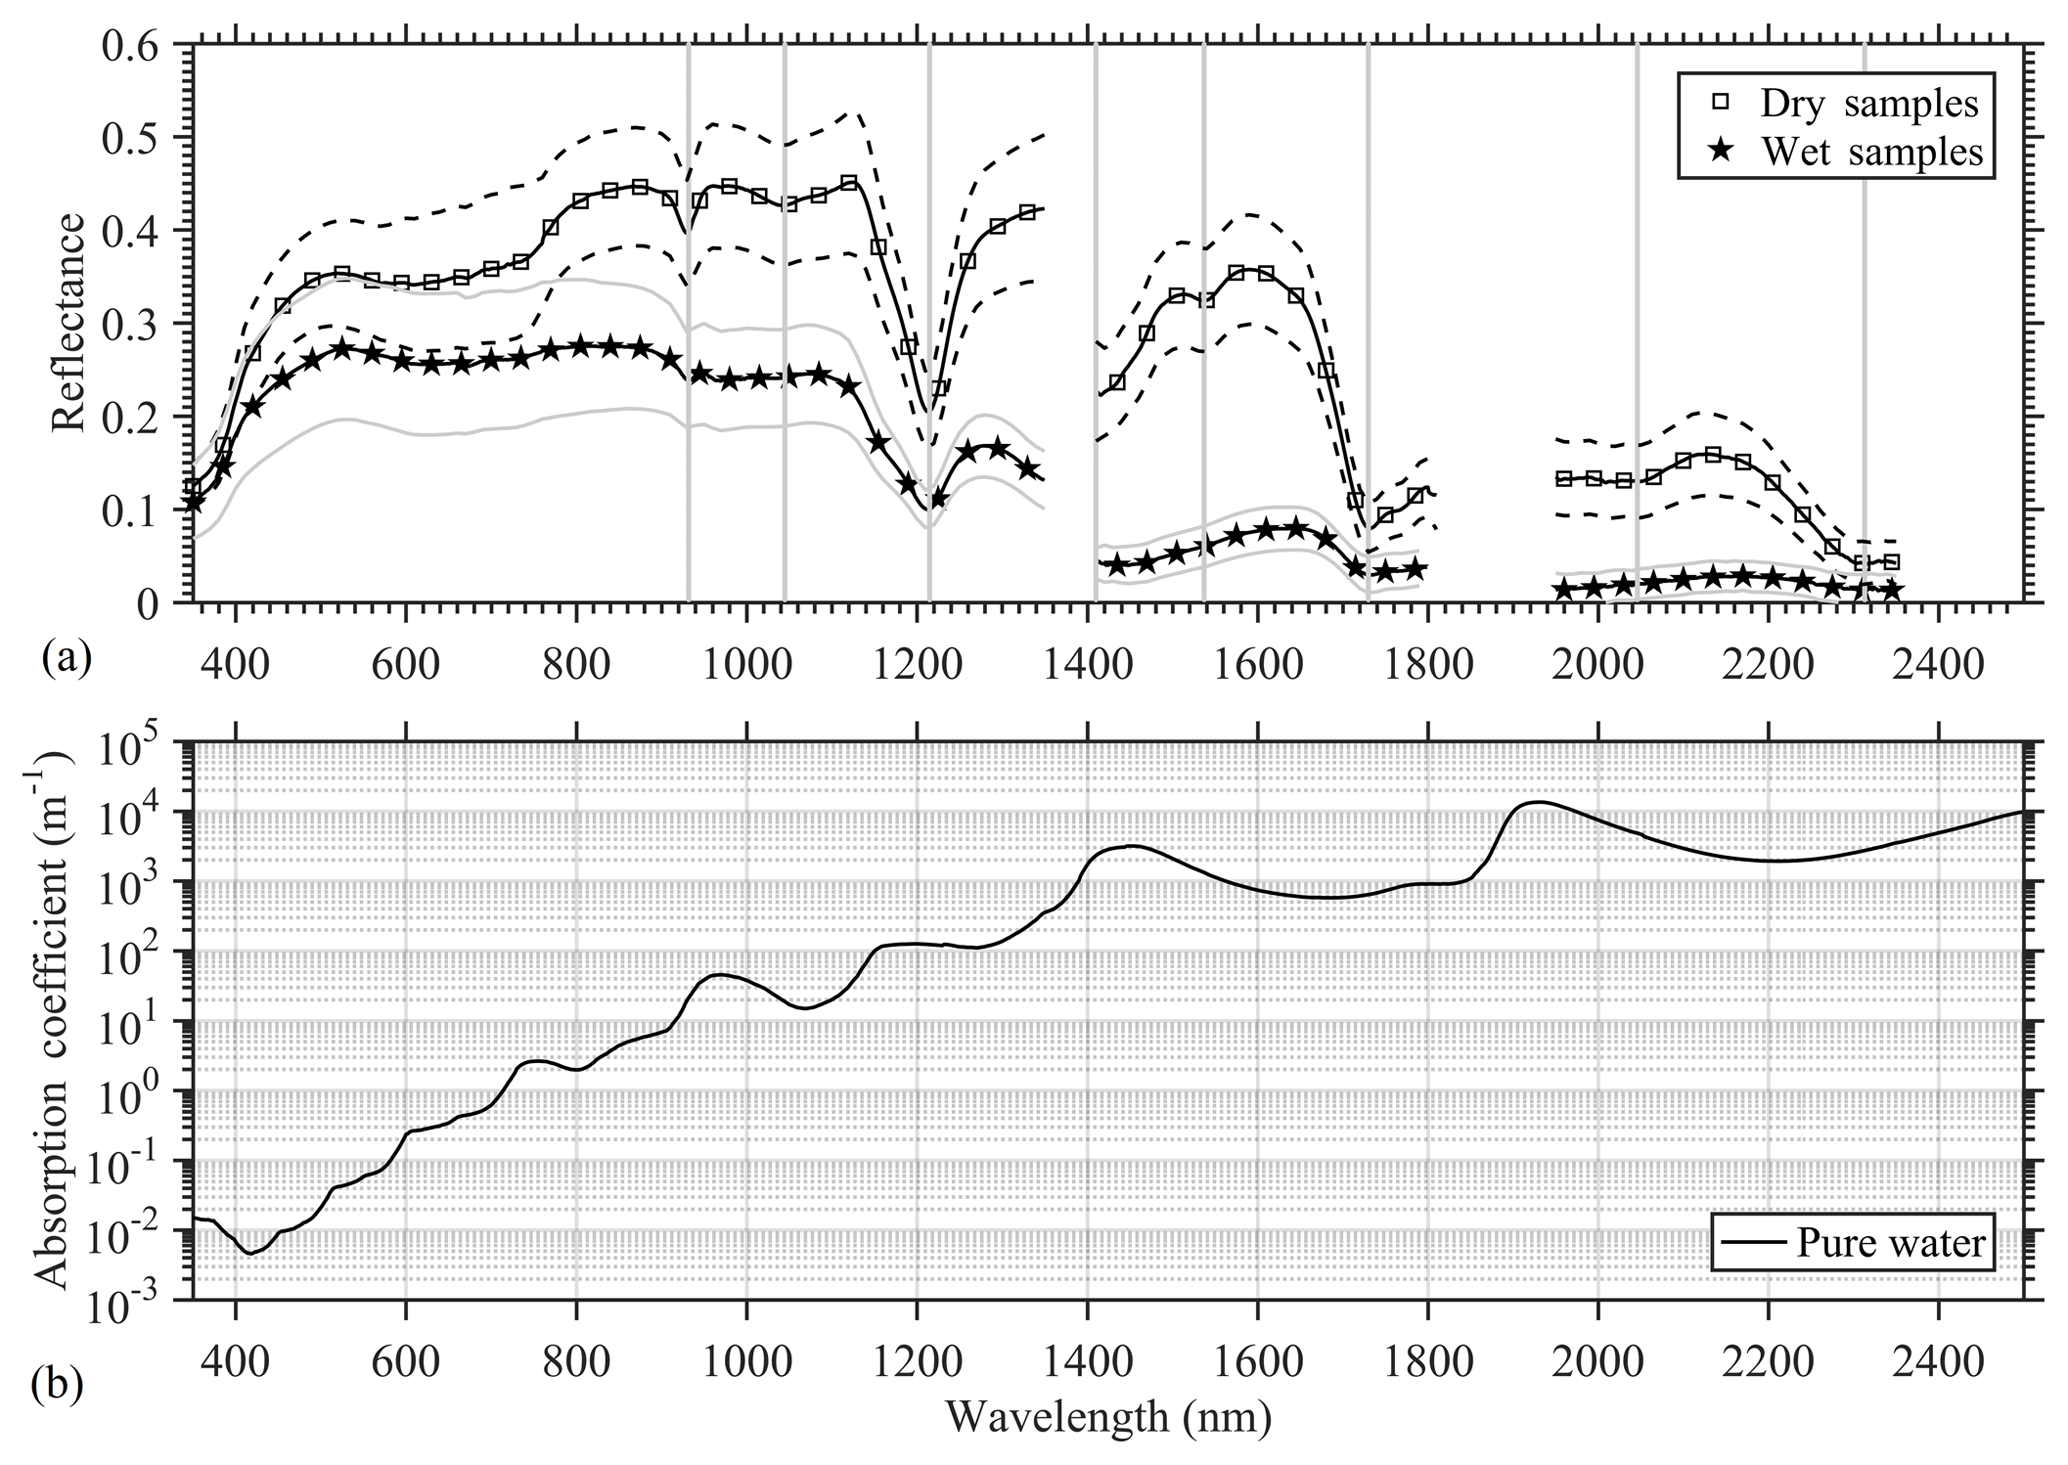
Figure 5(a) Mean bulk spectral reflectance of dry and wet marine-harvested microplastics ± standard deviation (dashed lines). Absorption features noted in marine-harvested microplastics are highlighted by the vertical lines (centred around ∼931, 1045, 1215, 1417, 1537, 1732, 2046 and 2313 nm). (b) Absorption coefficient of pure water (Rottgers et al., 2011).
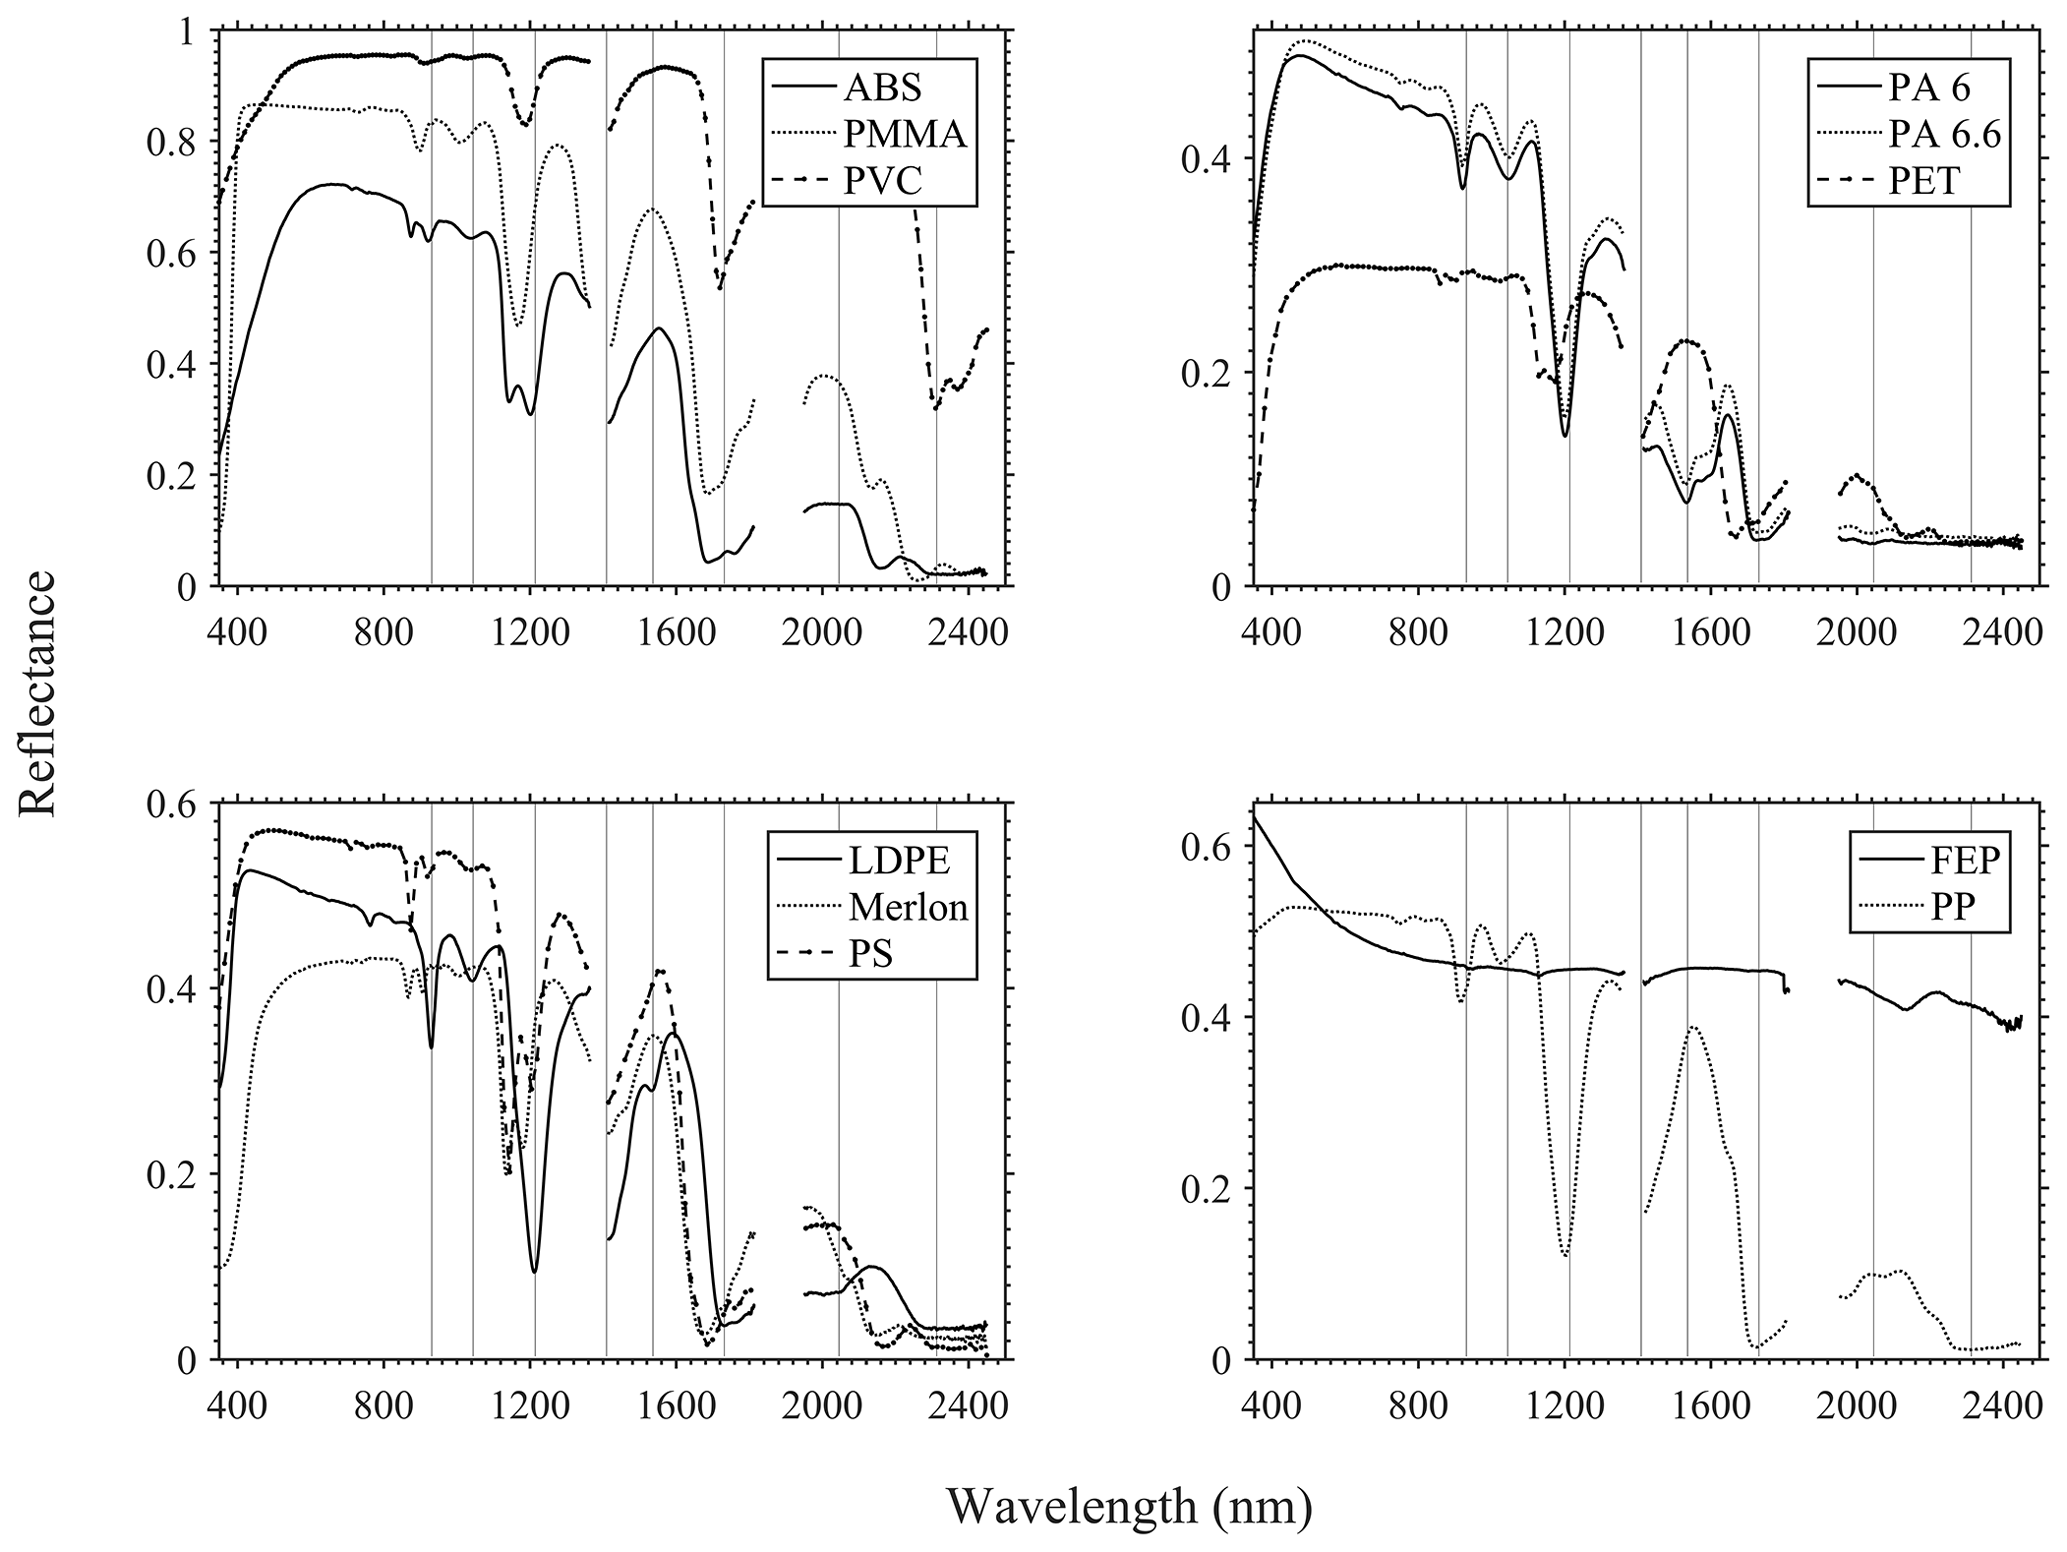
Figure 6Spectral reflectance of dry virgin pellets and absorption features found in marine-harvested and washed-ashore plastics highlighted by the vertical lines. Absorption features identified in marine-harvested microplastics are highlighted by the vertical lines (centred around ∼931, 1045, 1215, 1417, 1537, 1732, 2046 and 2313 nm).
3.3 Virgin pellets
Spectral properties of the dry virgin pellets (Garaba and Dierssen, 2017) varied in magnitude and shape (Fig. 6). However, two specimens of PA (6 and 6.6) did show very strong similarities (Θ=2.1∘), although the apparent opacity of PA 6 was lower than that of PA 6.6. FEP was generally flat in the NIR to SWIR. Overall, the highest reflectance was observed in the specimens of ABS, PMMA and PVC, while the lowest was observed in PET. Only FEP and PVC were noted to have a strong reflectance in the SWIR>1900 nm with R>0.4. Several of the absorption features from the marine-harvested and washed-ashore specimens were duplicated in the dry virgin pellets, although some features were absent, e.g. FEP, or shifted compared to the marine plastics (Fig. 6). We also determined that our marine-harvested microplastic endmember was best matched to PMMA, PP, LDPE and PET (Garaba and Dierssen, 2018).

3.4 Morphology of dry marine-harvested microplastics
Morphometric measurements were completed on a total of 47 microplastic particles from different size classes (Table 1). The particles were brittle and could fracture with handling. Sphericity of the observed particles ranged from low to high sphericity, whilst the roundness was between subangular to very angular (Table 1). Dry virgin pellets in common ocean plastic litter had varying opacity of the colour white. Table 1 is available as an Excel sheet in the Supplement.
We measured Lambertian-equivalent spectral reflectances of washed-ashore, marine-harvested, and virgin plastics and identified eight absorption features (centred around ∼931, 1045, 1215, 1417, 1537, 1732, 2046 and 2313 nm) in most of the weathered specimen. Location of these absorption features agreed well with prior reports (Asadzadeh and de Souza Filho, 2017; Hörig et al., 2001). Of these eight wavebands, we concluded that ∼931, 1215, 1417 and 1732 nm were diagnostic absorption features after continuum removal and derivative analyses. Several studies have already shown prospective applications of the ∼1215 and ∼1732 nm wavebands in detection and quantification algorithms for floating and land-based plastic litter (Garaba et al., 2018; Goddijn-Murphy and Dufaur, 2018; Kühn et al., 2004). Unfortunately, the 931 nm and the 1417 nm absorption features fall outside the atmospheric window. These features pose a challenge for algorithm development as the plastic-specific signal will be scrambled in the signal from atmospheric gases, especially water vapour around ∼900 and ∼1400 nm. We also simulated the potential detection of submerged plastics and observed a decrease in the measured R, which was consistent with the enhanced absorption of light by pure water in the SWIR (Fig. 5). One aspect that was not addressed with the dataset was the depth at which the submerged plastic can be detected, it is important to further study the optical properties of plastic litter with varying water depth. Due to enhanced water absorption, spectral features in the NIR and SWIR region will quickly disappear as particles submerge, and only reflectance in visible wavelengths would be detectable with remote sensing.
The polymer characterization of the specimen is a key factor in advancing scientific evidence-based knowledge, complemented by spectral measurements as it enables researchers to further create essential descriptors for remote sensing applications related to plastic litter. Laboratory techniques are typically used to accurately determine polymer compositions of marine-harvested or washed-ashore plastics, these include Fourier transform infrared (FTIR), Raman spectroscopy and pyrolysis gas chromatography (Thevenon et al., 2014). However, in our case, the washed-ashore macroplastics were part of an ongoing travelling plastic litter awareness exhibit and no detailed analyses could be conducted to determine polymer composition. The only descriptors obtained from the washed-ashore macroplastics were the object colour, shape and form, and spectral reflectance. Future campaigns are recommended to collect additional high-quality descriptors (polymer composition, refractive index, date of manufacture, sphericity and individual size distribution) of plastic specimens that will improve classification and radiative transfer modelling efforts. It is also important to consider the possibilities of expanding the spectral reference library through spectral unmixing simulations to create blended polymers from the virgin pellets.
Variability in the spectra was reported within 1 standard deviation and a median was also determined to be consistent with the literature (Dierssen, 2019; Russell et al., 2016; Zibordi et al., 2011). However, future measurements should include comprehensive uncertainty budgets to enable advanced error propagation efforts when data are assimilated into radiative transfer models. Implementing the algorithms that use spectral shape and continuum removal approaches reduces the uncertainties related to variations in magnitude. These investigations should also explore the possible anisotropic optical properties of plastic litter, especially as it breaks down and weathers in the natural environment.
Quality control was performed according to the guidelines of SeaDataNet. All the datasets are in open-access via the online repository EcoSIS spectral library https://ecosis.org/ (last access: 7 January 2020; EcoSIS, 2020). The dry marine-harvested microplastics spectral data are available at https://doi.org/10.21232/jyxq-1m66 (Garaba and Dierssen, 2019c). Washed-ashore plastics spectral data are available at https://doi.org/10.21232/ex5j-0z25 (Garaba and Dierssen, 2019a). The virgin pellets spectral data are available at https://doi.org/10.21232/C27H34 (Garaba and Dierssen, 2017). The dry and wet marine-harvested microplastics spectral dataset is available at https://doi.org/10.21232/r7gg-yv83 (Garaba and Dierssen, 2019b).
We have established an open-access dataset of hyperspectral reflectances of dry washed-ashore macroplastics, dry marine-harvested microplastics, artificially wetted marine-harvested microplastics and virgin pellets. The dataset provides some of the first baseline measurements that can be assimilated into radiative transfer modelling to improve scientific knowledge of the contribution of plastic litter to the bulk signal reaching remote sensing sensors. Furthermore, such knowledge about the hyperspectral characteristics of micro and macroplastics litter can be used to evaluate the capabilities and application of current multispectral sensors in remote sensing efforts. Using spectral response functions of current remote sensing tools (airborne, unmanned aerial systems, high-altitude pseudo-satellites, satellites) it is also possible to simulate the spectral signature of our dataset, this information would be crucial in the design of future or planned remote sensing tools.
The supplement related to this article is available online at: https://doi.org/10.5194/essd-12-77-2020-supplement.
SPG and HMD contributed equally to the experiment and manuscript preparation.
The authors declare that they have no conflict of interest.
We would like to thank Brandon J. Russell, Adam Chlus and Kaylan Randolph for their support during spectral data collection. We extend our gratitude to Anna-Marie Cook and Bill Robberson at the US EPA Region 9 Marine Debris Program, Kara L. Law, Jessica Donohue at the Sea Education Association, the Institute of Materials Science at the University of Connecticut, and Mystic Aquarium for providing plastic samples.
This research has been supported by the National Aeronautics and Space Administration Ocean Biology and Biogeochemistry (grant no. NNX15AC32G) and the Deutsche Forschungsgemeinschaft (grant no. 417276871).
This paper was edited by Jens Klump and reviewed by Elizabeth C. Atwood and one anonymous referee.
Aoyama, T.: Extraction of marine debris in the Sea of Japan using satellite images, in Proceedings of SPIE Volume: 10778, Remote sensing of the open and coastal ocean and inland waters, Honolulu, Hawaii, USA, 2018, 107780R-107781–107780R-107788, https://doi.org/10.1117/12.2324621, 2018.
Asadzadeh, S. and de Souza Filho, C. R.: Spectral remote sensing for onshore seepage characterization: A critical overview, Earth-Sci. Rev., 168, 48–72, https://doi.org/10.1016/j.earscirev.2017.03.004, 2017.
Clark, R. N.: Spectral properties of mixtures of montmorillonite and dark carbon grains: Implications for remote sensing minerals containing chemically and physically adsorbed water, J. Geophys. Res.-Solid Earth, 88, 10635–10644, https://doi.org/10.1029/JB088iB12p10635, 1983.
Clark, R. N.: Spectroscopy of rocks and minerals, and principles of spectroscopy, in: Manual of Remote Sensing, edited by: Rencz, A. N., John Wiley and Sons, New York, 3-58, 1999.
Clark, R. N., Swayze, G. A., Livo, K. E., Kokaly, R. F., Sutley, S. J., Dalton, J. B., McDougal, R. R., and Gent, C. A.: Imaging spectroscopy: Earth and planetary remote sensing with the USGS Tetracorder and expert systems, J. Geophys. Res.-Planets, 108, 5131, https://doi.org/10.1029/2002JE001847, 2003.
Dierssen, H., McManus, G. B., Chlus, A., Qiu, D., Gao, B.-C., and Lin, S.: Space station image captures a red tide ciliate bloom at high spectral and spatial resolution, P. Natl. Acad. Sci. USA, 112, 14783–14787, https://doi.org/10.1073/pnas.1512538112, 2015.
Dierssen, H. M.: Hyperspectral Measurements, Parameterizations, and Atmospheric Correction of Whitecaps and Foam From Visible to Shortwave Infrared for Ocean Color Remote Sensing, 7, 1–18, https://doi.org/10.3389/feart.2019.00014, 2019.
EcoSIS: Ecosystem Spectral Information System, Online Repository, available at: https://ecosis.org/, last access: 7 January 2020.
G20: Annex to G20 Leaders Declaration: G20 Action Plan on Marine Litter, G20 Summit 2017, Hamburg, Germany (7–8 July), 2017.
Garaba, S. P. and Dierssen, H. M.: Spectral reference library of 11 types of virgin plastic pellets common in marine plastic debris, Ecological Spectral Information System (EcoSIS), https://doi.org/10.21232/C27H34, 2017.
Garaba, S. P. and Dierssen, H. M.: An airborne remote sensing case study of synthetic hydrocarbon detection using short wave infrared absorption features identified from marine-harvested macro- and microplastics, Remote Sens. Environ., 205, 224–235, https://doi.org/10.1016/j.rse.2017.11.023, 2018.
Garaba, S. P. and Dierssen, H. M.: Spectral reflectance of washed ashore macroplastics, Ecological Spectral Information System (EcoSIS), https://doi.org/10.21232/ex5j-0z25, 2019a.
Garaba, S. P. and Dierssen, H. M.: Spectral reflectance of dry and wet marine-harvested microplastics from Kamilo Point, Pacific Ocean, Ecological Spectral Information System (EcoSIS), https://doi.org/10.21232/r7gg-yv83, 2019b.
Garaba, S. P. and Dierssen, H. M.: Spectral reflectance of dry marine-harvested microplastics from North Atlantic and Pacific Ocean, Ecological Spectral Information System (EcoSIS), https://doi.org/10.21232/jyxq-1m66, 2019c.
Garaba, S. P., Aitken, J., Slat, B., Dierssen, H. M., Lebreton, L., Zielinski, O., and Reisser, J.: Sensing ocean plastics with an airborne hyperspectral shortwave infrared imager, Environ. Sci. Technol., 52, 11699–11707, https://doi.org/10.1021/acs.est.8b02855, 2018.
GESAMP: Sources, fate and effects of microplastics in the marine environment: a global assessment. (IMO/FAO/UNESCO-IOC/UNIDO/WMO/IAEA/UN/UNEP/UNDP Joint Group of Experts on the Scientific Aspects of Marine Environmental Protection). GESAMP Report and Studies No. 90, International Maritime Organization – London, UK, 96, 2015.
Goddijn-Murphy, L. and Dufaur, J.: Proof of concept for a model of light reflectance of plastics floating on natural waters, Mar. Pollut. Bull., 135, 1145–1157, https://doi.org/10.1016/j.marpolbul.2018.08.044, 2018.
Hidalgo-Ruz, V., Gutow, L., Thompson, R. C., and Thiel, M.: Microplastics in the Marine Environment: A Review of the Methods Used for Identification and Quantification, Environ. Sci. Technol., 46, 3060–3075, https://doi.org/10.1021/es2031505, 2012.
Hörig, B., Kühn, F., Oschütz, F., and Lehmann, F.: HyMap hyperspectral remote sensing to detect hydrocarbons, Int. J. Remote Sens., 22, 1413–1422, https://doi.org/10.1080/01431160120909, 2001.
Huguenin, R. L. and Jones, J. L.: Intelligent information extraction from reflectance spectra: Absorption band positions, J. Geophys. Res.-Solid Earth, 91, 9585–9598, https://doi.org/10.1029/JB091iB09p09585, 1986.
Kako, S. I., Isobe, A., and Magome, S.: Low altitude remote-sensing method to monitor marine and beach litter of various colors using a balloon equipped with a digital camera, Mar. Pollut. Bull., 64, 1156–1162, https://doi.org/10.1016/j.marpolbul.2012.03.024, 2012.
Kühn, F., Oppermann, K., and Hörig, B.: Hydrocarbon Index – an algorithm for hyperspectral detection of hydrocarbons, Int. J. Remote Sens., 25, 2467–2473, https://doi.org/10.1080/01431160310001642287, 2004.
Law, K. L., Morét-Ferguson, S., Maximenko, N. A., Proskurowski, G., Peacock, E. E., Hafner, J., and Reddy, C. M.: Plastic accumulation in the North Atlantic Subtropical Gyre, Science, 329, 1185–1188, https://doi.org/10.1126/science.1192321, 2010.
Lebreton, L., Slat, B., Ferrari, F., Sainte-Rose, B., Aitken, J., Marthouse, R., Hajbane, S., Cunsolo, S., Schwarz, A., Levivier, A., Noble, K., Debeljak, P., Maral, H., Schoeneich-Argent, R., Brambini, R., and Reisser, J.: Evidence that the Great Pacific Garbage Patch is rapidly accumulating plastic, Sci. Rep., 8, 4666, https://doi.org/10.1038/s41598-018-22939-w, 2018.
Maximenko, N., Arvesen, J., Asner, G., Carlton, J., Castrence, M., Centurioni, L., Chao, Y., Chapman, J., Chirayath, V., Corradi, P., Crowley, M., Dierssen, H. M., Dohan, K., Eriksen, M., Galgani, F., Garaba, S. P., Goni, G., Griffin, D., Hafner, J., Hardesty, D., Isobe, A., Jacobs, G., Kamachi, M., Kataoka, T., Kubota, M., Law, K. L., Lebreton, L., Leslie, H. A., Lumpkin, R., Mace, T. H., Mallos, N., McGillivary, P. A., Moller, D., Morrow, R., Moy, K. V., Murray, C. C., Potemra, J., Richardson, P., Robberson, B., Thompson, R., van Sebille, E., and Woodring, D.: Remote sensing of marine debris to study dynamics, balances and trends, Community White Paper Produced at the Workshop on Mission Concepts for Marine Debris Sensing, 22, 2016.
Nicodemus, F. E., Richmond, J. C., Hsia, J. J., Ginsberg, I. W., and Limperis, T.: Geometrical considerations and nomenclature for reflectance, Final Report National Bureau of Standards, US Department of Commerce, National Bureau of Standards, Washington, DC, USA, 1–52, NBS MN-160, 1977.
Powers, M. C.: A new roundness scale for sedimentary particles, J. Sediment. Res., 23, 117–119, https://doi.org/10.1306/d4269567-2b26-11d7-8648000102c1865d, 1953.
Rottgers, R., Doerffer, R., McKee, D., and Schonfeld, W.: Algorithm Theoretical Basis Document: The Water Optical Properties Processor (WOPP) – Pure water spectral absorption, scattering, and real part of refractive index model, Helmholtz-Zentrum Geesthacht and University of Strathclyde, ESA/ESRIN, 20, 2011.
Russell, B., Dierssen, H., LaJeunesse, T., Hoadley, K., Warner, M., Kemp, D., and Bateman, T.: Spectral reflectance of Palauan reef-building coral with different symbionts in response to elevated temperature, Remote Sens. (Basel), 8, 164, https://doi.org/10.3390/rs8030164, 2016.
Thevenon, F., Carroll, C., Sousa, J., and (Editors): Plastic debris in the ocean: The characterization of marine plastics and their environmental impacts, situation analysis report, International Union for Conservation of Nature, Gland, Switzerland, 52, 2014.
Topouzelis, K., Papakonstantinou, A., and Garaba, S. P.: Detection of floating plastics from satellite and unmanned aerial systems (Plastic Litter Project 2018), Int. J. Appl. Earth Obs. Geoinfo., 79, 175–183, https://doi.org/10.1016/j.jag.2019.03.011, 2019.
Tsai, F. and Philpot, W.: Derivative analysis of hyperspectral data, Remote Sens. Environ., 66, 41–51, https://doi.org/10.1016/S0034-4257(98)00032-7, 1998.
Wan, K. X., Vidavsky, I., and Gross, M. L.: Comparing similar spectra: from similarity index to spectral contrast angle, J. Am. Soc. Mass. Spectrom., 13, 85–88, https://doi.org/10.1016/S1044-0305(01)00327-0, 2002.
Werner, S., Budziak, A., van Franeker, J., Galgani, F., Hanke, G., Maes, T., Matiddi, M., Nilsson, P., Oosterbaan, L., Priestland, E., Thompson, R., Veiga, J., and Vlachogianni, T.: Harm caused by Marine Litter, Luxembourg: Publications Office of the European Union, 92, 2016.
Zibordi, G., Berthon, J. F., Mélin, F., and D'Alimonte, D.: Cross-site consistent in situ measurements for satellite ocean color applications: The BiOMaP radiometric dataset, Remote Sens. Environ., 115, 2104–2115, https://doi.org/10.1016/j.rse.2011.04.013, 2011.