the Creative Commons Attribution 4.0 License.
the Creative Commons Attribution 4.0 License.
 | 07 May 2021
Large-scale climate signals of a European oxygen isotope network from tree rings
Monica Ionita
Martin Wegmann
Gerhard Helle
Gerhard H. Schleser
Norel Rimbu
Mandy B. Freund
Ingo Heinrich
Diana Caldarescu
Gerrit Lohmann
We investigate the climate signature of δ18O tree-ring records from sites distributed all over Europe covering the last 400 years. An empirical orthogonal function (EOF) analysis reveals two distinct modes of variability on the basis of the existing δ18O tree-ring records. The first mode is associated with anomaly patterns projecting onto the El Niño–Southern Oscillation (ENSO) and reflects a multi-seasonal climatic signal. The ENSO link is pronounced for the last 130 years, but it is found to be weak over the period from 1600 to 1850, suggesting that the relationship between ENSO and the European climate may not be stable over time. The second mode of δ18O variability, which captures a north–south dipole in the European δ18O tree-ring records, is related to a regional summer atmospheric circulation pattern, revealing a pronounced centre over the North Sea. Locally, the δ18O anomalies associated with this mode show the same (opposite) sign with temperature (precipitation). Based on the oxygen isotopic signature derived from tree rings, we argue that the prevailing large-scale atmospheric circulation patterns and the related teleconnections can be analysed beyond instrumental records.
- Article
(15227 KB) -
Supplement
(1903 KB) - BibTeX
- EndNote


Tree growth is irrevocably affected by interactions with the hydrosphere, atmosphere, and pedosphere, and the influence of environmental factors is stored in the physical and chemical properties of each tree ring (Schweingruber, 1996). A major component of a tree ring is cellulose, which consists of the elements carbon, oxygen, and hydrogen. Their stable isotope signatures are determined by varying environmental conditions, influencing a series of fractionation processes during the uptake of CO2 and H2O from the atmosphere and soil as well as the biosynthesis of tree-ring cellulose. For instance, the climate signature of δ13C values of tree-ring cellulose basically originates from fractionations during photosynthesis at the leaf or needle level that generally lower the δ13C of the atmospheric CO2 source which contains no direct climatic signal (e.g. Schleser et al., 1995). δ18O of tree-ring cellulose (δ18Ocel) is of particular interest for palaeoclimate studies because it is related to source water, i.e. δ18O of precipitation (δ18OP), which is directly affected by climate processes, such as temperature during droplet condensation within air masses, transport distance from ocean source, type of precipitation (e.g. rain or snow), and precipitation amount (e.g. Dansgaard, 1964; Epstein et al., 1977; Rozanski et al., 1993). Within the arboreal system, δ18O of soil water (δ18OSW) constitutes the δ18O input and usually represents an average δ18OP over several precipitation events modified by partial evaporation from the soil (depending on soil texture and porosity) and by a possible time lag (depending on rooting depth) (Saurer et al., 2012). Representing the baseline variability, the oxygen isotope signature of tree-ring cellulose (δ18Ocel) is invariably tied to δ18OSW.
However, δ18Ocel is dependent on two more clusters of fractionations that reflect tree internal processes, namely (1) evaporative 18O enrichment of leaf or needle water via transpiration and (2) biochemical fractionations including partial isotopic exchange of cellulose precursors with trunk water during cellulose biosynthesis (e.g. Saurer et al., 1997; Roden et al., 2000; Barbour, 2007; Kahmen et al., 2011; Treydte et al., 2014; and citations therein). The biochemical fractionation during cellulose biosynthesis can be largely considered as constant at 27±4 ‰ (Sternberg and DeNiro, 1983). Nonetheless, varying leaf-to-air vapour pressure deficit and varying air humidity cause corresponding changes in the δ18O signature of leaf or needle water (e.g. Helliker and Griffiths, 2007). Although modified and dampened by physiological processes (e.g. Pèclet effect; Farquhar and Lloyd, 1993) and oxygen isotope exchange with stem water during cellulose synthesis (Hill et al., 1995), the variability of the 18O enrichment of leaf water clearly affects δ18Ocel, as well as the strong signature of δ18OP. For example, δ18Ocel values are used to reconstruct precipitation (e.g. Rinne et al., 2013), air temperature (e.g. Porter et al., 2014), and drought (e.g. Nagavciuc et al., 2019). As these quantities are largely based on transport processes within the atmosphere, the δ18Ocel values can be used to get detailed information about large-scale atmospheric circulation patterns (Brienen et al., 2012; Lavergne et al., 2016; Andreu-Hayles et al., 2017; Trouet et al., 2018, Nagavciuc et al., 2019, 2020). The resulting long-term perspective on the climate from the use of δ18Ocel as a climate proxy may be the key to identifying the influence of different external forcing on, and the internal variability of, the behaviour of large-scale atmospheric circulation.
One of the most important components for the internal climate variability is the El Niño–Southern Oscillation (ENSO), which influences the atmospheric circulation globally (Allan et al., 1996). As ENSO variability is strongest in winter, multiple studies have identified a significant ENSO impact on the European climate during this season. Observational studies (e.g. Fraedrich and Müller, 1992; Fraedrich, 1994; Brönnimann et al., 2004; Pozo-Vázquez et al., 2005; Brönnimann et al., 2007) and model studies (e.g. Merkel and Latif, 2002; Mathieu et al., 2004) suggest that an El Niño event leads to a negative phase of the North Atlantic Oscillation (NAO), with cold and dry conditions over northern Europe and wet and warm conditions over southeastern Europe in winter. Furthermore, it is also possible to identify a significant ENSO influence on European precipitation in spring (van Oldenborgh et al., 1998; Lloyd-Hughes and Saunders, 2002; Brönnimann et al., 2007; Helama et al., 2009). However, significant impacts of ENSO with respect to European droughts could only be detected for the most extreme El Niño events (King et al., 2020). The extent to which these preconditions influence the climate conditions during summer is not yet known for Europe, but this information could be the key to a better understanding of European climate. Nevertheless, the relatively short period of existing instrumental data (van Oldenborgh and Burgers, 2005; Brönnimann, 2007) makes it difficult to describe the full range of ENSO variability as well as its possible consequences with respect to the climate of the European continent (Domeisen et al., 2019). Furthermore, the response of different climate variables to ENSO variability is either non-stationary (e.g. Fraedrich and Müller, 1992) and/or non-linear. For example, Wu and Hsieh (2004) showed that the large-scale atmospheric circulation response to El Niño and La Niña is asymmetrical.
The aim of this study is to present a comprehensive spatio-temporal analysis of the large-scale European atmospheric circulation based on the climatological signals of a European δ18Ocel network that extends back ∼400 years. The climate signal of the isotope network is extracted using an empirical orthogonal function (EOF) analysis. The results of the first two components are compared to climate data and different ENSO reconstructions. The comparison is carried out using a composite analysis and a correlation analysis. To test if δ18Ocel can capture multi-seasonal signals, the first component of the isotope network is correlated with gridded fields of modelled δ18OP and δ18OSW. Finally, the major results are critically discussed and compared to other studies.
2.1 The isotope network
In this study, we investigate the first two dominant modes of variability of 26 δ18Ocel records, distributed over Europe, and their relationships with regional and large-scale climate anomalies. A total of 22 of the 26 δ18Ocel records were generated within the EU ISONET (Annual Reconstructions of European Climate Variability using a High-Resolution Isotopic network) project (Treydte et al., 2007a, b). Furthermore, four additional sites from Bulgaria, Turkey, southwestern Germany, and Slovenia were added to the ISONET network for the current study (Heinrich et al., 2013; Hafner et al., 2014). In total, the isotope network contains eight broadleaf tree sites (Quercus) and 18 coniferous tree sites (Pinus, Juniper, Larix, and Cedrus) from altitudes varying for each location from 10 m up to 2200 m above sea level (Fig. 1 and Table S1 in the Supplement). A total of 24 of the 26 sites are distributed over the European continent, whereas 2 additional sites are located in the Atlas Mountains of Morocco and in the Taurus Mountains of Turkey.
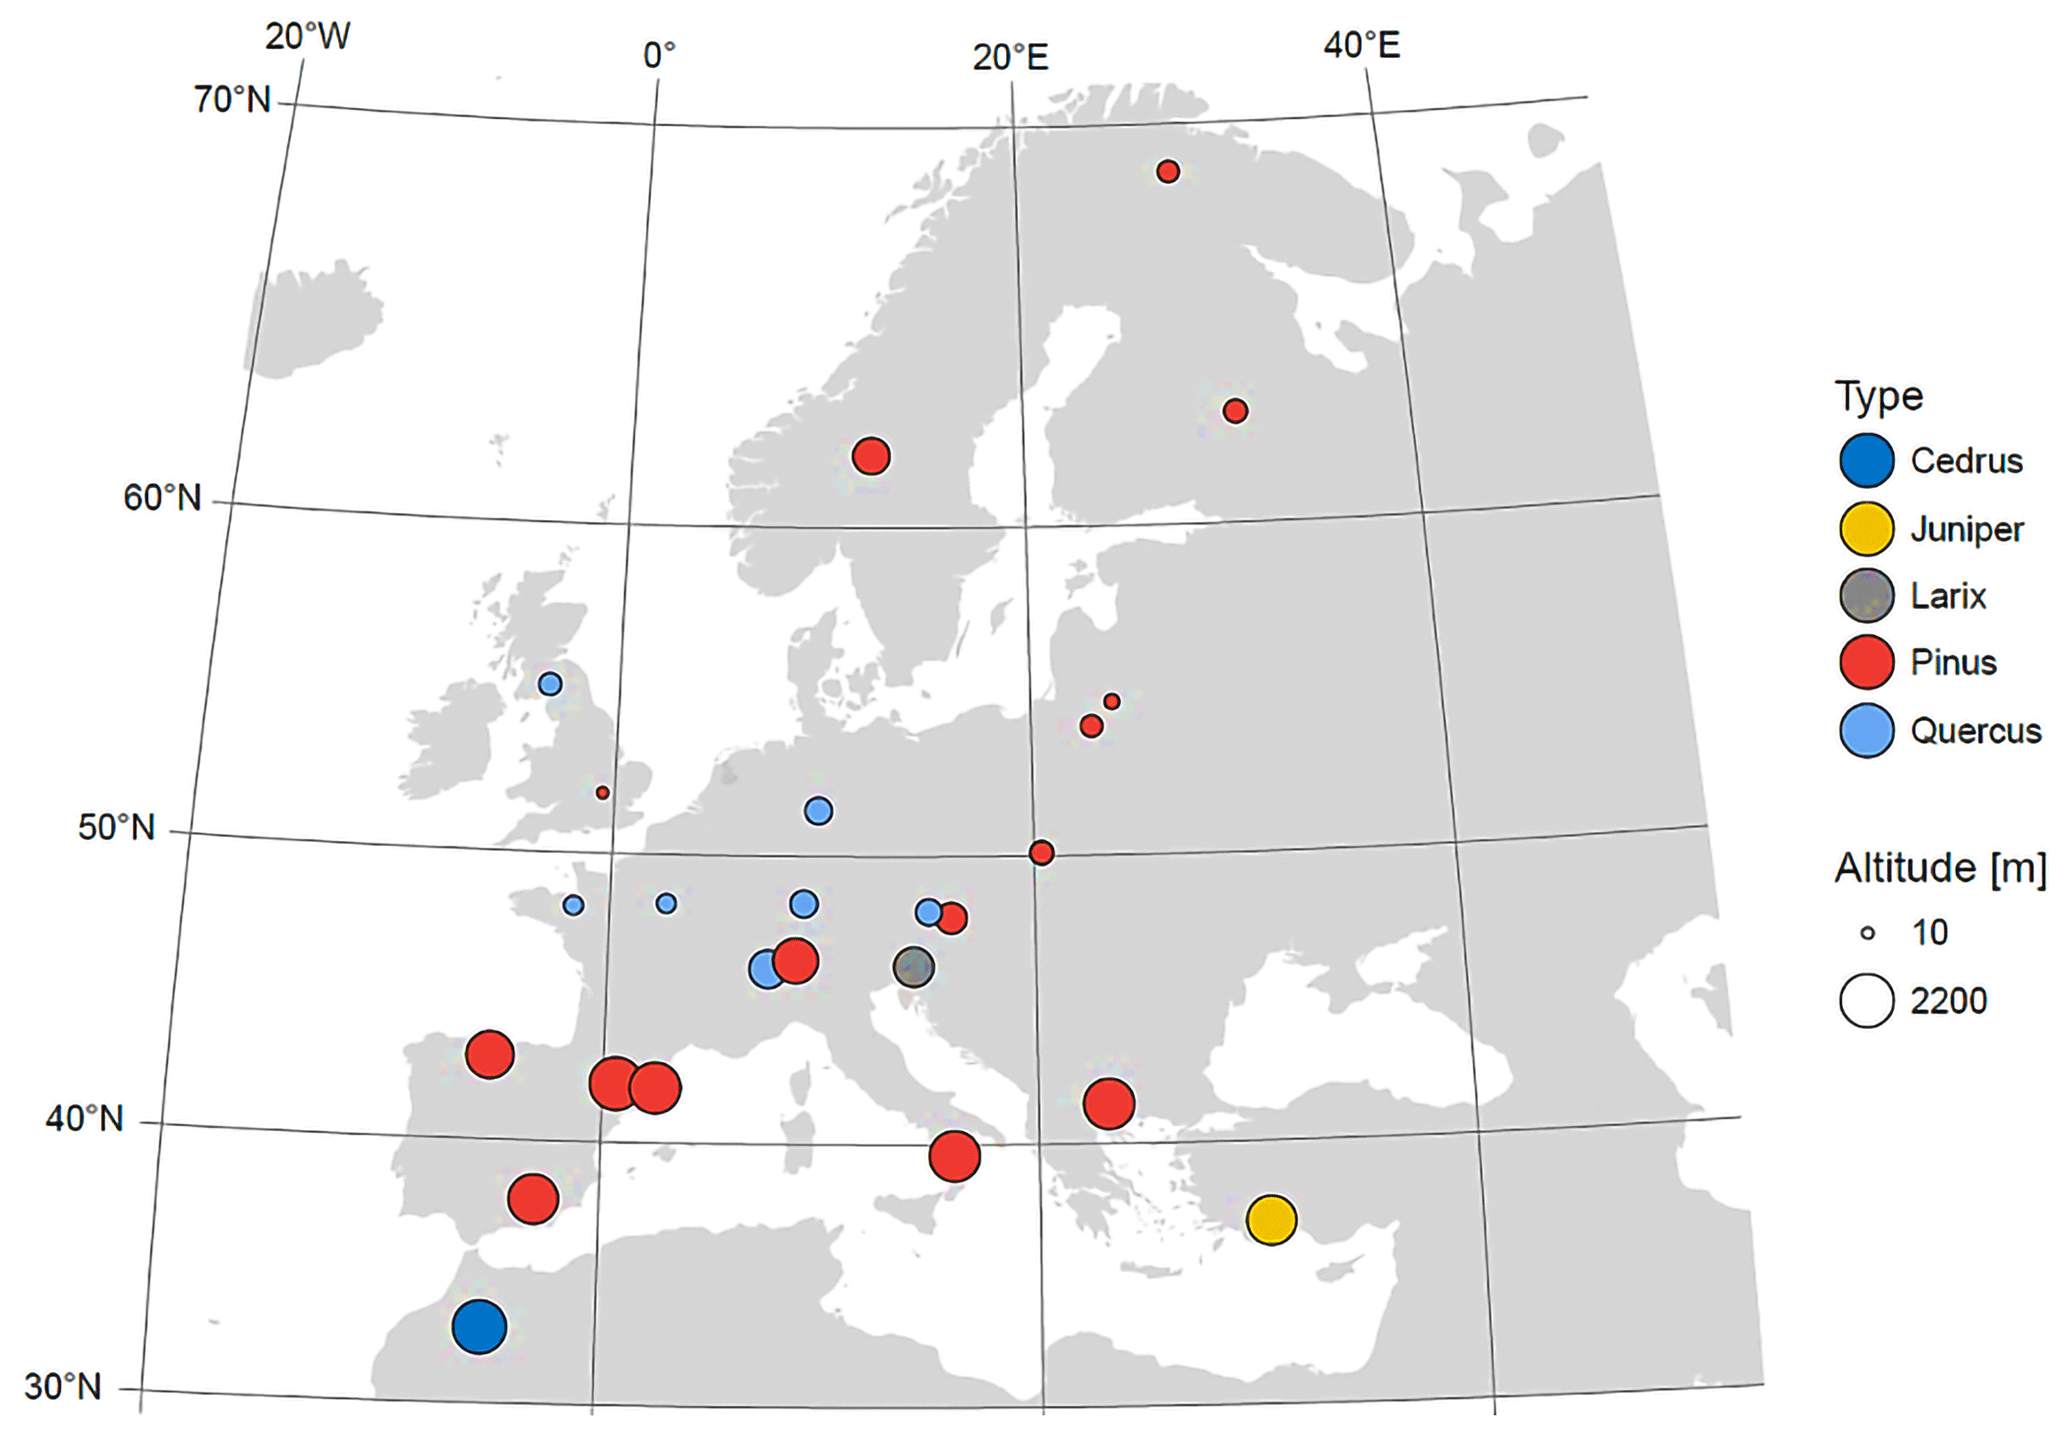
Figure 1Spatial distribution of sample sites combined with the corresponding altitude. The highest density of sample sites exists in central and western Europe. The colour indicates the tree type: Cedrus – dark blue, Juniper – yellow, Larix – grey, Pinus – red, and Quercus – light blue. The corresponding elevation (10–2200 m) is shown by the size of the circles.
The stable isotopes of oxygen in tree-ring cellulose, reported as δ18Ocel vs. Vienna Standard Mean Ocean Water (Craig, 1957), for each site were determined as described by Treydte et al. (2007a, b). At least four dominant trees were chosen per site, and two increment cores were taken per tree. After the standard dendrochronological dating following Fritts (1976), the individual tree rings were dissected from the cores. According to Treydte et al. (2007a, b), all tree rings from the same year were pooled prior to cellulose extraction for the majority of sites. For oak, however, only the latewood was used for the analyses. This procedure assumed that climate signals of the current year were predominantly applied, as the early wood of oaks frequently contains climate information of the preceding year. This is based on the fact that the proportion of the reserves of deciduous trees of the isotope network is higher at the beginning of tree-ring formation compared with the conifers of the isotope network (because they are evergreen). The isotope records have an annual temporal resolution.
The first 100 years of data from the network as well as a general description have already been published (Treydte et al., 2007a, b). Data from individual sites or regional groups of sites have also been published elsewhere (Saurer et al., 2008; Vitas, 2008; Etien et al., 2009; Hilasvuori et al., 2009; Haupt et al., 2011; Saurer et al., 2012; Rinne et al., 2013; Helama et al., 2014; Labuhn et al., 2014; Saurer et al., 2014; Labuhn et al., 2016; Andreu-Hayles et al., 2017). Here, we use the extended ISONET+ product where the longest chronologies cover a period from 1600 to 2005. The highest data density is available for the period from 1850 to 1998: a total of 26 time series available for further analysis. A total of 12 time series cover the entire period of 400 years.
2.2 Climate data
For the gridded climate information, we used the gridded fields of monthly temperature averages and monthly precipitation sums from the Climatic Research Unit (CRU TS) version 4.04 (Harris et al., 2020). Both quantities are derived from the interpolation of monthly climate anomalies from extensive networks of weather station observations. The CRU TS dataset has a spatial resolution of and covers the period from 1901 to 2019.
For the large-scale atmospheric circulation, we make use of the gridded fields of geopotential height 500 mbar (Z500) from the 20th Century Reanalysis Project (20CR) version V2c (Compo et al., 2011). The 20CR reanalysis dataset has a temporal resolution of 6 h and a meridional and zonal resolution of 2∘. In our study, the ensemble mean of 20CR was used, which was computed from 56 ensemble members. The climate variables are available for the period from 1851 to 2014, and they are provided by NOAA/OAR/ESRL PSL, Boulder, Colorado, USA (downloadable from their website: https://www.psl.noaa.gov/data/gridded/data.20thC_ReanV2c.html, last access: 2 March 2020).
As precipitation and temperature are both important for the δ18Ocel ratio, we test the relation between the isotope ratio and drought conditions at the European scale. For this purpose, the Standardized Precipitation Evapotranspiration Index dataset from Vicente-Serrano et al. (2010) is used in this study with an aggregation time of 3 months (SPEI3). The SPEI3 index is suitable for this analysis because we take the climate conditions of the preseason into account.
Furthermore, the Extended Reconstructed Sea Surface Temperature version 5 (ERSST5; Huang et al., 2017) is included in the study to investigate the correlation between the global sea surface temperature (SST) and the climate signals of δ18Ocel. The ERSST5 dataset was created by Huang et al. (2017), and it is derived from the International Comprehensive Ocean–Atmosphere Data Set. The monthly SST fields have a spatial resolution of , and they are available for the time range from 1854 to present. The gridded fields of the ERSST5 dataset are provided by NOAA/OAR/ESRL PSL, Boulder, Colorado, USA, and they can be downloaded from their website (https://www1.ncdc.noaa.gov/pub/data/cmb/ersst/v5/netcdf/, last access: 15 October 2020). All of the above-mentioned climate data were seasonally averaged: DJF (December to February), MAM (March to May), JJA (June to August), and SON (September to November). Furthermore, the linear trend from each grid cell was removed.
As our study is focused on the relation between ENSO variability and the δ18Ocel network, we also used the anomaly (1981–2010 mean removed) of the December Niño 3.4 index (HadISST1; Rayner et al., 2003). The index represents the averaged SST from 5∘ S to 5∘ N and from 170 to 120∘ W (downloadable from https://psl.noaa.gov/gcos_wgsp/Timeseries/Nino34/, last access: 3 March 2020). To compare the relation between ENSO variability and our isotope network variability (also in the past), three different reconstruction of ENSO activity have been used in this study: (i) the Dätwyler et al. (2019) reconstruction of the annual Niño 3.4 index for the last millennium (based on a multi-proxy network); (ii) the reconstruction of the NDJ (November–December–January) Niño 3.4 index for the last 700 years by Li et al. (2013) (based on a tree-ring network in the tropics and mid-latitudes), and (iii) an annual reconstruction of ENSO variability based on the North American Drought Atlas (Cook et al., 2004; Li et al., 2011).
2.3 Modelled δ18O in precipitation and soil water
In addition to the observational and reanalysis-based climate data, we also investigate the relation between δ18Ocel and δ18OPandbetweenδ18Ocelandδ18OSW, as simulated by the water-isotope-enabled ECHAM5-wiso model (Werner et al., 2011), in order to gain further insights into the correlation with other seasons and to identify a multi-seasonal climate signal. The dataset was created by Butzin et al. (2014), who used the isotope-enabled version of the ECHAM5 atmospheric general circulation model (Roeckner et al., 2003; Hagemann et al., 2006; Roeckner et al., 2006) which is called ECHAM5-wiso (Werner et al., 2011). In Butzin et al. (2014), values of present-day insolation and greenhouse gas concentrations (Intergovernmental Panel on Climate Change, 2000) and monthly varying fields of sea surface temperatures and sea ice concentrations according to ERA-40 and ERA-Interim reanalysis data (Uppala et al., 2005; Berrisford et al., 2011; Dee et al., 2011) are used to force the model. To represent the climate conditions of the period from 1960 to 2010, Butzin et al. (2014) used an implicit nudging technique (Krishnamurti et al., 1991; the implementation in ECHAM is described by Rast et al., 2013). The nudging technique is a part of climate modelling sciences, where modelled fields of climate variables are relaxed to observations or data from reanalyses. In the study of Butzin et al. (2014), the modelled fields of surface pressure, temperature, divergence, and vorticity are coupled to ERA-40 and ERA-Interim reanalysis fields (Uppala et al., 2005; Berrisford et al., 2011; Dee et al., 2011) for the period from 1960 to 2010. The monthly grids of have a horizontal grid size of approximately . As our study is focused on seasonal variability, we have computed the seasonal averages for (DJF, MAM, JJA, and SON).
2.4 Data analysis
As a first step, the characteristics of each time series of the δ18Ocel network and their relation to altitude and latitude are investigated. For a better comparison, the linear trend of each δ18Ocel time series is removed and the time series are standardized (z values).
To combine the signals of the isotope network, we use principal component analysis (PCA) and empirical orthogonal functions (EOFs). These techniques have been described by Pearson (1902) and Hotelling (1935) and were used for the first time by Lorenz (1956) for climatological studies (Storch and Zwiers, 1999). By applying PCA, it is possible to extract a common climate signal from the δ18Ocel network that explains the highest part of the variability of the input dataset. This is done by rotating the initial data onto axes that are orthogonal to each other (Schönwiese, 2013) by the corresponding eigenvectors. Therefore, the eigenvectors are used as a transformation matrix. The corresponding analysis of the eigenvector values is known as empirical orthogonal function (EOF) analysis. The goal of this analysis is to identify the most dominant patterns of the δ18Ocel tree network variability, which explain a significant part of the variance for a specific region. The largest part of the variance can be explained by the pattern of the leading EOF. The temporal perspective on these patterns is given by the principal components (PCs), which describe the phase and the amplitude.
The resulting components are further checked to establish if they fulfil the requirements of the rule of North et al. (1982). This rule states that the pattern of the eigenvectors of one component is strongly contaminated by other EOFs that correspond to the closest eigenvalues (Storch and Zwiers, 1999). To determine whether two consecutive patterns can be interpreted as distinct patterns, it is necessary to calculate the standard error in the estimation of the eigenvalues; according to North et al. (1982), this is approximately
where λ is the eigenvalue, and n is the number of degrees of freedom of the dataset. In case that the eigenvalues of two EOFs are not more separated from each other than this standard error, it is unlikely that the two consecutive patterns can be interpreted as distinct from each other, as any linear combination of the two eigenvectors is equally significant. In our study, we only consider the eigenvectors where the successive eigenvalues are distinguishable.
The ISONET network consists of a multi-site and multi-species tree-ring network more or less covering the period from 1600 to 2003. However, some tree-ring series cover the whole period, whereas other series cover only a shorter period. In order to be able to have a long-term perspective, one needs to find a statistically meaningful way to extend the shorter records to make use of the whole 400 years of data. As most multilinear principal component analysis algorithms do not work with gaps in the initial matrix, we make use of an algorithm developed by Josse and Husson (2016) that is able to fill the temporal gaps without a change in the PC. In the first step, we place the mean in the gap and execute a PCA with this dataset. Afterwards, the dataset is projected onto the new component axis so that the values are rotated and the value of the gap changes. The new value of the gap is placed into the initial dataset. With this new dataset, a PCA is again carried out. This process is repeated until convergence is reached. The result is a gap-free dataset that can be used for PCA. To quantify if our results are influenced by the gap-filling method, we tested the correlation between PC1 based on the ISONET network and the first four PCs of the Old World Drought Atlas (OWDA; Cook et al., 2015) for the period from 1850 to 2005 and from 1600 to 2005. If the filling algorithm altered the representation of climate signals over a longer time period, we would expect that the strength of correlation is changing.
Composite maps of average precipitation, air temperature, geopotential height 500 mbar (Z500), and SST are computed using years where the network's principal components are above or below a certain threshold. In our study, we choose maxima events above () and minima events below () 1 standard deviation (σ) with respect to the mean (μ). The composite maps allow us to analyse the general climate state occurring at times of minima (low) or maxima (high) separately. In addition, both composites of climate conditions can be combined under the assumption that the minima and maxima events show the opposite climate state. For this purpose, the minimum composite is subtracted from the maximum composite at each grid point (high−low). In addition to the composite maps, we extract the values of PC1 for those years for which ENSO values are higher than the average plus 1 standard deviation and lower than the average minus 1 standard deviation. The difference from the former distribution for the values of minima and maxima years is tested with a t test. To better understand if El Niño or La Niña events co-evolve with extremes in the δ18Ocel time series, event coincidence analysis (ECA) (Donges et al., 2016; Siegmund et al., 2017) using PC1 and a December Niño 3.4 index is applied (HadISST1; Rayner et al., 2003). ECA quantifies the simultaneity of events contained in two series of observations that can be computed with the “CoinCalc” R package (Siegmund et al., 2017). Furthermore, the CoinCalc package provides functions to test if the coincidences are significant. In our study, we analyse whether the years in which the Niño 3.4 index is above (below) the 75th (25th) percentile match the 75th (25th) percentile in PC1. In general, a significance level of α=0.05 was used in all analyses.
Finally, we analyse the relation between seasonally averaged δ18OP and δ18OSW from winter, spring, and summer, based on nudged ECHAM5-wiso simulations (Butzin et al., 2014), with PC1 based on the δ18Ocel values from the ISONET network. Our goal is to test the correlation between δ18Ocel and modelled to identify if the water, which is used within the photosynthesis processes, has a multi-seasonal isotopic signature.
3.1 Characteristics of the δ18Ocel network
The highest mean δ18Ocel values occur in the southern locations (i.e. in Turkey and Cazorla in Spain). For oaks and pines, the lowest mean values are found for the northern sites (Fig. 2a). Moreover, generally lower δ18Ocel values are identified for Quercus compared with Pinus. Angiosperm wood tissue contains vessels (i.e. specialized water-conducting cells) that are generally larger in diameter and, therefore, more conductive to water than conifer wood cells (Sperry et al., 2006; Carnicer et al., 2013). The overall variance in the datasets is not dependent on the type of tree species. The δ18Ocel time series from Pöllau in Austria is characterized by the highest standard deviation, whereas the time series from Lochwood in Great Britain shows the lowest standard deviation.

Figure 2The characteristics of the European δ18O time series/network. Panel (a) describes each time series using boxplots, which are firstly arranged by tree type and secondly by the average value. Additionally, the relation between the average value of each time series is plotted against their latitudinal (b) and their altitudinal position (c).
As the δ18O source values and the fractionation processes are temperature dependent, it is necessary to evaluate the influence of altitude and latitude on the oxygen isotope ratio. The relation of the δ18Ocel values with respect to the altitude and latitude of each site is shown in Fig. 2b and c respectively. In Fig. 2c, the linear relationship between the average δ18Ocel values of the locations and the corresponding latitudes are plotted. As shown by the boxplots in Fig. 2a, the southern sample sites are characterized by the highest average δ18Ocel values, whereas the northern sites show the lowest average δ18Ocel values. The relation between the δ18Ocel values and latitude yields a significant linear regression.
In addition to the latitudinal effect, altitude also influences the oxygen isotope ratios (as shown in Fig. 2b) which can likewise be described by a significant linear regression. It should be noted that the southern sites are found at higher altitudes than the northern sites; thus, the latitudinal and altitudinal gradients may have confounding effects on δ18Ocel. Therefore, we show that the δ18Ocel network is influenced by a latitudinal and an altitudinal effect.
3.2 Characteristics of the principal components
Based on the EOF analysis, the first component of the isotope network explains 16.2 % of the variance, the second explains 9.1 %, the third explains 6.4 %, the fourth explains 5.5 %, and the fifth explains 5.2 %. Therefore, the first five components explain a cumulative variability of around 43 %. As the first two components also fulfilled the requirements of the rule of North et al. (1982), they are investigated with respect to their temporal and spatial characteristics.
The dominant pattern (EOF1), which describes 16.2 % of the total variance, shows a spatially homogeneous structure (Fig. 3a). The majority of time series in Europe are characterized by negative eigenvector values. The pole of this EOF pattern is centred over France and Germany. In contrast, tree sites close to the Mediterranean Sea and the northernmost site in Finland are characterized by eigenvector values close to zero. Therefore, these locations contribute to a lesser extent to the first component's time series (PC1) shown in Fig. 3c. The time series of PC1 is characterized by an underlying negative trend from the 17th to the 18th century. From the beginning of the 18th century, a positive trend is observed until the beginning of the 19th century, where the highest values are reached. For the last 150 years, no clear trend is visible.
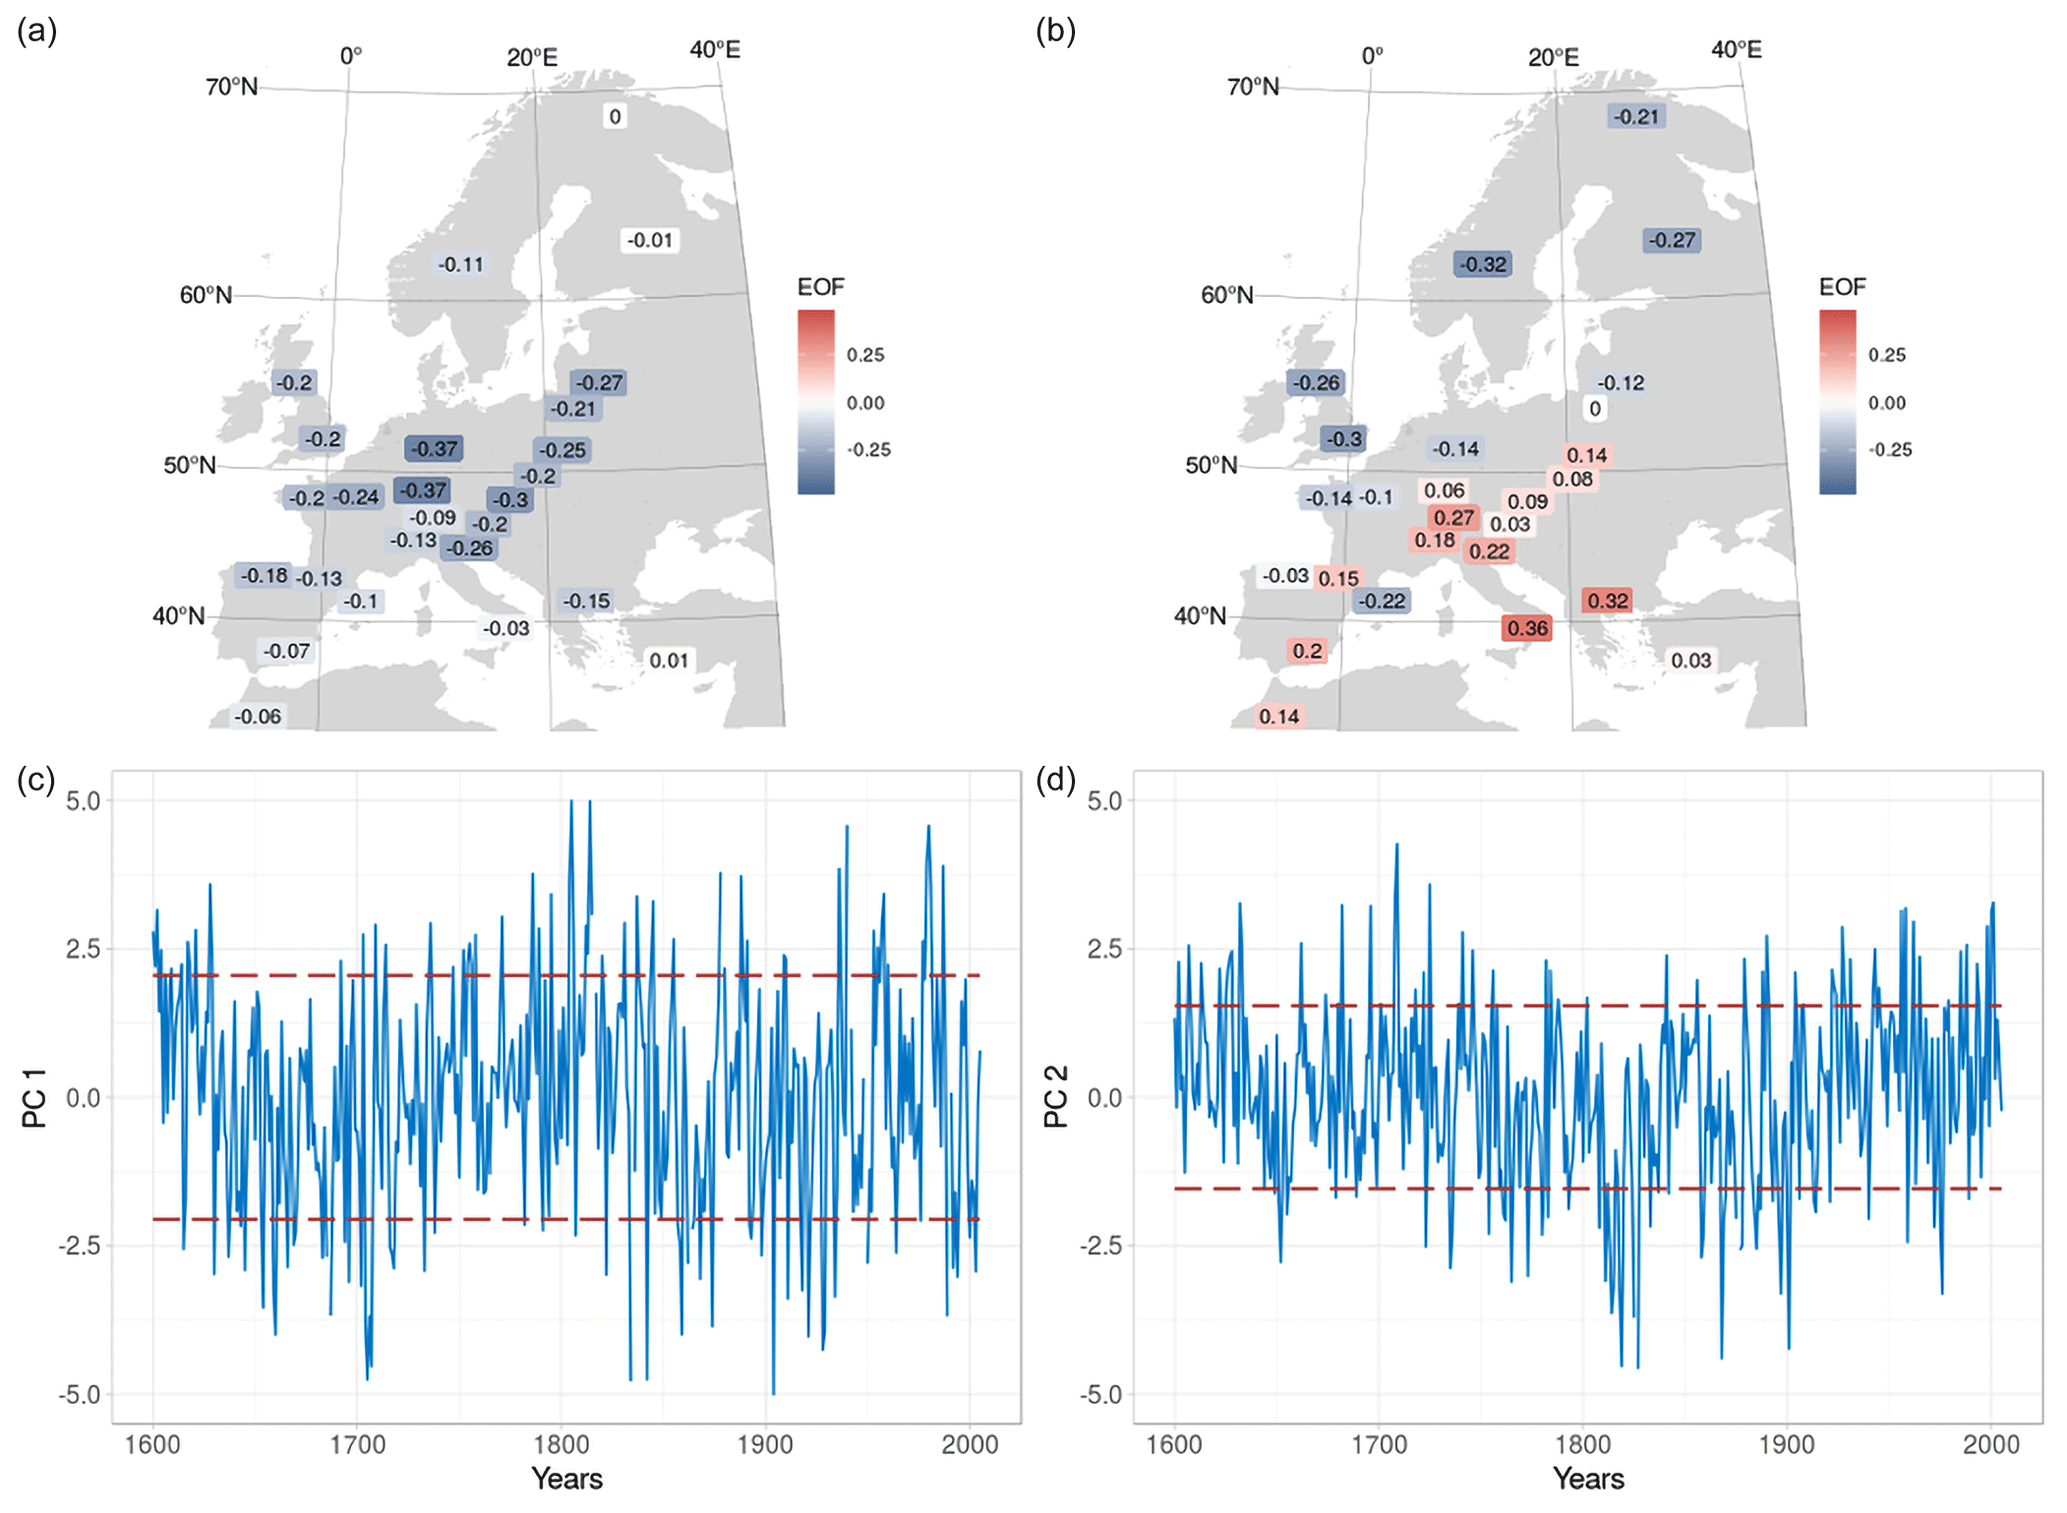
Figure 3Spatial and temporal variability of the first two δ18O components and EOFs: (a) EOF for the first δ18O component (16.2 % explained variance); (b) EOF for the second δ18O component (9.5 % explained variance). Panels (c) and (d) show the time series for the first and second δ18O components. The dashed red lines indicate the standard deviation for the years 1600–2005.
The second EOF (EOF2) is characterized by a completely different spatial pattern (Fig. 3b). Negative eigenvector values are found around the North and Baltic Sea, with the smallest eigenvector located in Norway, while positive eigenvector values are identified over the southern/southeastern Europe and the Alpine region. The highest eigenvector values are recorded for the Italian site. In summary, this component highlights a dipole-like structure between northern and southern/southeastern Europe. This dipole-like structure is a well-known feature of the European hydroclimate (Ionita et al., 2015). The time series of the second component (PC2) is characterized by an underlying positive trend from the middle of the 19th century onwards. Furthermore, the highest interannual variability is found for the beginning of the 18th and 19th centuries. The highest values of the second component (PC2) are reached at the beginning of the 18th century, whereas the smallest values are identified for the beginning of the 19th century (Fig. 3d).
Furthermore, we tested the correlation between PC1 and the first four PCs for the summer drought reconstruction based on the Old World Drought Atlas (OWDA; Cook et al., 2015) for the period from 1850 to 2005, where we have the highest sample density. The highest correlation (R=0.43, p value ) is computed with PC2 of the OWDA (EOF plot and time series are shown in Fig. S1 in the Supplement), which explains 16.1 % of the total variance of the OWDA. If the filling algorithm altered the representation of climate signals over a longer time period, we would expect that the strength of the correlation would also change. However, the correlation changes only slightly to a Pearson's R=0.39 (p value ) for the entire period from 1600 to 2005, which indicates that the filling algorithm does not impact the results. As a result, the climate signals obtained are robust and are presented in a similar manner as those for the period with a high sample coverage (i.e. 1850–2005). This argument is also supported by the comparison of the two time series in Fig. S1. We note that, when using the gap-filling method, uncertainties might arise for the first century where the sample density is low. It is, therefore, important to mention that the interpretation for the first century needs to be handled with care, and statements should be regarded as less robust.
3.3 Climate signals of PC1
For the winter season, high values of PC1 are associated with significant warm SSTs in the equatorial Pacific and on the west coast of North and South America (Fig. 4a), which indicates that the high values of PC1 are co-evolving with the occurrence of the El Niño conditions. The strong signal in the Pacific persists throughout spring (Fig. 4c) and reduces in summer (Fig. 4e). A significant warming of the tropical and North Atlantic is visible in spring and summer (Fig. 4c, e). According to Latif and Grötzner (2000), the lagged warming of the equatorial Atlantic can be observed up to 6 months after an El Niño event. In contrast, the northeastern Atlantic and the Mediterranean Sea are characterized by significantly colder SSTs in all three seasons. The low composite maps for PC1 and SST (Fig. 4b, d, f) show features of La Niña conditions associated with colder than average SSTs. This pattern is particularly prominent in the tropical Pacific during winter and spring.
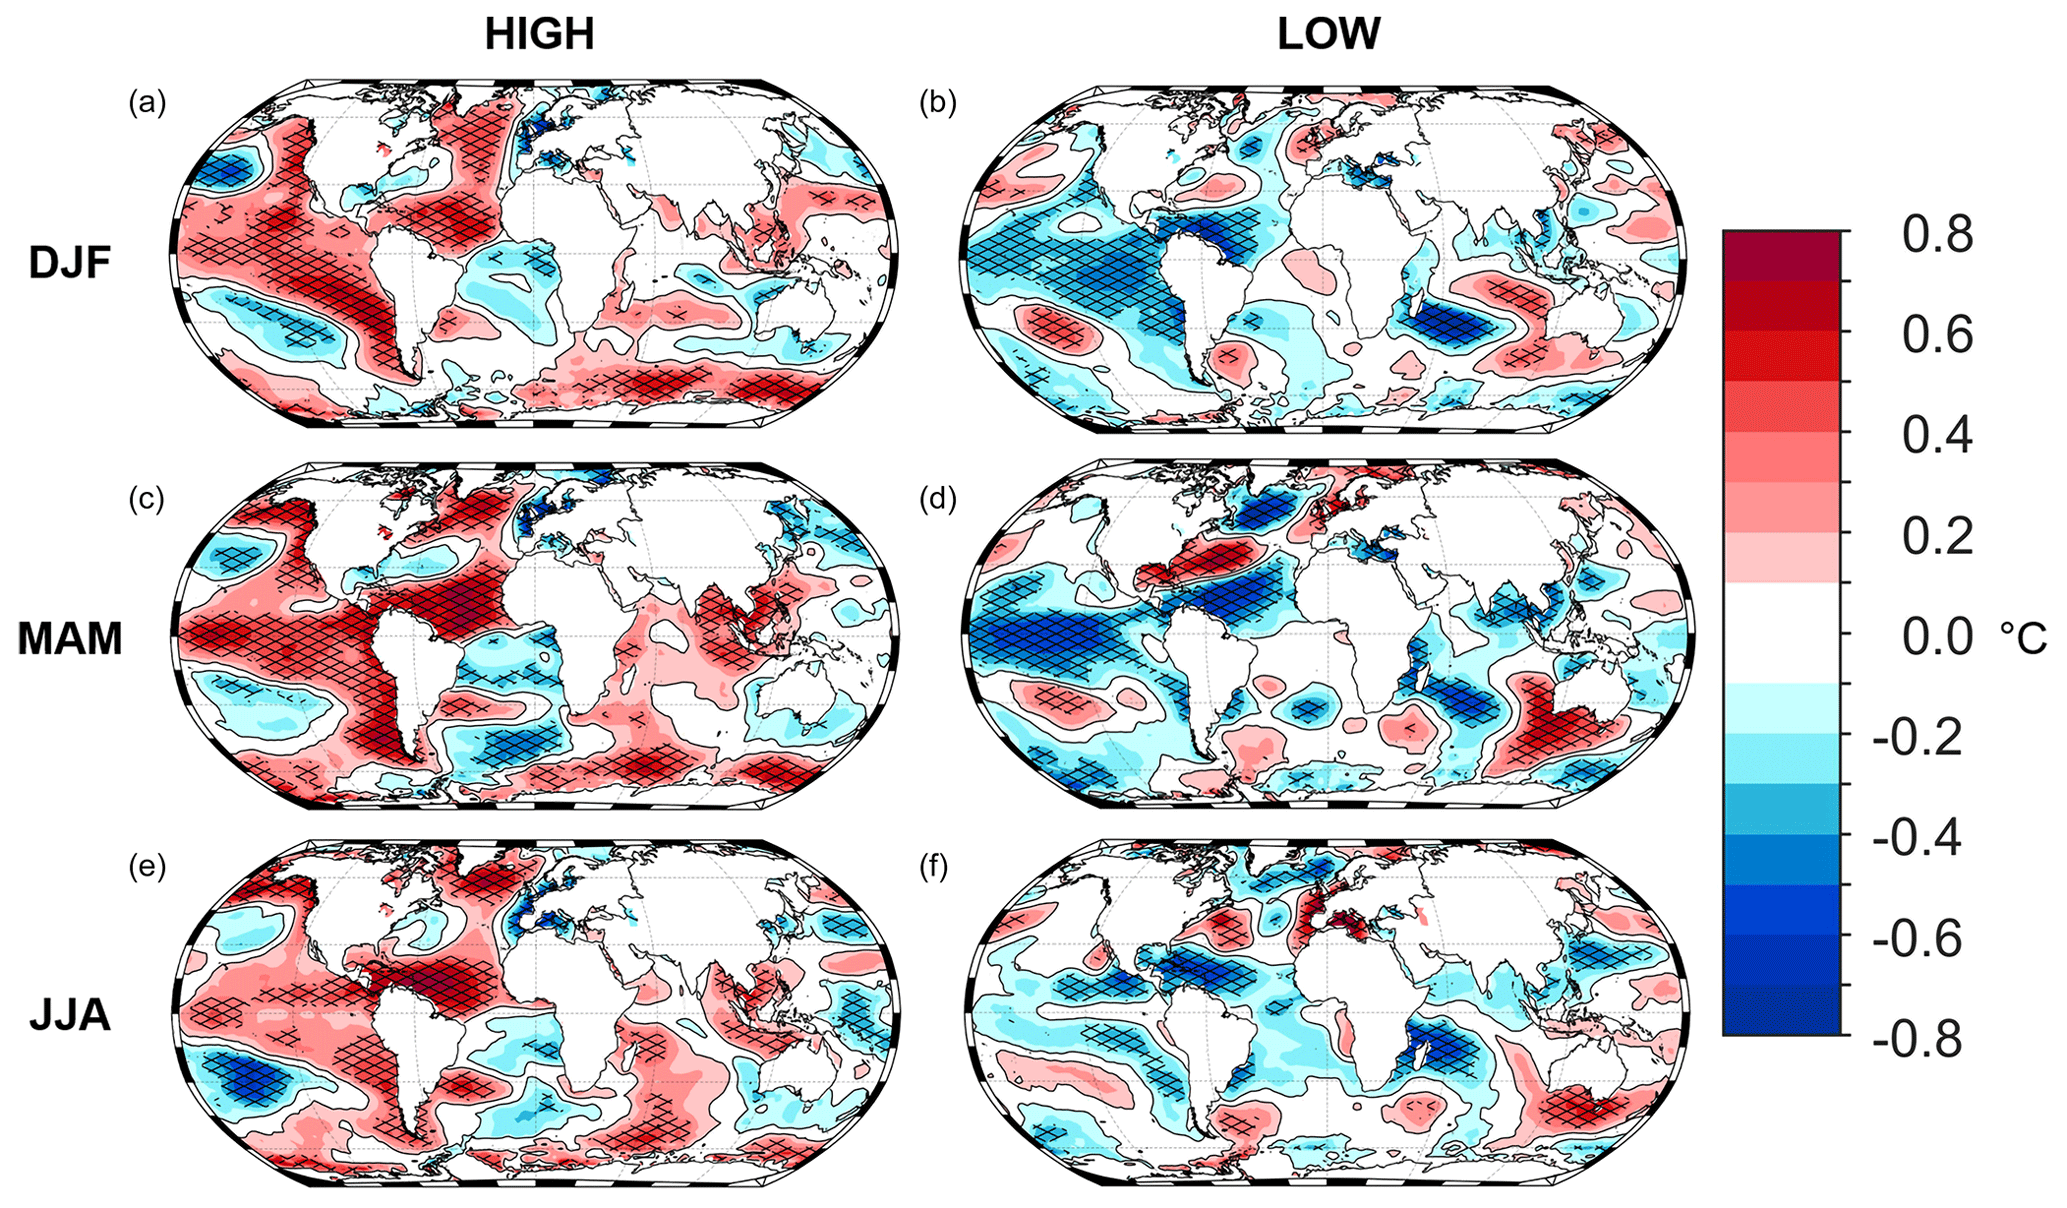
Figure 4Composite maps (high and low) of SSTs related to the first δ18O component for the DJF, MAM, and JJA seasons. Panels (a) and (b) show the characteristics of the climate in DJF, panels (c) and (d) show the characteristics of the climate in MAM, and panels (e) and (f) show the characteristics of the climate in JJA. The results for maxima (a, c, e) and minima (b, d, f) events of PC1 are also given. The SSTs in winter, spring, and summer are characterized by ENSO activity. Furthermore, the significance is shown using a black grid overlay. The SST dataset from ERSST (Huang et al., 2017) is included in this figure for the period from 1854 to 2005.
The related large-scale atmospheric circulation is shown in the composite map of Z500 (Fig. 5). During high values of PC1 which are co-evolving with the occurrence of El Niño conditions, the atmospheric circulation over Europe is characterized by a low-pressure regime in winter, whereas high-pressure regimes can be identified over the northwestern Atlantic as well as east of the low-pressure system (Fig. 5a). This fits well with the composite map of air temperature in Fig. 6b which shows significant cold conditions over northern Europe and significant warm conditions over southeastern Europe. The described temperature pattern shows similarities to the effects of a negative phase of the winter NAO. The opposite climate state can be observed for low values of PC1 in winter (Figs. 5b, 6b).
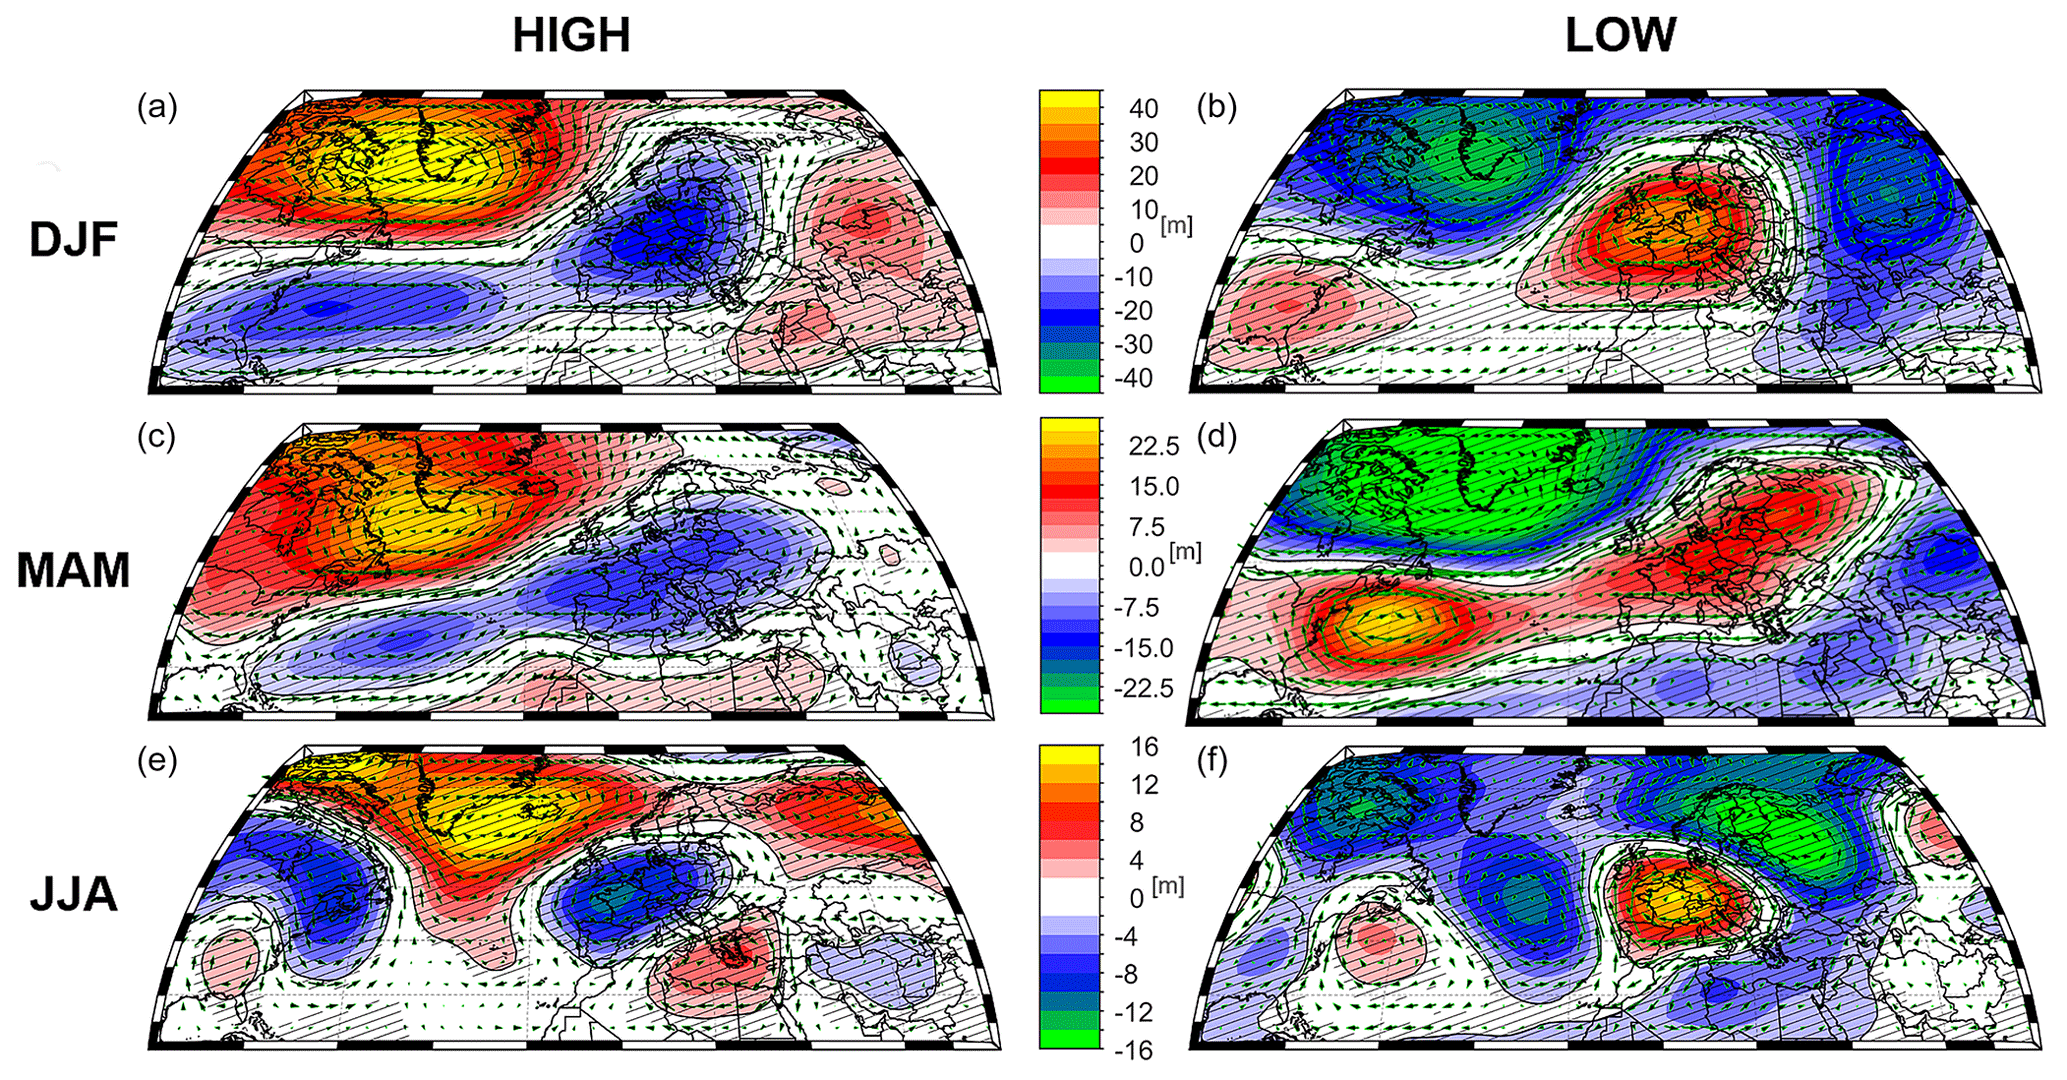
Figure 5Composite maps (high and low) for Z500 related to the first δ18O component for the DJF, MAM, and JJA seasons. Panels (a) and (b) show the characteristics of the climate in DJF, panels (c) and (d) show the characteristics of the climate in MAM, and panels (e) and (f) show the characteristics of the climate in JJA. The results for maxima (a, c, e) and minima (b, d, f) events of PC1 are also given. The Z500 maps show similar characteristics in winter and spring, whereas a pressure regime is directly located over central Europe in summer. The Z500 dataset from 20CRv2c (Compo et al., 2011) is used in this figure for the period from 1901 to 2005. Furthermore, the significance is shown using a black contour line.
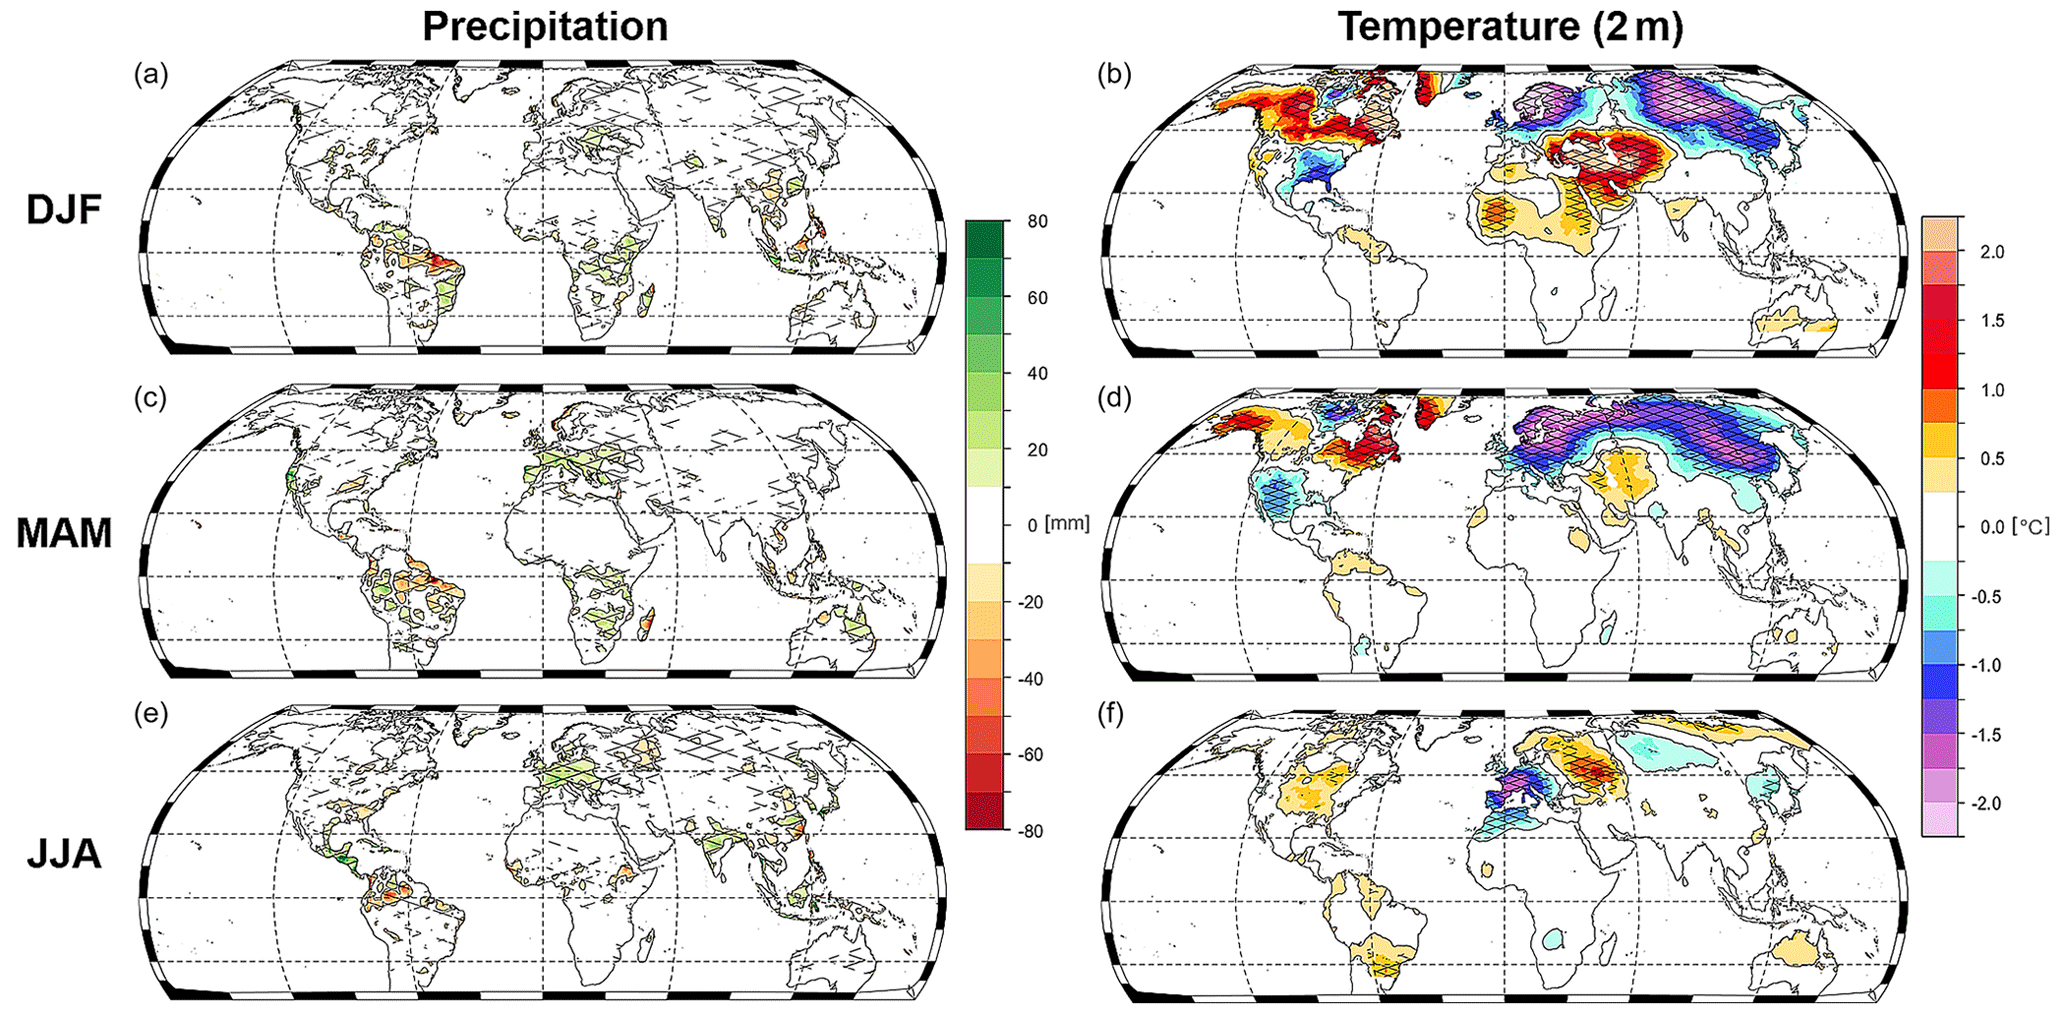
Figure 6Composite maps (high−low) for precipitation and air temperature related to the first δ18O component for the DJF, MAM, and JJA seasons. Panels (a) and (b) show the characteristics of the climate in DJF, panels (c) and (d) show the characteristics of the climate in MAM, and panels (e) and (f) show the characteristics of the climate in JJA. The results for precipitation (a, c, e) and air temperature (b, d, f) are also given. The precipitation and air temperature dataset from CRU TS is included in this figure for the period from 1901 to 2005. The significance is shown using a black grid overlay.
The atmospheric circulation remains in a similar configuration over Europe and the North Atlantic for low and high composite maps for spring (Fig. 5c, d) compared with the winter season (Fig. 5a, b). One important difference from the preseason is that a pressure belt is visible between Europe and the Gulf of Maine in both maps.
The composite maps of Z500 for summer are characterized by a pressure regime centred over France and Germany (Fig. 5e, f). In both maps, it is visible that the low-/high-pressure regime in central and western Europe is surrounded by opposite pressure regimes. In case of a high-pressure system in the centre, it leads to a blocked zonal flow which is shown in Europe in Fig. 5f. The composite maps of precipitation and temperature also support the analysis with the Z500 data. The climate of central and western Europe is characterized by significantly higher (lower) precipitation in central Europe as well as significantly lower (higher) surface air temperatures in summer corresponding to low (high) δ18Ocel values. The significant relation between PC1 and the summer hydroclimate is also resampled by the correlation between the SPEI3 index for JJA (Vicente-Serrano et al., 2010; longitude from −5 to 10∘ and latitude from 46 to 52∘) and PC1. The correlation is significant (R=0.49; p<0.01) for the period from 1901 to 2005 which suggests that PC1 can capture the hydroclimate variability in summer.
To further investigate the relation between ENSO variability and the PC1, we apply two different statistical approaches. The first approach is to analyse if El Niño and La Niña events are separated in the probability density plots of PC1. During El Niño years, the distribution of PC1 is shifted towards higher values, whereas the opposite occurs during La Niña years (see the Supplement; Fig. S2). According to a t test, both shifts are significantly different compared with the distribution of PC1 (p<0.05). The second statistical approach investigates if extremes in δ18Ocel time series co-occur with El Niño or La Niña events. For this purpose, we apply event coincidence analysis (Siegmund et al., 2017; Donges et al., 2016) using PC1 and the December Niño 3.4 index (HadISST1; Rayner et al., 2003). Over the period from 1871 to 2005, 41.2 % of high and low extremes in the Niño 3.4 index coincided significantly during winter, with high and low extremes of PC1 (p<0.01). By extending the analysis period from 1750 to 1850, coincidence rates (28 % of the NDJ Niño 3.4 (Li et al., 2013) high and low extremes coincided (not significantly; p>0.1) during winter with high and low extremes of PC1) and the correlations (Fig. S2) between PC1 and ENSO reconstructions Dätwyler et al. (2019) and Li et al. (2011, 2013) are shown to weaken.
3.4 Comparison of δ18Ocel with modelled δ18O in precipitation and soil water
By employing nudged climate simulations with ECHAM5-wiso (Butzin et al., 2014), we evaluate how the δ18Ocel tree signature is related to the modelled δ18O in precipitation and soil water. A significant correlation between PC1 and the modelled δ18OP is shown in the correlation maps for winter, spring, and summer, where central Europe is characterized by a moderate correlation (Fig. 7a–c). A similar pattern can be identified for the correlation between δ18OSW and PC1. Compared with our previous analysis, the correlation between these quantities increases from winter to summer where it reaches the maximum correlation (Fig. 7g). As the δ18Ocel ratio is largely dependent on δ18OSW, the relation with δ18OSW is stronger compared with δ18OP. Overall, the results from Fig. 5 indicate that significant correlations for both quantities can be computed for the entire European region except for the eastern parts.
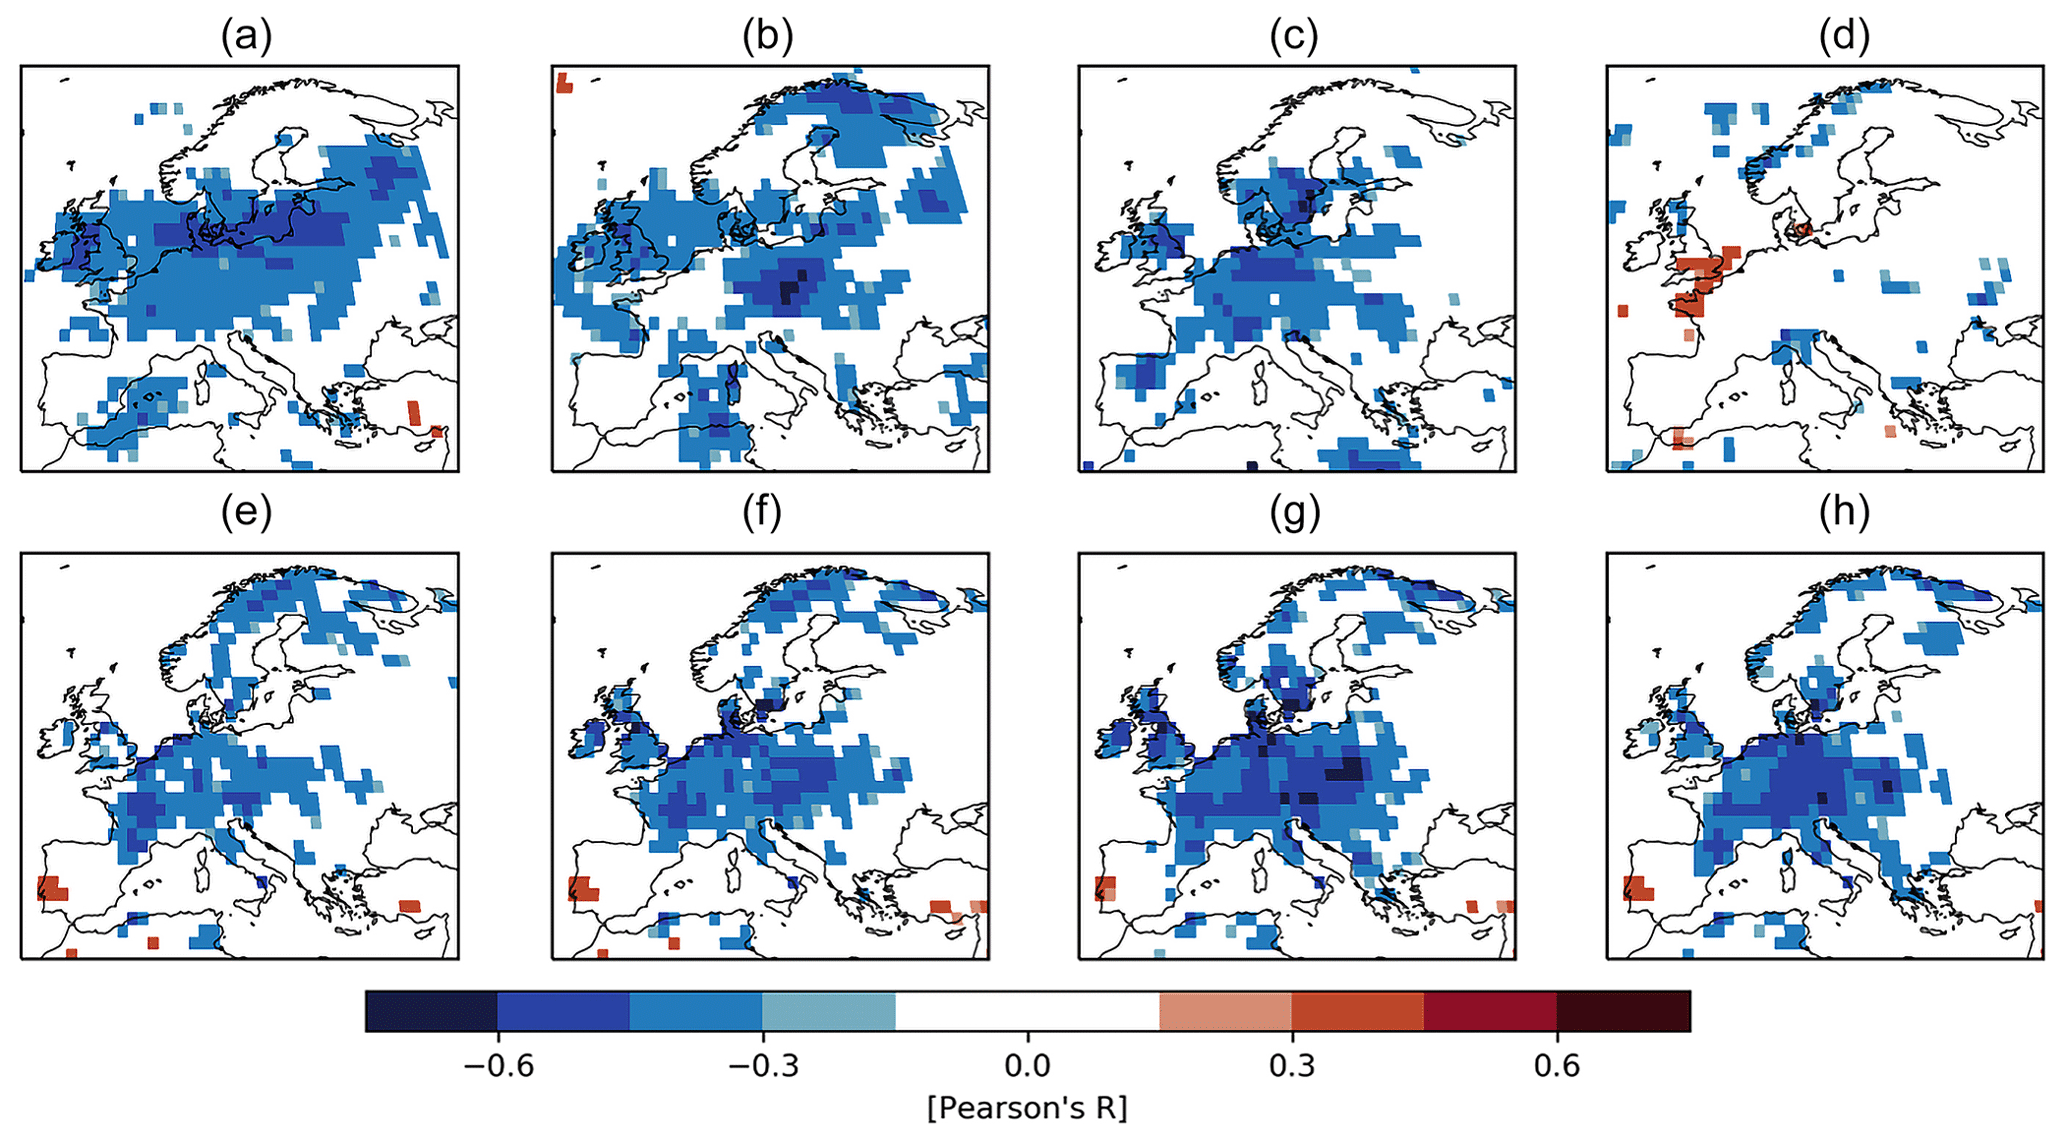
Figure 7Links between the first δ18O component and the modelled δ18O in soil water and precipitation from nudged climate simulations with ECHAM5-wiso (Butzin et al., 2014). Panels (a–d) show the correlation between the first δ18O component (PC1) and δ18O in precipitation for winter (a), spring (b), summer (c), and autumn (d). Panels (e–h) are the correlation maps for PC1 and δ18O in soil water for winter, spring, summer, and autumn. For all maps, the significant grid cells are coloured.
3.5 Further climate signals in δ18Ocel
In addition to the multi-seasonal signal, the second component of the δ18Ocel values significantly relates to the summer climate (Figs. 8, 9). A positive (negative) geopotential height anomaly in northern Europe with its centre over the North Sea co-occurs with a negative (positive) Z500 anomaly in southeastern Europe (Fig. 9). This coincides with low (high) temperature in central and north Europe, whereas northeastern Europe is characterized by high (low) temperature (Fig. 8a). The same pattern is also shown in the composite maps for precipitation where a similar pattern is presented (Fig. 8b). Based on these patterns, the temporal distribution of extremes in the PC2 time series indicates that the 19th century has experienced increased dryness in northern Europe and enhanced precipitation in the Adriatic region (Fig. 3d).
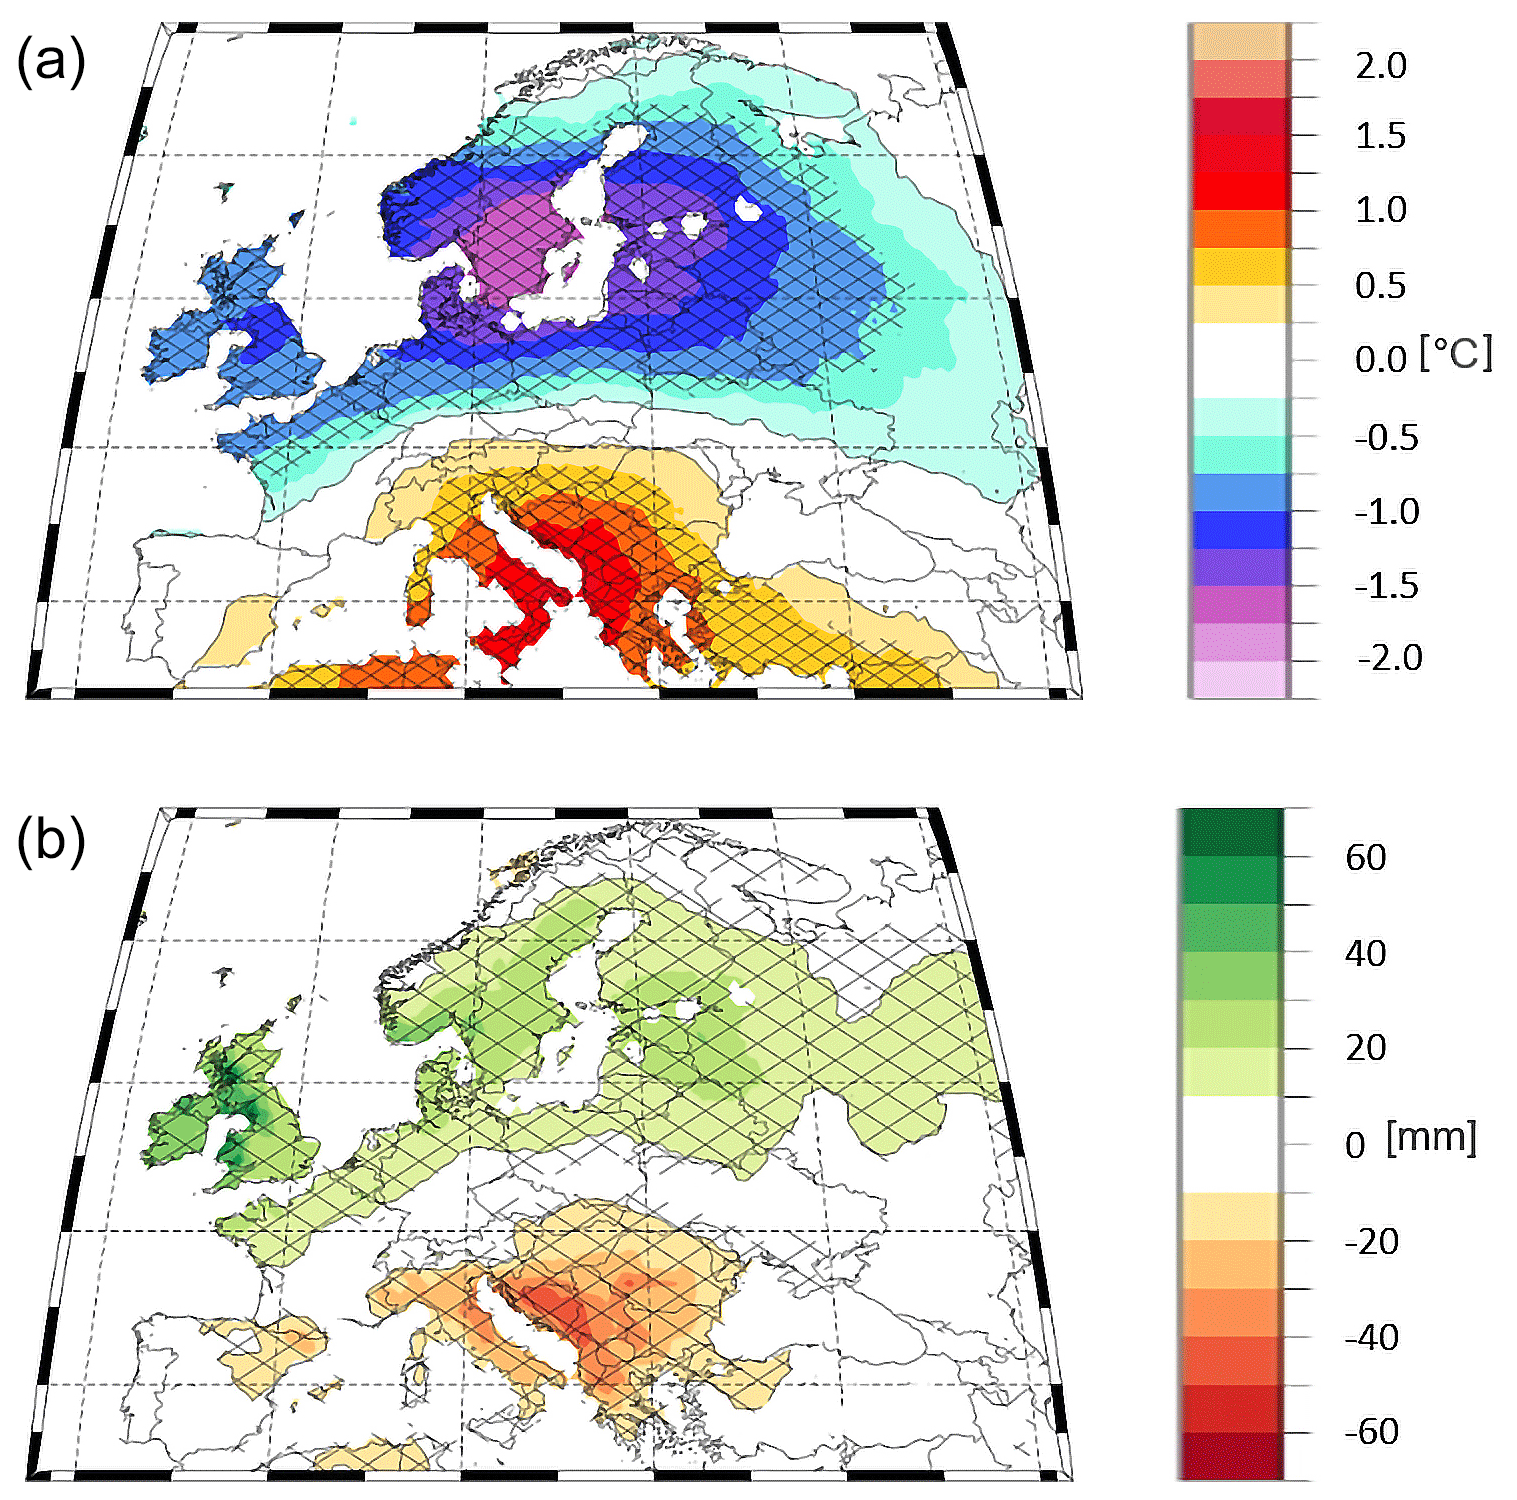
Figure 8Composite maps (high−low) for the boreal summer related to the second δ18O component: (a) surface temperature, JJA; (b) precipitation JJA. The datasets are the same as in Fig. 6. Furthermore, the significance is shown using a black grid overlay.
4.1 Latitudinal and altitudinal dependence of the δ18Ocel network
The δ18Ocel ratio is affected by the isotopic composition of the source water (δ18OP, δ18OSW), which varies according to the latitude and altitude of the sample site (e.g. McCarroll and Loader, 2004). The latitudinal position has an influence on the δ18O in the atmosphere because of the strong correlation between the temperature and the δ18O composition of water vapour in the atmosphere (Dansgaard, 1964). In addition, Dansgaard (1964) suggested that the altitude also influences the δ18O ratio, primarily due to the cooling of air masses as they ascend a mountain which is accompanied by the rainout of the excess moisture (Gat, 2010).
The results from this study show that there is a linear relationship between δ18Ocel and site altitude (Fig. 2b) and latitude (Fig. 2c), which re-enforces the commonly inferred effects of latitude and altitude on the δ18Ocel (McCarroll and Loader, 2004). Therefore, our results are in line with other studies that have presented such results in the past, e.g. Szejner et al. (2016).
The effects of altitude and latitude on the photosynthesis process are also visible for other tree-ring-based proxies. For example, according to the studies of Körner et al. (1991), Marshall and Zhang (1994), and Dietendorf et al. (2010), there is a highly significant altitude effect on the tree carbon isotope composition (δ13C). As temperature decreases with increasing altitude and the partial air pressure is approximately 21 % lower at 2000 m than at sea level, Körner (2007) argued that these environmental conditions lead to a faster molecular gas diffusion at any given temperature.
However, the distribution of our sample sites across Europe indicate that the isotope network is spatially limited (Fig. 1). For instance, the time series from central and western Europe are overrepresented compared with those from southeastern and northern Europe. In addition, it is imperative to extend the isotope network by collecting more δ18Ocel records from eastern Europe to improve the validity of our results for this region. Furthermore, the samples were not taken from trees growing at the same altitude, which is critical for identifying a latitudinal effect. In fact, the sampled trees in southern Europe grew at higher altitudes (≥1600 m) compared with the other sample sites, which could also bias the δ18Ocel ratio. It is, therefore, not viable to compare two adjacent sites located at different altitudes, and it is challenging to distinguish between latitudinal and altitudinal effects.
Another point that needs to be considered is that the δ18O time series used in this study were created using a pooling approach. Overall, the pooling approach has been tested and proven successful for climate analysis (Treydte et al., 2007b), but the approach also has some weaknesses and is strongly discussed in the literature (e.g. Foroozan et al., 2019). For example, Hangartner et al. (2012) recommend avoiding pooling, as an unsuitable tree cannot be omitted without resampling the whole period. They suggest measuring the trees individually instead and only using pooling when there is a strong correlation between the trees. Nevertheless, the pooling approach was adopted for all of the ISONET sites, allowing, for the first time, for the establishment of a tree-ring stable isotope network of more than 20 sites across Europe in collaboration with several laboratories within a reasonable time frame. Without pooling, the spatial dataset, analysis, and interpretation presented here would not be available to the community.
4.2 Links between ENSO and PC1
The results presented in Sect. 3.3 are an indicator that ENSO activity influences the climate signal of PC1. The reason for this is the described warm and cold SST patterns in the equatorial Pacific and on the west coast of North and South America which are associated with El Niño and La Niña events (Allan et al., 1996). Furthermore, the clear and significant separation between El Niño and La Niña events in probability density functions and the coincidence of high and low values of Niño 3.4 and PC1 support our argumentation.
Moreover, the temperature pattern described in Fig. 6b resembles the effects of the winter NAO (Fig. 6b). During the negative phase of the NAO, northern Europe experiences cold conditions and southeastern Europe experiences warm conditions in winter. Studies based on observations (Fraedrich and Müller, 1992; Fraedrich, 1994; Brönnimann et al., 2004; Pozo-Vázquez et al., 2005; Brönnimann et al., 2007) and models (Merkel and Latif, 2002; Mathieu et al., 2004) have shown that ENSO variability can influence the winter NAO. Their results showed that an El Niño event leads to a negative phase of the NAO. Based on our argument, we suggest that high values of PC1 co-evolve with the occurrence of El Niño conditions, and low values of PC1 co-evolve with the occurrence of La Niña conditions.
4.3 The stability of the ENSO signal in the isotope network
In our study, we test the correlation between ENSO and the PC1 of the δ18Ocel network with three different reconstructions (Li et al., 2011, 2013; Dätwyler et al., 2019) and for two different time periods (1750–1849, 1850–1949), as shown in Table S2. Despite the fact that the sample density of the isotope network is relatively high in these two periods, the correlation between the PC1 and the ENSO reconstructions is weaker and non-significant for the period from 1750 to 1849. However, not only does the correlation get weaker, the correlation between a set of different ENSO reconstructions also becomes weaker in the 18th century, which was shown for specific periods in Dätwyler et al. (2019). Dätwyler et al. (2019) also found a consistent teleconnection pattern during the 18th century, which is different to the known teleconnection pattern of ENSO during the instrumental period. Moreover, the 1850s mark the end of Little Ice Age (LIA), when the atmospheric circulation over Europe (Felis et al., 2018) and its teleconnections to ENSO changed significantly (Rimbu et al., 2003). In their study, Felis et al. (2018) found evidence of an abrupt reorganization of the atmospheric circulation over Europe at the end of the LIA, transitioning from predominantly negative phases of the NAO (weakening of westerly winds) to predominantly westerly flow patterns over central Europe. Furthermore, modelling studies (e.g. Henke et al., 2017) have also reported an increased frequency of El Niño during the LIA due to southern displacement of the Intertropical Convergence Zone.
A change in the ENSO characteristics would also have an influence on the teleconnection with the European climate. For instance, Rimbu et al. (2003) investigated coral time series from the northern Red Sea and identified a nonstationary relationship between the tropical Pacific and the European–Middle Eastern climate during the pre-instrumental period (see also Fig. S3). They showed that a Pacific–North-American-teleconnection-like pattern in its negative phase, which is compatible with La Niña conditions, is associated with positive δ18O anomalies in the Red Sea coral record from the mid-1930s to late 1960s. After 1970, they detected a shift in the teleconnections that leads to the fact that positive anomalies in the Red Sea coral δ18O are related to El Niño conditions. An unstable relationship between ENSO variability and the climate of Europe is also found in studies based on instrumental data (e.g. Fraedrich and Müller, 1992; Fraedrich, 1994; Pozo-Vázquez et al., 2005) or ocean–atmosphere coupled models (e.g. Raible et al., 2004; Deser et al., 2006; Brönnimann, 2007). The temporally unstable relationship between climate variables and ENSO is not only restricted to Europe and is also present in other regions of the planet (e.g. Álvarez et al., 2015).
Weak or inconclusive correlations between PC1 and ENSO reconstructions could also arise from the fact that the quality of the ENSO reconstructions decreases, which could be based on an overly low number of samples (especially in first years of the reconstruction period) and a non-stationarity of the teleconnection used (Batehup et al., 2015). Furthermore, ENSO reconstructions are mostly trained within the last 150 years and are used for time periods characterized by an absence of instrumental data. Therefore, confident statements can only be made from 1850 onwards, as instrumental measurements of different climate variables are available. Thus, the only possibility to test and analyse the teleconnection before 1850 is to use ENSO reconstructions.
Another reason for the decrease in correlation could be the change in the climate signal of δ18Ocel. It is important to consider that the climate signal is directly coupled to the limiting factor for tree growth. It is possible that the limiting factor changes over time, which would result in different responses to climate. Esper et al. (2017) showed that the climate signals in δ18Ocel and δ13Ccel change during warm and cold periods for trees in Switzerland, and they proposed splitting the calibration between these two periods or using corresponding transfer models. Therefore, future research is required to investigate the climate signal during warm and cold periods, as well as the influence on our PCA results. However, we can only suggest that the relationship between ENSO and the European climate may not be stable over time.
4.4 The winter climate signal in δ18Ocel
The exact mechanism through which the δ18Ocel captures a climate signal of the preseasons is still debated. For example, Heinrich et al. (2013) mentioned that winters with very low temperatures may damage the cambium more than usual, requiring a longer recovery period. Such winters may have a negative effect on the cambial activity and on the photosynthetic process. Furthermore, Vaganov et al. (1999) showed that precipitation during winter can sustainably affect tree growth in the following year. Their findings are similar to Treydte et al. (2006), who showed that δ18Ocel can contain a winter signal. Treydte et al. (2006) further argued that, depending on the root system, winter snow fall, and the characteristics of groundwater reservoirs, it is likely that trees use precipitation from the preseasons. Nevertheless, it is possible that winter climate conditions can also be memorized in δ18Ocel through different climate feedback processes. For example, Ogi et al. (2003) highlighted that a positive NAO is frequently followed by higher pressures and warmer temperatures in Europe during the next summer. The authors suggested that SST, sea ice extensions, and snow fall anomalies capture the winter climate conditions and influence the summer climate.
However, the oxygen isotope signal in cellulose depends primarily on the corresponding oxygen signal of the soil water and precipitation. According to Saurer et al. (2012), δ18OSW constitutes the average δ18O input to the arboreal system over several precipitation events, and it is modified by partial evaporation from the soil (depending on soil texture and porosity) and by a potential time lag, depending on the rooting depth. Here, we obtain the strongest correlations with δ18OP in winter, spring, and summer (Fig. 7a, b, c). Because the correlations with δ18OSW are strongest in summer and autumn (Fig. 7g, h), and δ18OSW is the input of the arboreal system, we suggest that the isotopic signal of δ18Ocel corresponds to an average over δ18OP events from winter, spring, and summer, transferred via the δ18OSW. This may also explain the reason behind the strong ENSO signal that δ18Ocel is able to capture during winter. Moreover, it indicates the high potential of δ18Ocel to capture climate signals even outside of the growing season.
When considering the multi-seasonal signal, one has to account for the fact that this can lead to certain limitations in the analysis of δ18Ocel. This is because there is only one δ18Ocel value in the network used for each site and for each year; however, this value does not represent a clear seasonal signal referring to one season, instead representing a mix of signals referring to several seasons. Overall, the seasonal contributions to the climate signal can vary in strength. Due to the combinations of these influencing factors, the correlation with individual seasons is certainly weakened, as no clear seasonal signal can be represented by the δ18Ocel value. On the other hand, this enables the observation of several seasons and an understanding of which season has an influence on the biochemical processes in the tree.
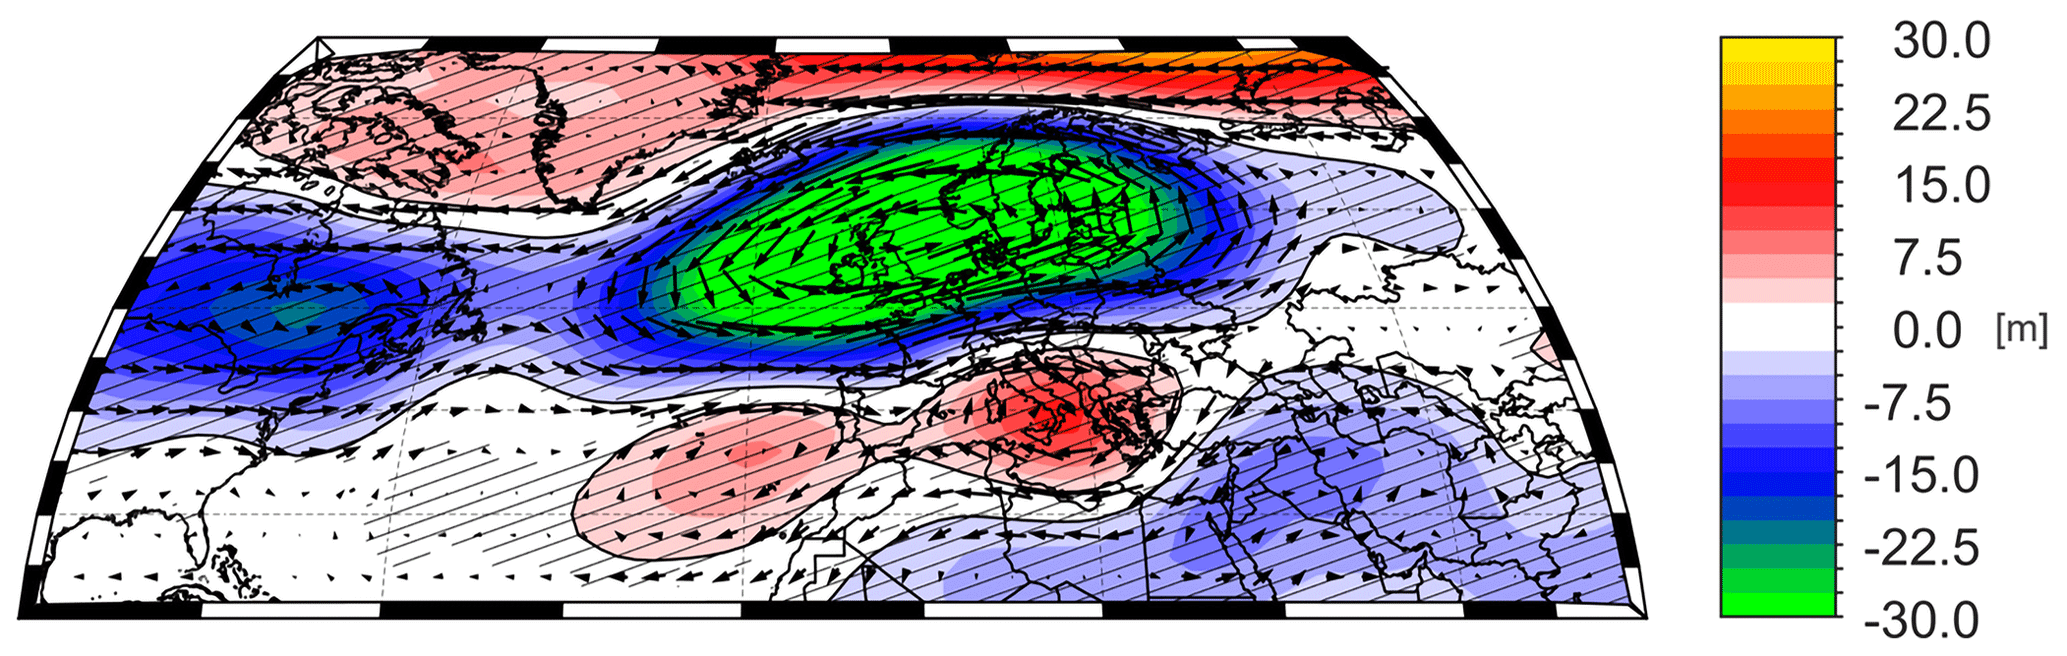
Figure 9Composite map (high−low) for Z500 related to the second δ18O component (PC2) for the boreal summer. The Z500 dataset from 20CRv2c (Compo et al., 2011) is used in this figure for the period from 1901 to 2005. Furthermore, the significance is shown using a black contour line.
4.5 Links between PC2 and large-scale atmospheric modes
In the composite maps for the PC2 (Fig. 9), we obtain a dipole structure between northern Europe and the Mediterranean region. The dipole is characterized by a pressure anomaly centred on the North Sea that expands from the northeastern Atlantic to the Baltic Sea. Its counterpart is present in the northern Mediterranean region, especially in Italy, the northern parts of Greece, and the Adriatic region.
The described pattern shows similarities to the summer European blocking pattern (Barnston and Livezey, 1997; Cassou et al., 2005) which is often associated with the Summer North Atlantic Oscillation (SNAO; Hurrell and van Loon, 1997). According to Cassou et al. (2005), 17.8 % of the positive phase and 17.9 % of the negative phase of the summer European blocking pattern influence the total summer weather regimes in Europe.
The summer European blocking pattern is a surrogate indicator for storm track activities. During the positive index phase, the storm track moves further northwards (Folland et al., 2009; Lehmann and Coumou, 2015). This results in a low storm activity over northern Europe that is characterized by dry conditions, less cloudiness, high temperatures, and a blocked cyclonic flow (Lehmann and Coumou, 2015). On the other hand, the Mediterranean region is affected by lower temperatures and more precipitation. The opposite phenomenon can be identified for the negative index phase. Northern Europe experiences an enhanced storm activity through the southward movement of the storm track over northwestern Europe (Folland et al., 2009; Lehmann and Coumou, 2015), which leads to higher precipitation, higher cloudiness, and lower temperatures. In contrast, the northern Mediterranean experiences dry and warm conditions. These predominant summer European blocking pattern features are well represented in our composite maps of precipitation and temperature for PC2 (Fig. 8). Based on the temporal evolution of PC2, we suggest that there is a tendency towards a negative index phase starting at the beginning of the 20th century.
In addition to the link to summer blocking activity in Europe, the geopotential height pattern is often used in another context. For example, Sillmann and Croci-Maspoli (2009) showed that a positive geopotential height anomaly over the North Sea describes an atmospheric-blocking-like pattern that relates to climate extremes like floods and droughts in the European mid-latitudes. Moreover, this circulation anomaly pattern has been identified as the main driver for extreme dry periods over the eastern Mediterranean (Oikonomou et al., 2010; Rimbu et al., 2014; Ionita and Nagavciuc, 2020) and for summer air temperature variability in Greece (Xoplaki et al., 2003a, b).
Here, we present a δ18Ocel isotope network from tree rings for the last 400 years that was used to investigate the large-scale climate teleconnections related to the European climate. According to our analysis, the climate signals of the network indicate that a link between the δ18O variability and ENSO exists in winter, spring, and summer. The investigation of the modelled suggests that the summer signal still dominates δ18Ocel but is partly influenced by lagged winter and spring precipitation signals. We argue that this is based on hydroclimatic feedback processes as well as characteristics of the water reservoirs of the different sample sites. The ENSO signal is detected for the last 130 years. However, no significant links can be deduced during the period from 1750 to 1850, indicating that the relationship between ENSO and the European climate could be unstable over time. The teleconnection changes between the tropical Pacific and Europe during the pre-instrumental period were also identified from coral data (Rimbu et al., 2003). Further knowledge about a change in teleconnections is essential because teleconnections have a remote climate impact on top of the current global warming.
Our study shows that the EOF2 is characterized by a dipole pattern between northern and southeastern Europe which is comparable to the characteristics of the summer European blocking pattern. As this mode is highly relevant for the summer climate conditions on the entire European continent, the temporal perspective gives new insights into how the frequency of this mode changed through time. Our findings suggest that there is a tendency towards a situation in which southeast Europe is predominantly characterized by a high-pressure system and northern Europe is predominantly characterized by a low-pressure system starting at the beginning of the 20th century. The described pressure pattern is relevant for society because it can influence the spatial and frequency characteristics of climate extremes.
In the context of the ongoing discussion about anthropogenic climate change, water isotope records can provide useful information about spatial and frequency changes in specific large-scale atmospheric circulation patterns. As the logical next step, more high-resolution palaeoclimate data as well as comprehensive model simulations are required to provide additional insights into the stationarity of reconstructed European climate signals and their stationarity in teleconnections.
The ISONET network data are not publicly available. The time series of the individual sample sites can be obtained upon reasonable request from the corresponding authors of the studies mentioned in Sect. 2.1. The climate datasets used in this study are publicly available; please check the references and links in Sect. 2.2 for more details.
The supplement related to this article is available online at: https://doi.org/10.5194/cp-17-1005-2021-supplement.
DFB undertook the research, writing, and analysis. MI, MW, GH, GHS, NR, MBF, IH, DC, and GL supported DB with respect to writing, data analysis, and research approaches. GH, GHS, and IH were involved in the ISONET project. GL and MI are the PhD supervisors of DFB.
The authors declare that they have no conflict of interest.
All but four tree-ring stable isotope chronologies were established within the ISONET project (project no. EVK2-CT-2002-00147), which is supported by the European Union. The authors wish to thank all of the participants of the ISONET project who made this study possible by contributing data and the cited publications. The data from Turkey, Slovenia, and southwestern Germany were produced in the framework of the EU-funded MILLENNIUM project (project no. GOCE 017008-2), and the authors are especially grateful to Tom Levanic and Ramzi Touchan for these data. The tree-ring stable isotope chronologies from Bulgaria were established with support from the German Research Foundation (DFG; project nos. HE3089-1 and GR 1432/11-1) and in cooperation with the administration of Pirin National Park, Bulgaria. Additionally, we wish to thank Martin Butzin and Martin Werner for providing the δ18O in precipitation and soil water from nudged ECHAM5-wiso simulations as well as Vladimir Shishov and the two anonymous reviewers for their helpful comments.
Daniel F. Balting and Diana Caldarescu are funded by the PALEX project (AWI strategy fund), and Monica Ionita is funded by the REKLIM project.
The article processing charges for this open-access publication were covered by a Research Centre of the Helmholtz Association.
This paper was edited by Julie Loisel and reviewed by Vladimir Shishov and two anonymous referees.
Allan, R. J., Lindesay, J., and Parker, D. E.: El Niño, southern oscillation & climatic variability, CSIRO, Collingwood, Vic., Australia, 1996.
Álvarez, C., Veblen, T. T., Christie, D., and González-Reyes, Á.: Relationships between climate variability and radial growth of Nothofagus pumilio near altitudinal treeline in the Andes of northern Patagonia, Chile, Forest Ecol. Manag., 342, 112–121, https://doi.org/10.1016/J.FORECO.2015.01.018, 2015.
Andreu-Hayles, L., Ummenhofer, C. C., Barriendos, M., Schleser, G. H., Helle, G., Leuenberger, M., Gutiérrez, E., and Cook, E. R.: 400 Years of summer hydroclimate from stable isotopes in Iberian trees, Clim. Dynam., 49, 143–161, https://doi.org/10.1007/s00382-016-3332-z, 2017.
Barbour, M. M.: Stable oxygen isotope composition of plant tissue: a review, Funct. Plant Biol., 34, 83–94, https://doi.org/10.1071/FP06228, 2007.
Barnston, A. G. and Livezey, R. E.: Classification, Seasonality and Persistence of Low-Frequency Atmospheric Circulation Patterns, Mon. Weather Rev., 115, 1083–1126, https://doi.org/10.1175/1520-0493(1987)115<1083:CSAPOL>2.0.CO;2, 1987.
Batehup, R., McGregor, S., and Gallant, A. J. E.: The influence of non-stationary teleconnections on palaeoclimate reconstructions of ENSO variance using a pseudoproxy framework, Clim. Past, 11, 1733–1749, https://doi.org/10.5194/cp-11-1733-2015, 2015.
Berrisford, P., Kållberg, P., Kobayashi, S., Dee, D., Uppala, S., Simmons, A. J., Poli, P., and Sato, H.: Atmospheric conservation properties in ERA-Interim, Q. J. Roy. Meteor. Soc., 137, 1381–1399, https://doi.org/10.1002/qj.864, 2011.
Brienen, R. J. W., Helle, G., Pons, T. L., Guyot, J.-L., and Gloor, M.: Oxygen isotopes in tree rings are a good proxy for Amazon precipitation and El Niño-Southern Oscillation variability, P. Natl. Acad. Sci. USA, 109, 16957–16962, https://doi.org/10.1073/pnas.1205977109, 2012.
Brönnimann, S.: Impact of El Niño–Southern Oscillation on European climate, Rev. Geophys., 45, RG3003, https://doi.org/10.1029/2006RG000199, 2007.
Brönnimann, S., Luterbacher, J., Staehelin, J., Svendby, T. M., Hansen, G., and Svenøe, T.: Extreme climate of the global troposphere and stratosphere in 1940–42 related to El Niño, Nature, 431, 971–974, https://doi.org/10.1038/nature02982, 2004.
Brönnimann, S., Xoplaki, E., Casty, C., Pauling, A., and Luterbacher, J.: ENSO influence on Europe during the last centuries, Clim. Dynam., 28, 181–197, https://doi.org/10.1007/s00382-006-0175-z, 2007.
Butzin, M., Werner, M., Masson-Delmotte, V., Risi, C., Frankenberg, C., Gribanov, K., Jouzel, J., and Zakharov, V. I.: Variations of oxygen-18 in West Siberian precipitation during the last 50 years, Atmos. Chem. Phys., 14, 5853–5869, https://doi.org/10.5194/acp-14-5853-2014, 2014.
Carnicer, J., Barbeta, A., Sperlich, D., Coll, M., and Penuelas, J.: Contrasting trait syndromes in angiosperms and conifers are associated with different responses of tree growth to temperature on a large scale, Front. Plant Sci., 4, 409, https://doi.org/10.3389/fpls.2013.00409, 2013.
Cassou, C., Terray, L., and Phillips, A. S.: Tropical Atlantic Influence on European Heat Waves, J. Climate, 18, 2805–2811, https://doi.org/10.1175/JCLI3506.1, 2005.
Compo, G. P., Whitaker, J. S., Sardeshmukh, P. D., Matsui, N., Allan, R. J., Yin, X., Gleason, B. E., Vose, R. S., Rutledge, G., Bessemoulin, P., Brönnimann, S., Brunet, M., Crouthamel, R. I., Grant, A. N., Groisman, P. Y., Jones, P. D., Kruk, M. C., Kruger, A. C., Marshall, G. J., Maugeri, M., Mok, H. Y., Nordli, ø., Ross, T. F., Trigo, R. M., Wang, X. L., Woodruff, S. D., and Worley, S. J.: The Twentieth Century Reanalysis Project, Q. J. Roy. Meteor. Soc., 137, 1–28, https://doi.org/10.1002/qj.776, 2011.
Cook, E., Woodhouse, C., Eakin, C. M., Meko, D., and Stahle, D.: Long-Term Aridity Changes in the Western United States, Science, 306, 1015–1018, https://doi.org/10.1126/science.1102586, 2004.
Cook, E. R., Seager, R., Kushnir, Y., Briffa, K. R., Büntgen, U., Frank, D., Krusic, P. J., Tegel, W., Schrier, G. van der, Andreu-Hayles, L., Baillie, M., Baittinger, C., Bleicher, N., Bonde, N., Brown, D., Carrer, M., Cooper, R., Čufar, K., Dittmar, C., Esper, J., Griggs, C., Gunnarson, B., Günther, B., Gutierrez, E., Haneca, K., Helama, S., Herzig, F., Heussner, K.-U., Hofmann, J., Janda, P., Kontic, R., Köse, N., Kyncl, T., Levanič, T., Linderholm, H., Manning, S., Melvin, T. M., Miles, D., Neuwirth, B., Nicolussi, K., Nola, P., Panayotov, M., Popa, I., Rothe, A., Seftigen, K., Seim, A., Svarva, H., Svoboda, M., Thun, T., Timonen, M., Touchan, R., Trotsiuk, V., Trouet, V., Walder, F., Ważny, T., Wilson, R., and Zang, C.: Old World megadroughts and pluvials during the Common Era, Science Advances, 1, e1500561, https://doi.org/10.1126/sciadv.1500561, 2015.
Craig, H.: Isotopic standards for carbon and oxygen and correction factors for mass-spectrometric analysis of carbon dioxide, Geochim. Cosmochim. Ac., 12, 133–149, https://doi.org/10.1016/0016-7037(57)90024-8, 1957.
Dansgaard, W.: Stable isotopes in precipitation, Tellus, 16, 436–468, https://doi.org/10.1111/j.2153-3490.1964.tb00181.x, 1964.
Dätwyler, C., Abram, N. J., Grosjean, M., Wahl, E. R., and Neukom, R.: El Niño–Southern Oscillation variability, teleconnection changes and responses to large volcanic eruptions since AD 1000, Int. J. Climatol., 39, 2711–2724, https://doi.org/10.1002/joc.5983, 2019.
Dee, D. P., Uppala, S. M., Simmons, A. J., Berrisford, P., Poli, P., Kobayashi, S., Andrae, U., Balmaseda, M. A., Balsamo, G., Bauer, P., Bechtold, P., Beljaars, A. C. M., van de Berg, L., Bidlot, J., Bormann, N., Delsol, C., Dragani, R., Fuentes, M., Geer, A. J., Haimberger, L., Healy, S. B., Hersbach, H., Hólm, E. V., Isaksen, L., Kållberg, P., Köhler, M., Matricardi, M., McNally, A. P., Monge-Sanz, B. M., Morcrette, J.-J., Park, B.-K., Peubey, C., de Rosnay, P., Tavolato, C., Thépaut, J.-N., and Vitart, F.: The ERA-Interim reanalysis: configuration and performance of the data assimilation system, Q. J. Roy. Meteor. Soc., 137, 553–597, https://doi.org/10.1002/qj.828, 2011.
Deser, C., Capotondi, A., Saravanan, R., and Phillips, A. S.: Tropical Pacific and Atlantic Climate Variability in CCSM3, J. Climate, 19, 2451–2481, https://doi.org/10.1175/JCLI3759.1, 2006.
Domeisen, D. I. V., Garfinkel, C. I., and Butler, A. H.: The Teleconnection of El Niño Southern Oscillation to the Stratosphere, Rev. Geophys., 57, 5–47, https://doi.org/10.1029/2018RG000596, 2019.
Donges, J. F., Schleussner, C.-F., Siegmund, J. F., and Donner, R. V.: Event coincidence analysis for quantifying statistical interrelationships between event time series, Eur. Phys. J.-Spec. Top., 225, 471–487, https://doi.org/10.1140/epjst/e2015-50233-y, 2016.
Epstein, S., Thompson, P., and Yapp, C. J.: Oxygen and Hydrogen Isotopic Ratios in Plant Cellulose, Science, 198, 1209–1215, https://doi.org/10.1126/science.198.4323.1209, 1977.
Esper, J., Carnelli, A. L., Kamenik, C., Filot, M., Leuenberger, M., and Treydte, K.: Spruce tree-ring proxy signals during cold and warm periods, Dendrobiology, 77, 3–18, https://doi.org/10.12657/denbio.077.001, 2017.
Etien, N., Daux, V., Masson-Delmotte, V., Mestre, O., Stievenard, M., Guillemin, M. T., Boettger, T., Breda, N., Haupt, M., and Perraud, P. P.: Summer maximum temperature in northern France over the past century: instrumental data versus multiple proxies (tree-ring isotopes, grape harvest dates and forest fires), Clim. Change, 94, 429–456, https://doi.org/10.1007/s10584-008-9516-8, 2009.
Farquhar, G. D. and Lloyd, J.: 5 – Carbon and Oxygen Isotope Effects in the Exchange of Carbon Dioxide between Terrestrial Plants and the Atmosphere, in: Stable Isotopes and Plant Carbon-water Relations, edited by: Ehleringer, J. R., Hall, A. E., and Farquhar, G. D., Academic Press, San Diego, 47–70, 1993.
Felis, T., Ionita, M., Rimbu, N., Lohmann, G., and Kölling, M.: Mild and Arid Climate in the Eastern Sahara-Arabian Desert During the Late Little Ice Age, Geophys. Res. Lett., 45, 7112–7119, https://doi.org/10.1029/2018GL078617, 2018.
Folland, C. K., Knight, J., Linderholm, H. W., Fereday, D., Ineson, S., and Hurrell, J. W.: The Summer North Atlantic Oscillation: Past, Present, and Future, J. Climate, 22, 1082–1103, https://doi.org/10.1175/2008JCLI2459.1, 2009.
Foroozan, Z., Grießinger, J., Pourtahmasi, K., and Bräuning, A.: Evaluation of Different Pooling Methods to Establish a Multi-Century δ18O Chronology for Paleoclimate Reconstruction, Geosciences, 9, 270, https://doi.org/10.3390/geosciences9060270, 2019.
Fraedrich, K.: An ENSO impact on Europe?, Tellus A, 46, 541–552, https://doi.org/10.1034/j.1600-0870.1994.00015.x, 1994.
Fraedrich, K. and Müller, K.: Climate anomalies in Europe associated with ENSO extremes, Int. J. Climatol., 12, 25–31, https://doi.org/10.1002/joc.3370120104, 1992.
Fritts, H. C.: Tree rings and climate, Academic Press, London ; New York, 567 pp., 1976.
Gat, J.: Isotope hydrology: a study of the water cycle, Imperial College Press, London, 189 pp., 2010.
Hafner, P., McCarroll, D., Robertson, I., Loader, N. J., Gagen, M., Young, G. H., Bale, R. J., Sonninen, E.. and Levanič, T.: A 520 year record of summer sunshine for the eastern European Alps based on stable carbon isotopes in larch tree rings, Clim. Dynam., 43, 971–980, https://doi.org/10.1007/s00382-013-1864-z, 2014.
Hagemann, S., Arpe, K., and Roeckner, E.: Evaluation of the Hydrological Cycle in the ECHAM5 Model, J. Climate, 19, 3810–3827, https://doi.org/10.1175/JCLI3831.1, 2006.
Hangartner, S., Kress, A., Saurer, M., Frank, D., and Leuenberger, M.: Methods to merge overlapping tree-ring isotope series to generate multi-centennial chronologies, Chem. Geol., 294–295, 127–134, https://doi.org/10.1016/j.chemgeo.2011.11.032, 2012.
Harris, I., Osborn, T. J., Jones, P., and Lister, D.: Version 4 of the CRU TS monthly high-resolution gridded multivariate climate dataset, Sci. Data, 7, 109, https://doi.org/10.1038/s41597-020-0453-3, 2020.
Haupt, M., Weigl, M., Grabner, M., and Boettger, T.: A 400-year reconstruction of July relative air humidity for the Vienna region (eastern Austria) based on carbon and oxygen stable isotope ratios in tree-ring latewood cellulose of oaks (Quercus petraea Matt. Liebl.), Clim. Change, 105, 243–262, https://doi.org/10.1007/s10584-010-9862-1, 2011.
Heinrich, I., Touchan, R., Dorado Liñán, I., Vos, H., and Helle, G.: Winter-to-spring temperature dynamics in Turkey derived from tree rings since AD 1125, Clim. Dynam., 41, 1685–1701, https://doi.org/10.1007/s00382-013-1702-3, 2013.
Helama, S., Meriläinen, J., and Tuomenvirta, H.: Multicentennial megadrought in northern Europe coincided with a global El Niño–Southern Oscillation drought pattern during the Medieval Climate Anomaly, Geology, 37, 175–178, https://doi.org/10.1130/G25329A.1, 2009.
Helama, S., Läänelaid, A., Raisio, J., Mäkelä, H. M., Hilasvuori, E., Jungner, H., and Sonninen, E.: Oak decline analyzed using intraannual radial growth indices, δ13C series and climate data from a rural hemiboreal landscape in southwesternmost Finland, Environ. Monit. Assess., 186, 4697–4708, https://doi.org/10.1007/s10661-014-3731-8, 2014.
Helliker, B. R. and Griffiths, H.: Toward a plant-based proxy for the isotope ratio of atmospheric water vapor, Glob. Change Biol., 13, 723–733, https://doi.org/10.1111/j.1365-2486.2007.01325.x, 2007.
Henke, L. M. K., Lambert, F. H., and Charman, D. J.: Was the Little Ice Age more or less El Niño-like than the Medieval Climate Anomaly? Evidence from hydrological and temperature proxy data, Clim. Past, 13, 267–301, https://doi.org/10.5194/cp-13-267-2017, 2017.
Hilasvuori, E., Berninger, F., Sonninen, E., Tuomenvirta, H., and Jungner, H.: Stability of climate signal in carbon and oxygen isotope records and ring width from Scots pine (Pinus sylvestris L.) in Finland, J. Quaternary Sci., 24, 469–480, https://doi.org/10.1002/jqs.1260, 2009.
Hill, S. A., Waterhouse, J. S., Field, E. M., Switsur, V. R., and Rees, T. A.: Rapid recycling of triose phosphates in oak stem tissue, Plant Cell Environ., 18, 931–936, https://doi.org/10.1111/j.1365-3040.1995.tb00603.x, 1995.
Hotelling, H.: The most predictable criterion, J. Educ. Psychol., 26, 139–142, https://doi.org/10.1037/h0058165, 1935.
Huang, B., Thorne, P. W., Banzon, V. F., Boyer, T., Chepurin, G., Lawrimore, J. H., Menne, M. J., Smith, T. M., Vose, R. S., and Zhang, H.-M.: Extended Reconstructed Sea Surface Temperature, Version 5 (ERSSTv5): Upgrades, Validations, and Intercomparisons, J. Climate, 30, 8179–8205, https://doi.org/10.1175/JCLI-D-16-0836.1, 2017.
Hurrell, J. and Van Loon, H.: Decadal variations in climate associated with the North Atlantic, Clim. Change, 36, 301–326, https://doi.org/10.1023/A:1005314315270, 1997.
Intergovernmental Panel on Climate Change (Ed.): Special report on emissions scenarios: a special report of Working Group III of the Intergovernmental Panel on Climate Change, Cambridge University Press, Cambridge; New York, 2000.
Ionita, M. and Nagavciuc, V.: Forecasting low flow conditions months in advance through teleconnection patterns, with a special focus on summer 2018, Sci. Rep., 10, 13258, https://doi.org/10.1038/s41598-020-70060-8, 2020.
Ionita, M., Boroneanṭ, C., and Chelcea, S. Seasonal modes of dryness and wetness variability over Europe and their connections with large scale atmospheric circulation and global sea surface temperature, Clim. Dynam., 45, 2803–2829, https://doi.org/10.1007/s00382-015-2508-2, 2015.
Josse, J. and Husson, F.: missMDA: A Package for Handling Missing Values in Multivariate Data Analysis, J. Stat. Software, 70, 31 pp., https://doi.org/10.18637/jss.v070.i01, 2016.
Kahmen, A., Sachse, D., Arndt, S. K., Tu, K. P., Farrington, H., Vitousek, P. M., and Dawson, T. E.: Cellulose δ18O is an index of leaf-to-air vapor pressure difference (VPD) in tropical plants, P. Natl. Acad. Sci. USA, 108, 1981–1986, https://doi.org/10.1073/pnas.1018906108, 2011.
King, M. P., Yu, E., and Sillmann, J.: Impact of strong and extreme El Niños on European hydroclimate, Tellus A, 72, 1–10, https://doi.org/10.1080/16000870.2019.1704342, 2020.
Körner, C.: The use of 'altitude' in ecological research, Trends Ecol. Evol., 22, 569–574, https://doi.org/10.1016/j.tree.2007.09.006, 2007.
Körner, C., Farquhar, G. D., and Wong, S. C.: Carbon isotope discrimination by plants follows latitudinal and altitudinal trends, Oecologia, 88, 30–40, https://doi.org/10.1007/BF00328400, 1991.
Krishnamurti, T. N., Xue, J., Bedi, H. S., Ingles, K., and Oosterhof, D.: Physical initialization for numerical weather prediction over the tropics, Tellus B, 43, 53–81, https://doi.org/10.3402/tellusb.v43i4.15398, 1991.
Labuhn, I., Daux, V., Pierre, M., Stievenard, M., Girardclos, O., Féron, A., Genty, D., Masson-Delmotte, V., and Mestre, O.: Tree age, site and climate controls on tree ring cellulose δ18O: A case study on oak trees from south-western France, Dendrochronologia, 32, 78–89, https://doi.org/10.1016/j.dendro.2013.11.001, 2014.
Labuhn, I., Daux, V., Girardclos, O., Stievenard, M., Pierre, M., and Masson-Delmotte, V.: French summer droughts since 1326 CE: a reconstruction based on tree ring cellulose δ18O, Clim. Past, 12, 1101–1117, https://doi.org/10.5194/cp-12-1101-2016, 2016.
Latif, M. and Grötzner, A.: The equatorial Atlantic oscillation and its response to ENSO, Clim. Dynam., 16, 213–218, https://doi.org/10.1007/s003820050014, 2000.
Lavergne, A., Daux, V., Villalba, R., Pierre, M., Stievenard, M., Vimeux, F., and Srur, A. M.: Are the oxygen isotopic compositions of Fitzroya cupressoides and Nothofagus pumilio cellulose promising proxies for climate reconstructions in northern Patagonia?, J. Geophys. Res.-Biogeo., 121, 767–776, https://doi.org/10.1002/2015JG003260, 2016.
Lehmann, J. and Coumou, D.: The influence of mid-latitude storm tracks on hot, cold, dry and wet extremes, Scientific Reports, 5, 17491, https://doi.org/10.1038/srep17491, 2015.
Li, J., Xie, S.-P., Cook, E. R., Huang, G., D'Arrigo, R., Liu, F., Ma, J., and Zheng, X.-T.: Interdecadal modulation of El Niño amplitude during the past millennium, Nat. Clim. Change, 1, 114–118, https://doi.org/10.1038/nclimate1086, 2011.
Li, J., Xie, S.-P., Cook, E. R., Morales, M. S., Christie, D. A., Johnson, N. C., Chen, F., D'Arrigo, R., Fowler, A. M., Gou, X., and Fang, K.: El Niño modulations over the past seven centuries, Nat. Clim. Change, 3, 822–826, https://doi.org/10.1038/nclimate1936, 2013.
Lloyd-Hughes, B. and Saunders, M. A.: Seasonal prediction of European spring precipitation from El Niño–Southern Oscillation and Local sea-surface temperatures, Int. J. Climatol., 22, 1–14, https://doi.org/10.1002/joc.723, 2002.
Lorenz, E. N.: Empirical Orthogonal Functions and Statistical Weather Prediction, Science Report No. 1, Statistical Forecasting Project, Massachusetts Institute of Technology, Department of Meteorology, Massachusetts, 1956.
Marshall, J. D. and Zhang, J.: Carbon Isotope Discrimination and Water-Use Efficiency in Native Plants of the North-Central Rockies, Ecology, 75, 1887–1895, https://doi.org/10.2307/1941593, 1994.
Mathieu, P.-P., Sutton, R. T., Dong, B., and Collins, M.: Predictability of Winter Climate over the North Atlantic European Region during ENSO Events, J. Climate, 17, 1953–1974, https://doi.org/10.1175/1520-0442(2004)017<1953:POWCOT>2.0.CO;2, 2004.
McCarroll, D. and Loader, N. J.: Stable isotopes in tree rings, Quaternary Sci. Rev., 23, 771–801, https://doi.org/10.1016/j.quascirev.2003.06.017, 2004.
Merkel, U. and Latif, M.: A high resolution AGCM study of the El Niño impact on the North Atlantic/European sector, Geophys. Res. Lett., 29, 5-1–5-4, https://doi.org/10.1029/2001GL013726, 2002.
Nagavciuc, V., Ionita, M., Perşoiu, A., Popa, I., Loader, N. J., and McCarroll, D.: Stable oxygen isotopes in Romanian oak tree rings record summer droughts and associated large-scale circulation patterns over Europe, Clim. Dynam., 52, 6557–6568, https://doi.org/10.1007/s00382-018-4530-7, 2019.
Nagavciuc, V, Kern, Z, Ionita, M, Hartl, C., Konter, O., Esper, J., and Popa, I.: Climate signals in carbon and oxygen isotope ratios of Pinus cembra tree-ring cellulose from the Călimani Mountains, Romania, Int. J. Climatol., 40, 2539–2556, https://doi.org/10.1002/joc.6349, 2020.
North, G. R., Bell, T. L., Cahalan, R. F., and Moeng, F. J.: Sampling Errors in the Estimation of Empirical Orthogonal Functions, Mon. Weather Rev., 110, 699–706, https://doi.org/10.1175/1520-0493(1982)110<0699:SEITEO>2.0.CO;2, 1982.
Ogi, M., Tachibana, Y., and Yamazaki, K.: Impact of the wintertime North Atlantic Oscillation (NAO) on the summertime atmospheric circulation, Geophys. Res. Lett., 30, 1704, https://doi.org/10.1029/2003GL017280, 2003.
Oikonomou, C., Flocas, H. A., Hatzaki, M., Nisantzi, A., and Asimakopoulos, D. N.: Relationship of extreme dry spells in Eastern Mediterranean with large-scale circulation, Theor. Appl. Climatol., 100, 137–151, https://doi.org/10.1007/s00704-009-0171-4, 2010.
Pearson, K.: On lines and planes of closest fit to systems of points in space, The London, Edinburgh, and Dublin Philosophical Magazine and Journal of Science, 2, 559–572, https://doi.org/10.1080/14786440109462720, 1902.
Porter, T. J., Pisaric, M. F. J., Field, R. D., Kokelj, S. V., Edwards, T. W. D., deMontigny, P., Healy, R., and LeGrande, A. N.: Spring-summer temperatures since AD 1780 reconstructed from stable oxygen isotope ratios in white spruce tree-rings from the Mackenzie Delta, northwestern Canada, Clim. Dynam., 42, 771–785, https://doi.org/10.1007/s00382-013-1674-3, 2014.
Pozo-Vázquez, D., Gámiz-Fortis, S. R., Tovar-Pescador, J., Esteban-Parra, M. J., and Castro-Díez, Y.: El Niño–southern oscillation events and associated European winter precipitation anomalies, Int. J. Climatol., 25, 17–31, https://doi.org/10.1002/joc.1097, 2005.
Raible, C. C., Luksch, U., and Fraedrich, K.: Precipitation and Northern Hemisphere regimes, Atmos. Sci. Lett., 5, 43–55, https://doi.org/10.1016/j.atmoscilet.2003.12.001, 2004.
Rast, S., Brokopf, R., Cheedela, S.-K., Esch, M., Gayler, V., Kirchner, I., Kornblueh, L., Rhodin, A., Schmidt, H., Schulzweida, U., and Wieners, K.-H.: User manual for ECHAM6 – June 21, 2013, (2013-02-26), version echam-6.1.06p3-guide-1.3, Berichte zur Erdsystemforschung, 136, 220 pp., https://doi.org/10.17617/2.1810486, 2013.
Rayner, N. A.: Global analyses of sea surface temperature, sea ice, and night marine air temperature since the late nineteenth century, J. Geophys. Res., 108, 4407, https://doi.org/10.1029/2002JD002670, 2003.
Rinne, K. T., Loader, N. J., Switsur, V. R., and Waterhouse, J. S.: 400-year May–August precipitation reconstruction for Southern England using oxygen isotopes in tree rings, Quaternary Sci. Rev., 60, 13–25, https://doi.org/10.1016/j.quascirev.2012.10.048, 2013.
Rimbu, N., Dima, M., Lohmann, G., and Musat, I.: Seasonal prediction of Danube flow variability based on stable teleconnection with sea surface temperature, Geophys. Res. Lett., 32, L21704, https://doi.org/10.1029/2005GL024241, 2005.
Rimbu, N., Lohmann, G., and Ionita, M.: Interannual to multidecadal Euro-Atlantic blocking variability during winter and its relationship with extreme low temperatures in Europe, J. Geophys. Res.-Atmos., 119, 13621–13636, https://doi.org/10.1002/2014JD021983, 2014.
Roden, J. S., Lin, G., and Ehleringer, J. R.: A mechanistic model for interpretation of hydrogen and oxygen isotope ratios in tree-ring cellulose, Geochim. Cosmochim. Ac., 64, 21–35, https://doi.org/10.1016/S0016-7037(99)00195-7, 2000.
Roeckner, E., Bäuml, G., Bonaventura, L., Brokopf, R., Esch, M., Giorgetta, M., Hagemann, S., Kirchner, I., Kornblueh, L., Manzini, E., Rhodin, A., Schlese, U., Schulzweida, U., and Tompkins, A.: The atmospheric general circulation model ECHAM 5. PART I: Model description, Max-Planck-Institut für Meteorologie, Report No. 349, https://doi.org/10.17617/2.995269, 2003.
Roeckner, E., Brokopf, R., Esch, M., Giorgetta, M., Hagemann, S., Kornblueh, L., Manzini, E., Schlese, U., and Schulzweida, U.: Sensitivity of Simulated Climate to Horizontal and Vertical Resolution in the ECHAM5 Atmosphere Model, J. Climate, 19, 3771–3791, https://doi.org/10.1175/JCLI3824.1, 2006.
Rozanski, K., Araguás-Araguás, L., and Gonfiantini, R.: Isotopic Patterns in Modern Global Precipitation, in: Climate Change in Continental Isotopic Records, American Geophysical Union (AGU), 1–36, 2013.
Saurer, M., Borella, S., Schweingruber, F., and Siegwolf, R.: Stable carbon isotopes in tree rings of beech: climatic versus site-related influences, Trees, 11, 291–297, https://doi.org/10.1007/s004680050087, 1997.
Saurer, M., Cherubini, P., Reynolds-Henne, C. E., Treydte, K. S., Anderson, W. T., and Siegwolf, R. T. W.: An investigation of the common signal in tree ring stable isotope chronologies at temperate sites, Geophys. Res., 113, G04035, https://doi.org/10.1029/2008JG000689, 2008.
Saurer, M., Kress, A., Leuenberger, M., Rinne, K. T., Treydte, K. S., and Siegwolf, R. T. W.: Influence of atmospheric circulation patterns on the oxygen isotope ratio of tree rings in the Alpine region, J. Geophys. Res., 117, D05118, https://doi.org/10.1029/2011JD016861, 2012.
Saurer, M., Spahni, R., Frank, D. C., Joos, F., Leuenberger, M., Loader, N. J., McCarroll, D., Gagen, M., Poulter, B., Siegwolf, R. T. W., Andreu-Hayles, L., Boettger, T., Liñán, I. D., Fairchild, I. J., Friedrich, M., Gutierrez, E., Haupt, M., Hilasvuori, E., Heinrich, I., Helle, G., Grudd, H., Jalkanen, R., Levanič, T., Linderholm, H. W., Robertson, I., Sonninen, E., Treydte, K., Waterhouse, J. S., Woodley, E. J., Wynn, P. M., and Young, G. H. F.: Spatial variability and temporal trends in water-use efficiency of European forests, Global. Change Biol., 20, 3700–3712, https://doi.org/10.1111/gcb.12717, 2014.
Schleser, G. H., Frenzel, B., Stauffer, B., and Weiss, M. M.: Parameters determining carbon isotope ratios in plants, Problems of Stable Isotopes in Tree Rings, Lake Sediments and Peat Bogs as Climatic Evidence for the Holocene, Paläoklimaforschung 15, 71–95, 1995.
Schönwiese, C.-D.: Praktische Statistik für Meteorologen und Geowissenschaftler, Borntraeger, Berlin, 2013.
Schweingruber, F. H.: Tree Rings and Environment Dendroecology, Paul Haupt, Bern, 1996.
Siegmund, J. F., Siegmund, N., and Donner, R. V.: CoinCalc–A new R package for quantifying simultaneities of event series, Comput. Geosci., 98, 64–72, https://doi.org/10.1016/j.cageo.2016.10.004, 2017.
Sillmann, J. and Croci-Maspoli, M.: Present and future atmospheric blocking and its impact on European mean and extreme climate, Geophys. Res. Lett., 36, L10702, https://doi.org/10.1029/2009GL038259, 2009.
Sperry, J. S., Hacke, U. G., and Pittermann, J.: Size and function in conifer tracheids and angiosperm vessels, Am. J. Bot., 93, 1490–1500, https://doi.org/10.3732/ajb.93.10.1490, 2006.
Sternberg, L. and Deniro, M. J.: Isotopic Composition of Cellulose from C3, C4, and CAM Plants Growing Near One Another, Science, 220, 947–949, https://doi.org/10.1126/science.220.4600.947, 1983.
Storch, H. von and Zwiers, F. W.: Statistical analysis in climate research, Cambridge University Press, Cambridge; New York, 1999.
Szejner, P., Wright, W. E., Babst, F., Belmecheri, S., Trouet, V., Leavitt, S. W., Ehleringer, J. R., and Monson, R. K.: Latitudinal gradients in tree ring stable carbon and oxygen isotopes reveal differential climate influences of the North American Monsoon System, J. Geophys. Res.-Biogeo., 121, 1978–1991, https://doi.org/10.1002/2016JG003460, 2016.
Treydte, K., Schleser, G. H., Helle, G., Frank, D. C., Winiger, M., Haug, G. H., and Esper, J.: The twentieth century was the wettest period in northern Pakistan over the past millennium, Nature, 440, 1179–1182, https://doi.org/10.1038/nature04743, 2006.
Treydte, K., Schleser, G. H., Esper, J., Andreu, L., Bednarz, Z., and Berninger, F.: Climate signals in the European isotope network ISONET, TRACE, 5, 138–147, 2007a.
Treydte, K., Frank, D., Esper, J., Andreu, L., Bednarz, Z., Berninger, F., Boettger, T., D'Alessandro, C. M., Etien, N., Filot, M., Grabner, M., Guillemin, M. T., Gutierrez, E., Haupt, M., Helle, G., Hilasvuori, E., Jungner, H., Kalela-Brundin, M., Krapiec, M., Leuenberger, M., Loader, N. J., Masson-Delmotte, V., Pazdur, A., Pawelczyk, S., Pierre, M., Planells, O., Pukiene, R., Reynolds-Henne, C. E., Rinne, K. T., Saracino, A., Saurer, M., Sonninen, E., Stievenard, M., Switsur, V. R., Szczepanek, M., Szychowska-Krapiec, E., Todaro, L., Waterhouse, J. S., Weigl, M., and Schleser, G. H.: Signal strength and climate calibration of a European tree-ring isotope network, Geophys. Res. Lett., 34, L24302, https://doi.org/10.1029/2007GL031106, 2007b.
Treydte, K., Boda, S., Graf Pannatier, E., Fonti, P., Frank, D., Ullrich, B., Saurer, M., Siegwolf, R., Battipaglia, G., Werner, W., and Gessler, A.: Seasonal transfer of oxygen isotopes from precipitation and soil to the tree ring: source water versus needle water enrichment, New Phytol., 202, 772–783, https://doi.org/10.1111/nph.12741, 2014.
Trouet, V., Babst, F., and Meko, M.: Recent enhanced high-summer North Atlantic Jet variability emerges from three-century context, Nat. Commun., 9, 180, https://doi.org/10.1038/s41467-017-02699-3, 2018.
Uppala, S. M., KÅllberg, P. W., Simmons, A. J., Andrae, U., Bechtold, V. D. C., Fiorino, M., Gibson, J. K., Haseler, J., Hernandez, A., Kelly, G. A., Li, X., Onogi, K., Saarinen, S., Sokka, N., Allan, R. P., Andersson, E., Arpe, K., Balmaseda, M. A., Beljaars, A. C. M., Berg, L. V. D., Bidlot, J., Bormann, N., Caires, S., Chevallier, F., Dethof, A., Dragosavac, M., Fisher, M., Fuentes, M., Hagemann, S., Hólm, E., Hoskins, B. J., Isaksen, L., Janssen, P. A. E. M., Jenne, R., Mcnally, A. P., Mahfouf, J.-F., Morcrette, J.-J., Rayner, N. A., Saunders, R. W., Simon, P., Sterl, A., Trenberth, K. E., Untch, A., Vasiljevic, D., Viterbo, P., and Woollen, J.: The ERA-40 re-analysis, Q. J. Roy. Meteor. Soc., 131, 2961–3012, https://doi.org/10.1256/qj.04.176, 2005.
Vaganov, E. A., Hughes, M. K., Kirdyanov, A. V., Schweingruber, F. H., and Silkin, P. P.: Influence of snowfall and melt timing on tree growth in subarctic Eurasia, Nature, 400, 149–151, https://doi.org/10.1038/22087, 1999.
van Oldenborgh, J. and Burgers, G.: Searching for decadal variations in ENSO precipitation teleconnections, Geophys. Res. Lett., 32, L15701, https://doi.org/10.1029/2005GL023110, 2005.
van Oldenborgh, G. J., Burgers, G., and Tank, A. K.: On the El-Nino Teleconnection to Spring Precipitation in Europe, arXiv [preprint], arXiv:physics/9812040, 21 December 1998.
Vicente-Serrano, S. M., Beguería, S., López-Moreno, J. I., Angulo, M., and El Kenawy, A.: A New Global 0.5∘ Gridded Dataset (1901–2006) of a Multiscalar Drought Index: Comparison with Current Drought Index Datasets Based on the Palmer Drought Severity Index, J. Hydrometeorol., 11, 1033–1043, https://doi.org/10.1175/2010JHM1224.1, 2010.
Vitas, A.: Tree-Ring Chronology of Scots Pine (Pinus sylvestris L.) for Lithuania, Balt. For., 14, 6 pp., 2008.
Werner, M., Langebroek, P. M., Carlsen, T., Herold, M., and Lohmann, G.: Stable water isotopes in the ECHAM5 general circulation model: Toward high-resolution isotope modeling on a global scale, J. Geophys. Res., 116, D15109, https://doi.org/10.1029/2011JD015681, 2011.
Wu, A. and Hsieh, W. W.: The nonlinear Northern Hemisphere winter atmospheric response to ENSO, Geophys. Res. Lett., 31, L02203, https://doi.org/10.1029/2003GL018885, 2004.
Xoplaki, E., González-Rouco, J., Gyalistras, D., Luterbacher, J., Rickli, R., and Wanner, H.: Interannual summer air temperature variability over Greece and its connection to the large-scale atmospheric circulation and Mediterranean SSTs 1950–1999, Clim. Dynam., 20, 537–554, https://doi.org/10.1007/s00382-002-0291-3, 2003a.
Xoplaki, E., González-Rouco, J. F., Luterbacher, J., and Wanner, H.: Mediterranean summer air temperature variability and its connection to the large-scale atmospheric circulation and SSTs, Clim. Dynam., 20, 723–739, https://doi.org/10.1007/s00382-003-0304-x, 2003b.