the Creative Commons Attribution 4.0 License.
the Creative Commons Attribution 4.0 License.
 | 02 Mar 2023
Temporal stability of long-term satellite and reanalysis products to monitor snow cover trends
Ruben Urraca
Nadine Gobron
Monitoring snow cover to infer climate change impacts is now feasible using Earth observation data together with reanalysis products derived from Earth system models and data assimilation. Temporal stability becomes essential when these products are used to monitor snow cover changes over time. While the temporal stability of satellite products can be altered when multiple sensors are combined and due to the degradation and orbital drifts in each sensor, the stability of reanalysis datasets can be compromised when new observations are assimilated into the model. This study evaluates the stability of some of the longest satellite-based and reanalysis products (ERA5, 1950–2020, ERA5-Land, 1950–2020, and the National Oceanic and Atmospheric Administration Climate Data Record (NOAA CDR), 1966–2020) by using 527 ground stations as reference data (1950–2020). Stability is assessed with the time series of the annual bias in snow depth and snow cover duration of the products at the different stations.
Reanalysis datasets face a trade-off between accuracy and stability when assimilating new data to improve their estimations. The assimilation of new observations in ERA5 improved its accuracy significantly during the recent years (2005–2020) but introduced three negative step discontinuities in 1977–1980, 1991–1992, and 2003–2004. By contrast, ERA5-Land is more stable because it does not assimilate snow observations directly, but this leads to worse accuracy despite having a finer spatial resolution. The NOAA CDR showed a positive artificial trend from around 1992 to 2015 during fall and winter that could be related to changes to the availability of satellite data. The magnitude of most of these artificial trends and/or discontinuities is larger than actual snow cover trends and the stability requirements of the Global Climate Observing System (GCOS). The use of these products in seasons and regions where artificial trends and discontinuities appear should be avoided.
The study also updates snow trends (1955–2015) over local sites in the Northern Hemisphere (NH), corroborating the retreat of snow cover, driven mainly by an earlier melt and recently by a later snow onset. In warmer regions such as Europe, snow cover decrease is coincident with a decreasing snow depth due to less snowfall, while in drier regions such as Russia, earlier snowmelt occurs despite increased maximum seasonal snow depth.


Ground snow cover plays a very important role in the climate system due to its high albedo, thermal insulation, and contribution to soil moisture and runoff. Therefore, it has been defined as an Essential Climate Variable (ECV) by the Global Climate Observing System (GCOS) (GCOS, 2016). A snow cover decrease has been observed globally during the last decades (Stocker et al., 2013; Blunden and Arndt, 2020), which is at the same time a consequence and a cause of global warming. Snow cover retreat has led to a positive snow-albedo feedback of in the Northern Hemisphere (NH) (Stocker et al., 2013). The increase in global net solar energy flux due to snow cover loss ranges from 0.10 to 0.22 W m−2 (±50 %; medium confidence), depending on the dataset and the period (Meredith et al., 2019). The effects are amplified in the poles, particularly over the Arctic, which has warmed at more than twice the global rate during the last 50 years, driven by strong snow-albedo feedback. Two pronounced warming peaks during snow onset (October and November) and snowmelt (April and May) seasons can be observed currently (Brown et al., 2017). Snow loss is not only affecting the global energy budget but also other systems such as the water cycle, vegetation, soil conditions, global atmospheric circulation, and human activities (Callaghan et al., 2011).
Ground stations provide the most accurate snow measurements, but their spatial representativeness is very limited in mountain regions or places with heterogeneous land cover. Besides, ground measurements are scarce in remote regions where the snow loss effects are greater such as the Arctic and high elevations. Long-term snow measurements are particularly limited in the Southern Hemisphere (SH) (Stocker et al., 2013). Therefore, gridded snow products have become crucial to globally evaluate the snow trends during the last decades (Brown et al., 2017). Existing products report a wide range of snow parameters including snow mass, e.g., snow depth (SD), snow water equivalent (SWE), snow density (ρS), and snow cover, e.g., binary snow cover (SC), snow cover fraction (SCF), snow cover duration (SCD), and snow cover extent (SCE).
Satellite products estimate snow properties based either on the optical (visible–infrared) or microwave spectral regions (Frei et al., 2012). Estimating snow cover from optical data is straightforward but presents limitations related to cloud cover, vegetation, and non-illuminated regions. Some examples include the National Oceanic and Atmospheric Administration (NOAA) Interactive Multi-sensor Snow and Ice Mapping System (IMS, 1998–present) (Chiu et al., 2020); the historical NOAA weekly SCE charts (NOAA Climate Data Record (CDR), 1966–present) (Estilow et al., 2015); National Aeronautics and Space Administration (NASA) Moderate Resolution Imaging Spectroradiometer (MODIS) snow cover products (2000–present) (Hall et al., 2006); the Japan Aerospace Exploration Agency (JAXA) SCE product (GHRM5C, 1979–present) (Hori et al., 2017), which combines AVHRR and MODIS imagery; or the NH SCE 1 km product produced by Copernicus Global Land Service (CGLS) in near real time using Suomi-NPP/VIIRS images (Schwaizer et al., 2020). On the other hand, microwave-based methods exploit the scattering of microwave radiation by snow grains, being able to estimate snow mass parameters such as SWE under all-sky conditions. However, they have coarser resolutions (≥25 km), and their uncertainty increases over deep snowpacks (SWE>150 mm) (Pulliainen et al., 2020). GlobSnow (1979–present) (Luojus et al., 2021) and the snow Climate Change Initiative (snow CCI, 1979–2018) (Solberg et al., 2020), both developed by the European Space Agency (ESA), combine passive microwave retrievals with station observations to estimate SWE and SCE. More detailed reviews can be found in Frei et al. (2012) or the SnowPEx project (https://snowpex.enveo.at, last access: 1 May 2021), an international joint effort to inter-compare satellite estimations of SWE and SCE (ESA, 2020; Mortimer et al., 2020).
Global reanalyses appear as an increasingly appealing option for climate studies due to their long-term global coverage of multiple atmospheric, land, and ocean variables. They provide estimations of most snow parameters such as snowfall, snowmelt, snow mass, and snow cover. The latest generation of global reanalyses includes ERA5 (1950–present) from the Copernicus Climate Change Service (C3S) (Albergel et al., 2018), MERRA-2 (1980–present) from NASA (Gelaro et al., 2017), and JRA-55 (1953–present) from the Japanese Meteorological Agency (JMA) (Kobayashi et al., 2015). They mainly differ in their spatial resolution, the complexity of their snow schemes (Krinner et al., 2018), and the amount and type of assimilated observations. However, despite their recent improvements, their accuracy is still constrained by their coarse spatial resolutions (30–60 km) (Urraca et al., 2018; Mortimer et al., 2020; Orsolini et al., 2019; Bian et al., 2019).
The temporal coverage of satellite products is limited to that of the satellite/sensor used, so different satellite instruments are combined to produce Climate Data Records (CDRs). For instance, JAXA GHRM5 combines optical data from NOAA's AVHRR and MODIS sensors, whereas both ESA GlobSnow and ESA CCI SWE combine passive microwave data from SMMR, SSM/I, and SSMIS sensors. The transition periods between different sensors are the main source of instability in these products (Mortimer et al., 2022), but stability issues can also arise due to sensor degradation and orbital drifts (e.g., AVHRR data). The increasing number of satellite sources can also alter the stability of products derived manually by analysts from multiple sources of satellite imagery (e.g., IMS and NOAA CDR). On the other hand, global reanalyses have generally been available since the start of the satellite era or before, but the amount and type of assimilated data change temporally (Mudryk et al., 2015). All these issues can introduce artificial trends and discontinuities in long-term satellite and reanalyses products. Characterizing their stability is therefore critical, particularly for climate applications. Stability is defined by GCOS as the extent to which the uncertainty of measurement remains constant with time (GCOS, 2016). The GCOS stability requirements for snow cover are 10 mm per decade for SD and SWE and 4 % per decade for SCE. These requirements refer to the maximum acceptable change in systematic error per decade.
The goal of the study is to analyze the temporal stability of snow-related variables from satellite products, global reanalysis, and land reanalysis. We selected one product of each type: NOAA CDR (1966–present), ERA5 (1950–present), and ERA5-Land (1950–present), respectively. They provide the longest temporal coverage in each group. Besides, the NOAA CDR is the most widely used product for climate studies including the IPCC AR5 (Stocker et al., 2013) or the “State of the Climate” (Blunden and Arndt, 2020). The stability of the products is evaluated against 527 ground stations over the NH measuring snow from 1950 to 2020. The study also updates the snow cover trends in the Northern Hemisphere from 1955 to 2015. Snow depth and snow cover trends are evaluated with in situ data due to the discontinuities and trends found in gridded datasets. Snow cover extent could be only evaluated by inter-comparing the three gridded products.
2.1 Snow products
2.1.1 ERA5
ERA5 is the latest global climate reanalysis produced by the European Centre for Medium-Range Weather Forecasts (ECMWF) within the Copernicus Climate Change Service (C3S) providing hourly data on atmospheric, land, and sea parameters. ERA5 implements a 4D-Var assimilation system based on the Integrated Forecast System (IFS) CY41R2, with 137 vertical pressure levels and a spatial resolution of around 31 km. The assimilated data increase temporally, with the first satellite observations starting in 1979. ERA5 uses the H-TESSEL land surface model which implements a single-layer snow model (Dutra et al., 2010). The SCF is a diagnostic variable calculated as . It assimilates both in situ and satellite snow observations. The number of in situ assimilated snow observations has been increasing progressively from 1979 to the present, with 4689 stations being assimilated in 2020. Since 2004, ERA5 has also assimilated the IMS product (only below 1500 m). The IMS (Chiu et al., 2020; Orsolini et al., 2019) is produced by NOAA combining microwave, visible, and infrared satellite images, as well as manual analysis input, to produce the binary NH snow cover with a spatial resolution of 24 km (since 1997), 4 km (since 2004), and 1 km (since 2014). The IMS 4 km binary SC is assimilated into the ERA5 model by assigning a snow depth of 5 cm (SCF=50 %) to all IMS snow-covered pixels.
ERA5 has been available from 1979 onward at the C3S Climate Data Store (CDS) (Albergel et al., 2018). A preliminary back extension (1950–1978) was recently released (Bell et al., 2020). In this study, both versions are used, making a combined temporal coverage of 71 years (1950–2020). The snow parameters available at the CDS are SWE and ρs at hourly and monthly resolutions. In this study, hourly SWE and ρs were used to calculate the hourly SD and then aggregated to obtain the average daily SD.
2.1.2 ERA5-Land
The ERA5-Land reanalysis has a replay of the land component of the ERA5 climate reanalysis, forced by meteorological fields from ERA5. It has been produced with the ERA5-Land model H-TESSEL (version IFS CY45R1) without coupling the atmospheric model and without directly assimilating observations to make the simulations computationally affordable (Muñoz Sabater, 2019). This allowed the implementation of some improvements for land surface applications such as a finer spatial resolution of around 9 km. The snow model is the same as in ERA5, but observations are not directly assimilated. Neither in situ snow depth measurements nor the IMS product is directly assimilated by ERA5-Land. ERA5-Land is still influenced indirectly by the snow observations (and observations of other variables) assimilated by ERA5 because ERA5 atmospheric variables are used to control the simulated ERA5-Land fields, which is known as ERA5 atmospheric forcing.
Similar to ERA5, ERA5-Land spans 1950 to the present. The main ERA5-Land dataset goes from 1981 to present, and the ERA5-Land back extension covers 1950–1980. Compared to ERA5, ERA5-Land provides SD as a diagnostic parameter in the CDS, besides SWE and ρs. However, we did not use the diagnostic SD, and we calculated the daily SD from the hourly SWE and ρs to keep consistency with the method applied in ERA5.

2.1.3 NOAA CDR
The NOAA weekly SCE (NOAA CDR) (Estilow et al., 2015) is the longest satellite CDR currently available and the one most widely used for climate applications. It spans 4 October 1966 up to the present with only 9 months missing (July 1968, June–October 1969, July–September 1971). Before June 1999, SCE charts were manually produced by trained NOAA meteorologists based on different sources of visible satellite imagery and then digitalized into a 89×89 Cartesian grid laid over a stereographic projection (∼190.5 km) (Robinson et al., 1993). Since then, weekly charts have been based on the daily IMS 24 km binary snow cover (Helfrich et al., 2007). The two methodologies overlapped for 2 years (June 1997–May 1999) that were used to minimize the impact of the transition in the CDR. Based on this overlap, the conversion from the daily 24 km IMS product to the weekly (Tuesday to Monday) 190.5 km NOAA CDR was done using the Monday IMS estimates and NOAA CDR pixels were set as snow-covered where 42 % of IMS pixels indicated snow. Therefore, weekly SCE maps are heavily weighted towards the end of the mapping week (Estilow et al., 2015). In this study, the NH SCE version 4 available at the National Snow & Ice Data Center (NSIDC) is used, which re-grids the original NOAA CDR to the NH EASE-Grid 2.0 projection of 25 km×25 km (Brodzik and Armstrong, 2013).
2.2 In situ snow measurements
In situ daily snow observations were obtained from the Global Historical Climatology Network (GHCN) managed by NOAA's National Centers for Environmental Information (NCEI), the All-Russia Research Institute of Hydrometeorological Information-World Data Centre (RIHMI-WDC), and the Environment and Climate Change Canada (ECCC) network.
The GHCN is an integrated database with more than 100 000 stations across the globe providing daily measurements of land variables since 1981 (Menne et al., 2012). The stations are divided into four main groups based on the data source: (i) US collection, the largest one; (ii) international collection, obtained through personal contacts; (iii) government data exchange, data collected through official GCOS or bilateral agreements; and (iv) the global summary of the day from SYNOP reports.
The RIHMI-WDC contains 620 stations measuring snow since 1882 (Bulygina et al., 2011, 2009). They measure both the snow depth at the station and the snow cover fraction in the surrounding region, which is estimated visually every morning. Snow course surveys are also available every 5 or 10 d depending on the season but are not used in the present study. The dataset includes an automatic quality control procedure that flags potentially erroneous snow depth measurements. All values flagged by this procedure were discarded.
The ECCC network is the primary in situ network for monitoring snow cover trends in Canada (Brown et al., 2021). The ECCC network is composed of manual and automated stations. Manual stations based on ruler measurements started in 1883, but global coverage of Canada was not achieved until the mid-1950s. The manual network peaked around the 1980s with more than 1600 stations measuring daily snow depth, but it has been declining since the 1990s due to the closure of stations and curtailment of manual SD-observing programs. Automated stations with Campbell Scientific SR50 or SR50 A sonic snow depth sensors have been replacing manual ones since the 1990s, but these efforts have not compensated for the high number of manual stations closed. Only manual stations fulfilled the selection procedure for this study. As suggested by Brown et al. (2021), gap-filled SD values within 14 d of a measurement were used in this study.
All stations measuring daily SD from each network between 1950 and 2020 were used. Over Canada, this period was reduced to 1955–2015 due to the low number of available ECCC stations before 1955 and after 2015. Only stations with more than 10 snow days per year and at least 90 % of valid years in the study period were exploited. Missing values are frequent in snow measurements due to the practice of only recording days with snow presence (Pirazzini et al., 2018). Filling them systematically with zeros would introduce a negative bias in the measurements since some missing values could be truly missing. To avoid this, only years with less than 5 % of missing days were used. In some stations, missing values had already been filled with zeros. These cases were identified by flagging years without snow in stations with more than 40 snow days per year. Flagged years were removed after visually inspecting their time series.
Based on the previous methodology, a reference dataset of 527 stations (228 RIHMI, 242 GHCN, 57 ECCC) was created (Fig. 1). Currently, 313 of these stations are assimilated into ERA5. These stations were kept for the stability analysis, since their addition to ERA5 may explain some of the discontinuities observed, but were removed from the accuracy analysis to guarantee the independence of the validation set. The reference dataset was manually divided into the following spatial regions based on the snow patterns and the performance of the snow products: ECCC N (northern Canada, 5), ECCC E (eastern Canada, 31 stations), ECCC W (western Canada, 21 stations), GHCN AK (Alaska, 12 stations), GHCN USA-W (western USA, 26 stations), GHCN USA-E (eastern USA, 116 stations), GHCN EU (central Europe, 43 stations), GHCN CH (Switzerland, 7 stations), GHCN NO (Norway, 38 stations), RIHMI EU (European Russia, 49 stations), RIHMI Ural (Ural region, 59 stations), RIHMI Siberia (46 stations), RIHMI S (southern Siberia, 41 stations), and RIHMI E (eastern Russia, 33 stations).
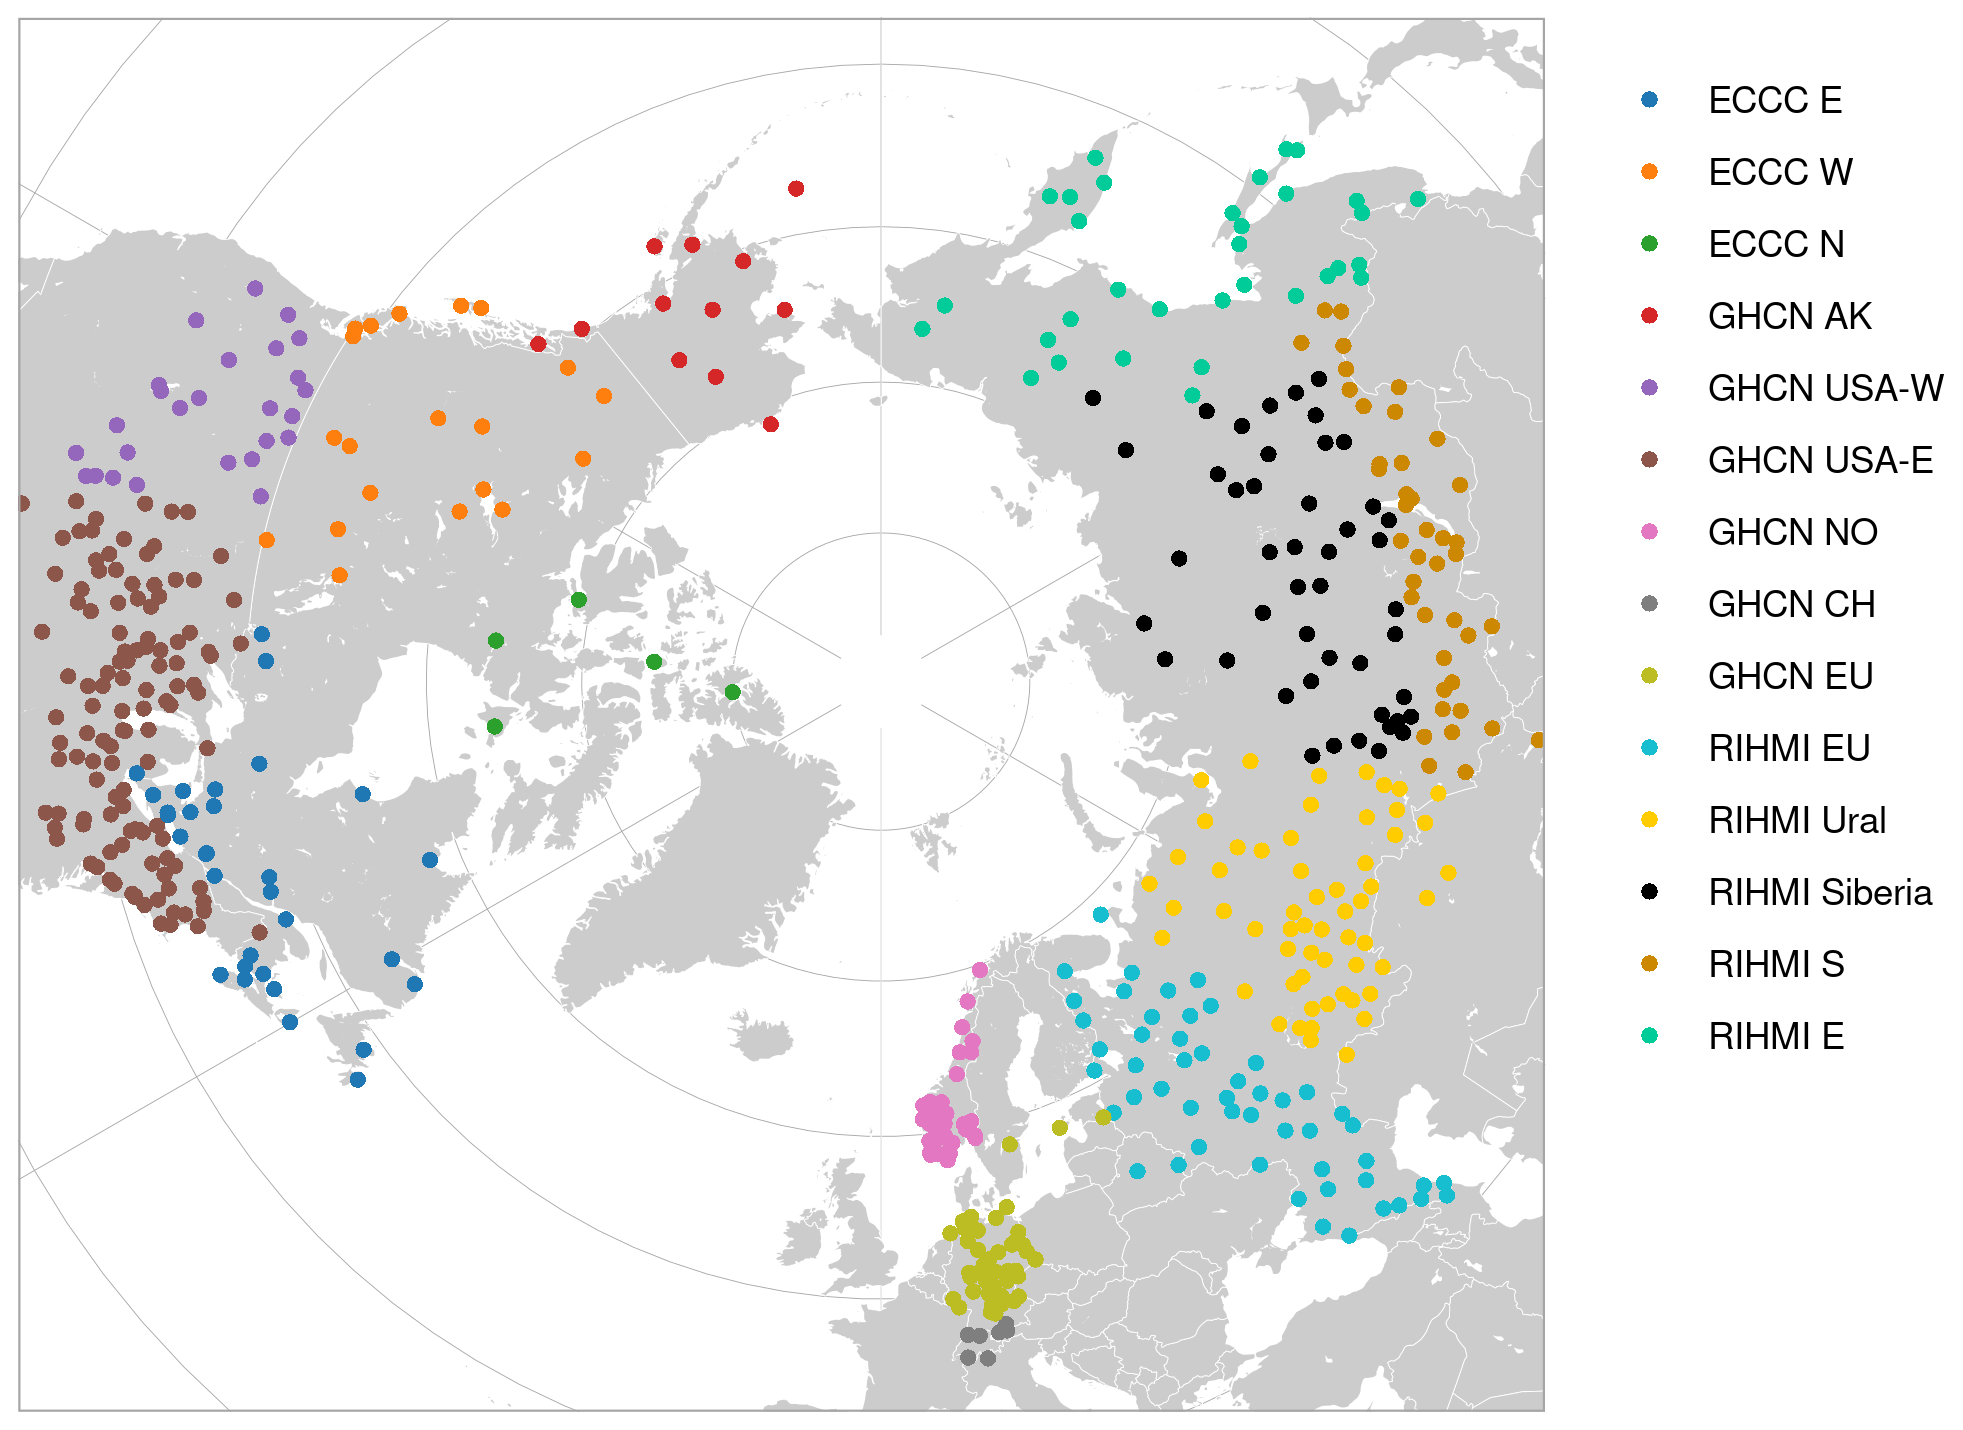
Figure 1Spatial distribution of the stations used in the study.
2.3 Spatial representativeness of in situ snow observations
The spatial representativeness of in situ observations is critical to conduct point-to-pixel validations, particularly when evaluating coarse products such as global reanalyses. The extent to which point observations are representative of their larger surrounding depends on the geophysical variable and the characteristics of the surrounding terrain, among other factors. The spatial representativeness of in situ observations was assessed based on the method proposed by Schwarz et al. (2017) for downward solar radiation measurements. This method uses a high-resolution product to evaluate the variability of a geophysical variable within the pixels of the coarser product being validated. For that, the high-resolution pixel collocated with the station is compared against the mean of the high-resolution pixels contained by the coarser pixel. The method includes (i) a correlation analysis and (ii) an estimation of the spatial sampling error (SSE), which arises when estimating a variable over a large area (i.e., the coarse pixel) from a point observation.
The NOAA's IMS high-resolution 1 km product was used, which has been providing daily binary snow cover since 2014 (Chiu et al., 2020). The coarse products evaluated are ERA5 () and ERA5-Land (). The spatial representativeness was evaluated using all daily IMS maps of snow cover during 2015. For each station, the daily snow cover from the IMS pixel collocated with the station () and the mean of IMS pixels contained by coarser ERA5/ERA5-Land pixels () were extracted. The coefficient of determination (R2) between both variables was calculated. The spatial sampling error was estimated as the mean absolute deviation (MAD) of daily SC:
This metric slightly differs from that proposed by Schwarz et al. (2017), who used a more conservative 95 percentile instead of the mean. Additionally, a new metric was calculated and referred to as the spatial sampling bias (SSB) to quantify the systematic error introduced:
Both SSE and SSB were originally dimensionless because SC is a binary variable. However, both metrics were multiplied by 365 to analyze the results in terms of annual snow cover duration [d yr−1] which is easier to interpret. Stations with () or () were flagged as low representative and subsequently removed from the validation after visually inspecting their SCD map around the station (Sect. 3.1).
2.4 Validation of snow products
The SD and SCD estimations from the snow products were validated against the reference ground measurements. The daily SD of ERA5 and ERA5-Land was directly compared against the daily SD measurements. For snow cover duration, daily SC had to be calculated first from daily SD values. The NOAA CDR was also added to this second part of the validation. Besides low spatially representative stations, stations falling within pixels masked as sea/ocean in the different products (ERA5 – 18 stations, ERA5-Land – 13 stations, NOAA CDR – 18 stations) were also removed for the validation. Note that some sites met the spatial representativeness criteria but fell within a pixel masked as sea by the product.
The conversion from snow depth into snow cover is one of the most sensitive aspects when validating snow products. In a previous study performed with the same group of stations by JAXA (Hori et al., 2017), a threshold of 2.5 cm was used to calculate SC based on a local minimum found in the station measurements. The snow cover fraction in the surrounding of the station is visually assessed at the RIHMI network (Bulygina et al., 2011). We used these measurements to analyze the correlation between SD at the station and the surrounding SCF (Fig. 2). For a surrounding SCF of 0.5 (50 %), the mean and median SD at the station was 3.95 and 1 cm, respectively. The 2.5 cm threshold used by JAXA falls just in the middle of these values, so we decided to keep the same value in our study. Additionally, we performed a sensitivity analysis to evaluate the impact of the threshold used in the snow cover validation metrics (Fig. A2). We analyzed how the SCD bias changes when varying the threshold from 0 to 10 cm by intervals of 2.5 cm. The analysis was done in 2015 to include the IMS 1 km product.
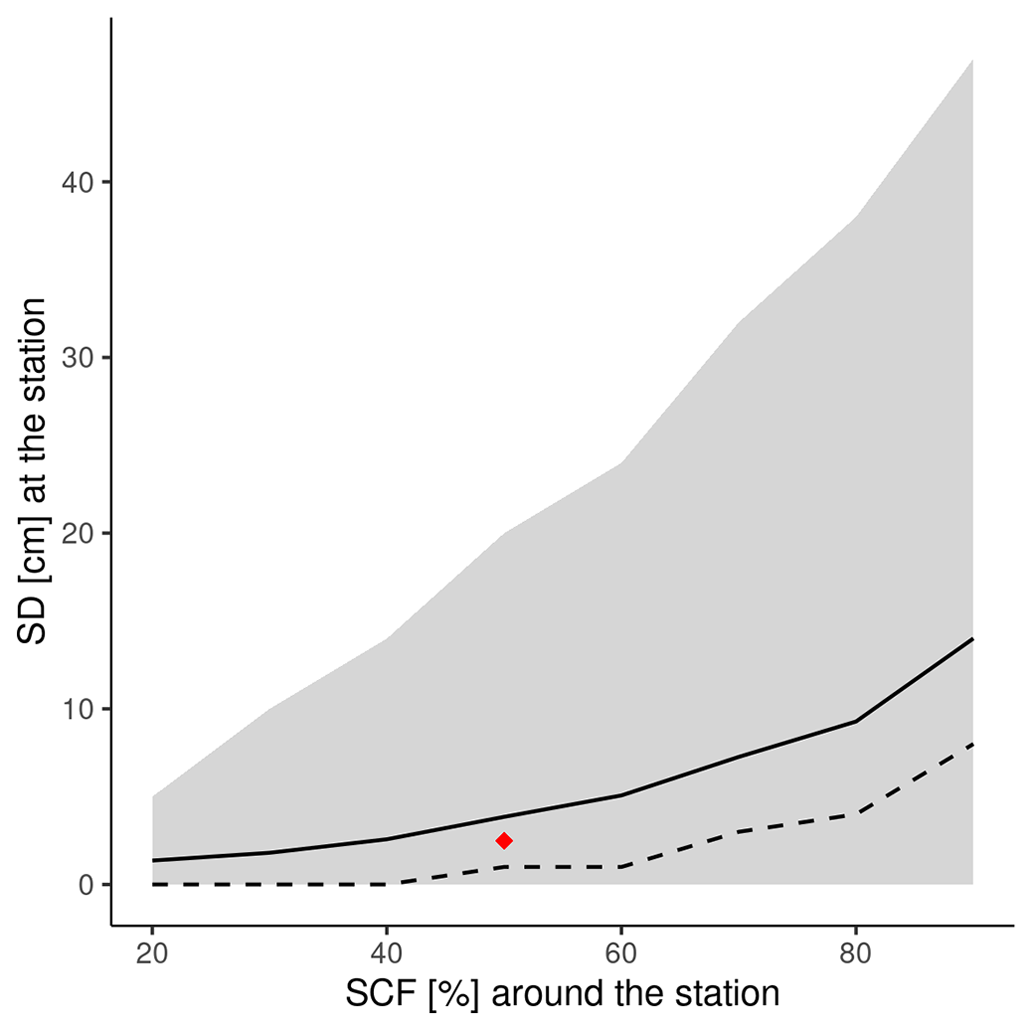
Figure 2Relationship between the snow cover fraction (SCF) around the station and the snow depth (SD) at the station in all RIHMI sites. Solid and dashed lines represent the mean and median value, respectively. The gray shaded region shows the 5th and 95th percentiles. The red dot represents the threshold of 2.5 cm selected to convert SD into SC.
The threshold used to convert SD into SC varies between snow products. Besides, some products provide SCF and others the binary SC. The latter is needed to calculate the SCD. For ERA5 and ERA5-Land, all pixels with SCF>50 % (SD>5 cm) were considered snow-covered. The NOAA CDR already provides the binary SC but at a weekly resolution. The annual SCD was calculated by considering that if a week was flagged as snow-covered, all the days within that week were snow-covered.
2.4.1 Validation metrics
The main goal of the study is to assess the stability of long-term snow cover products. For that, the annual mean bias deviation (MBD) of each product was calculated for SD and SCD values at each station (bias = product − station). Stability was evaluated by analyzing how the annual bias in both SD and SCD changed temporally. Stability was analyzed separately for ECCC, GHCN, and RIHMI stations to discard potential trends or discontinuities in the in situ measurements, such as major changes in the measuring protocols. If a step discontinuity was found, the difference in the bias between the 4 years after and before the discontinuity was calculated (). The relative Δbias in percentage was also calculated as . The interval of 4 years was chosen based on the sensitivity analysis of Fig. A1. This interval needs to be long enough to remove the effects on inter-annual variations of the snow cover, but intervals that are too long may be affected by the underlying trends in the bias. Therefore, the shortest interval once Δbias has stabilized was chosen. If a trend in the annual bias was found, the decadal trend of the annual bias during that period was computed. The temporal stability of the random error was also analyzed by evaluating how the interquartile range (IQR) of the annual bias changes temporally.
The accuracy of the products was evaluated during those years when the products showed optimal stability: 2005–2020 for ERA-Interim and ERA5-Land. Only spatially representative stations that are not assimilated into ERA5 were used in this part. The metrics used were the bias, relative bias, root mean squared deviation (RMSD), and relative RMSD. For SD, the number of daily values below the GCOS accuracy requirements (10 mm) was also calculated. Both accuracy and stability were evaluated annually and seasonally.
2.5 Analysis of snow cover trends in the Northern Hemisphere
The trends in SD and SCD were analyzed using the in situ observations due to the artificial discontinuities and trends found in the snow products. Stations flagged as not spatially representative were kept in this part of the study. The methodology to calculate SCD from SD was the same as that used for the validation. For each variable, decadal trends and annual anomalies for the period 1955–2015 were analyzed. Compared to the stability analysis, the study period was reduced due to the low number of Canadian stations before 1955 and after 2015. The significance of the trends was evaluated with the Mann–Kendall test (Mann, 1945; Kendall, 1975). Note that the density of stations was too low for a complete analysis of NH snow cover trends. Even in regions with good coverage, the heterogeneous density of the stations as well as their different spatial representativeness also prevents the calculation of spatially representative trends. However, our main goal was to estimate the trend magnitude to evaluate the significance of the artificial trends and discontinuities introduced by each product.
The trends in the total NH SCE were analyzed using the three snow products, taking into account the stability issues detected during the validation. The SCE trends and anomalies were calculated over the period when the three datasets were available simultaneously (1972–2020). In the NOAA CDR, the total NH SCE was calculated by summing the area of all snow-covered pixels. In ERA5 and ERA5-Land, snow-covered pixels were summed taking into account the fraction of the pixel covered by snow.
3.1 Spatial representativeness of in situ snow measurements
The spatial representativeness criteria were met by 387 of the 527 snow stations (Table 2 and Fig. 3). The stations removed were primarily located in coastal and mountain regions. On the coast, stations overestimate the mean snow cover over the coarse reanalysis pixel because they are located over land, while the pixel covers both land and sea (see Fig. 3c). In mountainous regions, the spatial representativeness of the stations decreases due to the large elevation gradients (Fig. 3b). The SSE and SSB were very similar in all the stations, which indicates that most of the error introduced by spatial sampling is systematic. Some of these stations showed sampling errors above 100 d yr−1 (>50 %). Norway was the region most affected by the station removal, with 87 % of its stations discarded due to the combination of an irregular coast surrounded by high mountains. Most of the stations were removed because they did not meet the SSE threshold for the coarser ERA5 grid. However, of the 104 stations that were removed, 17 passed the threshold for ERA5 grid () but not for ERA5-Land (). This was the case in sites with high spatial variability of snow cover, where the mean SC over the coarse pixel agreed with the station value just by chance. Implementing the spatial representativeness test at different spatial resolutions, or taking into account the spatial variability of the geophysical variable, is therefore critical to identify and remove these cases.
Table 2Spatial representativeness metrics (R2, SSE – spatial sampling error, SSB – spatial sampling bias) per region in the group of stations selected for the validation after discarding low spatially representative sites.
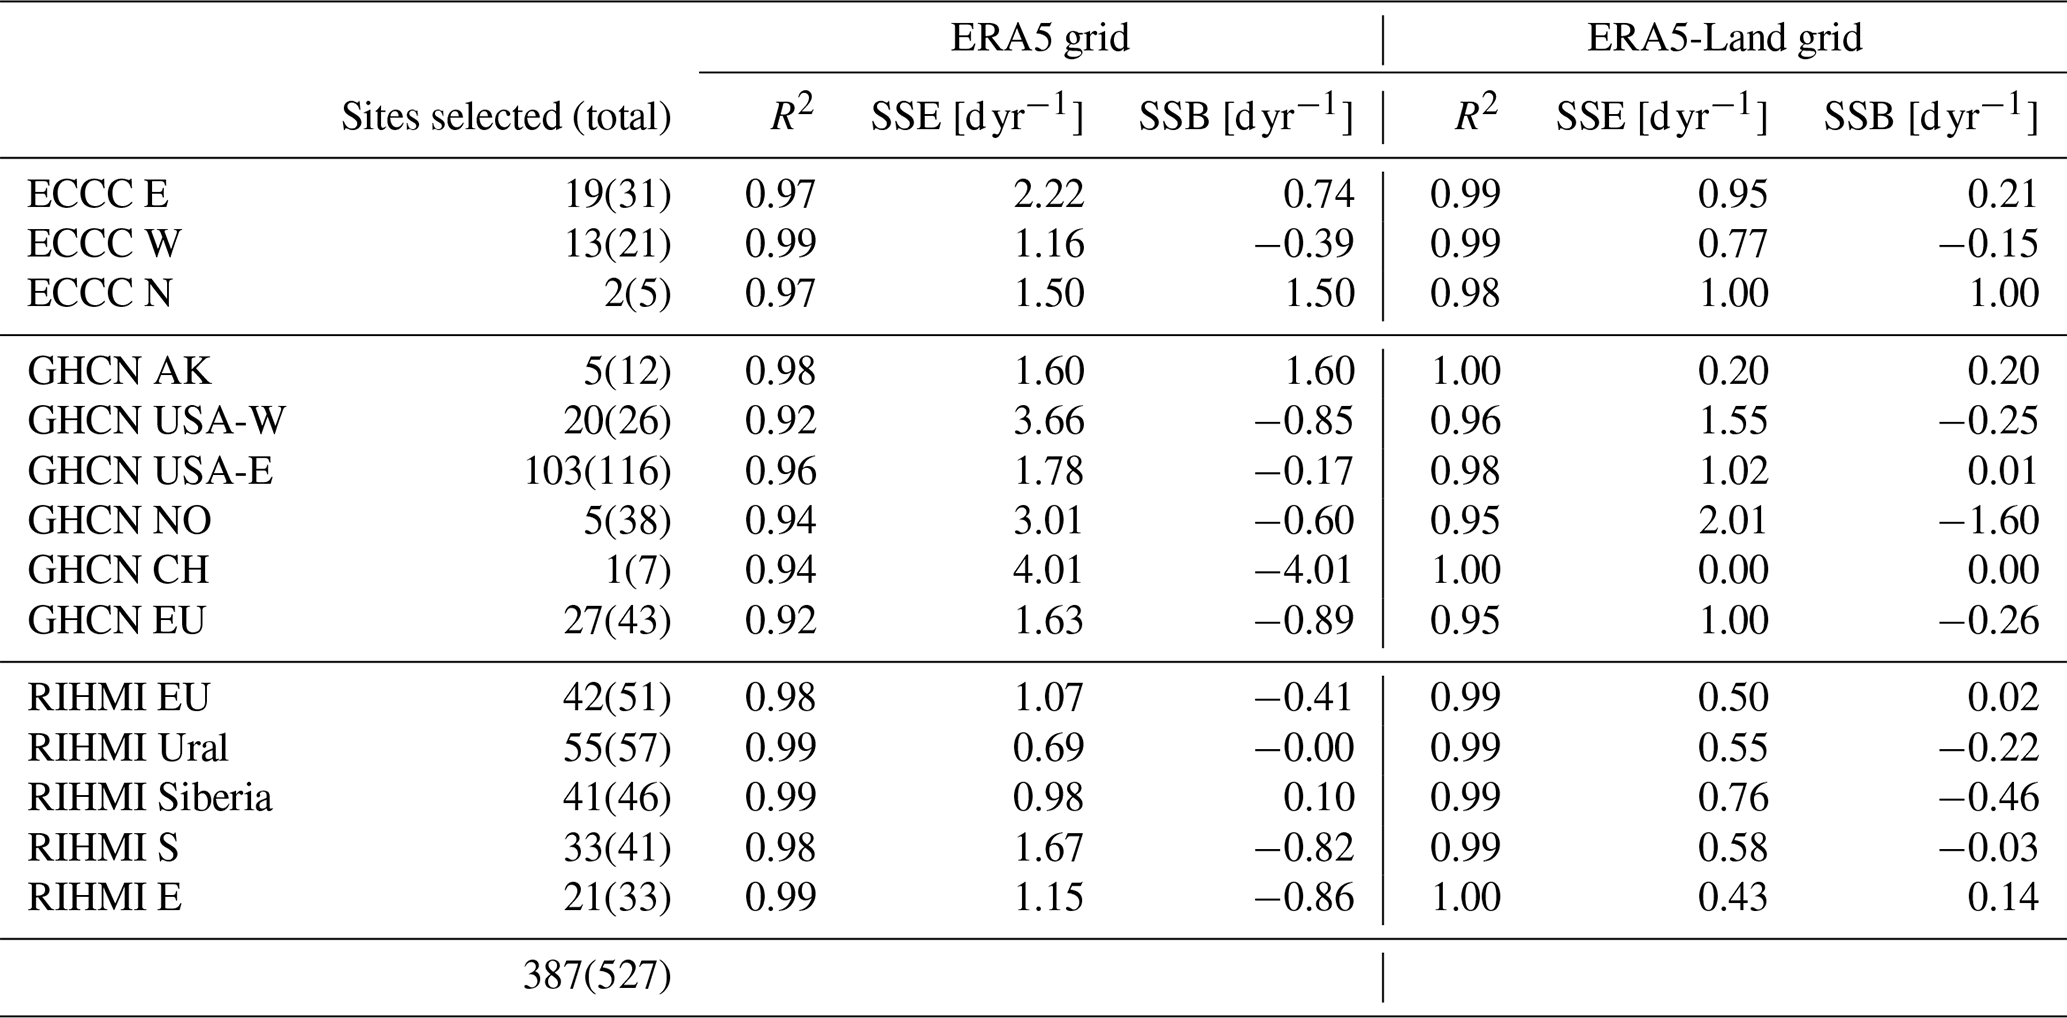
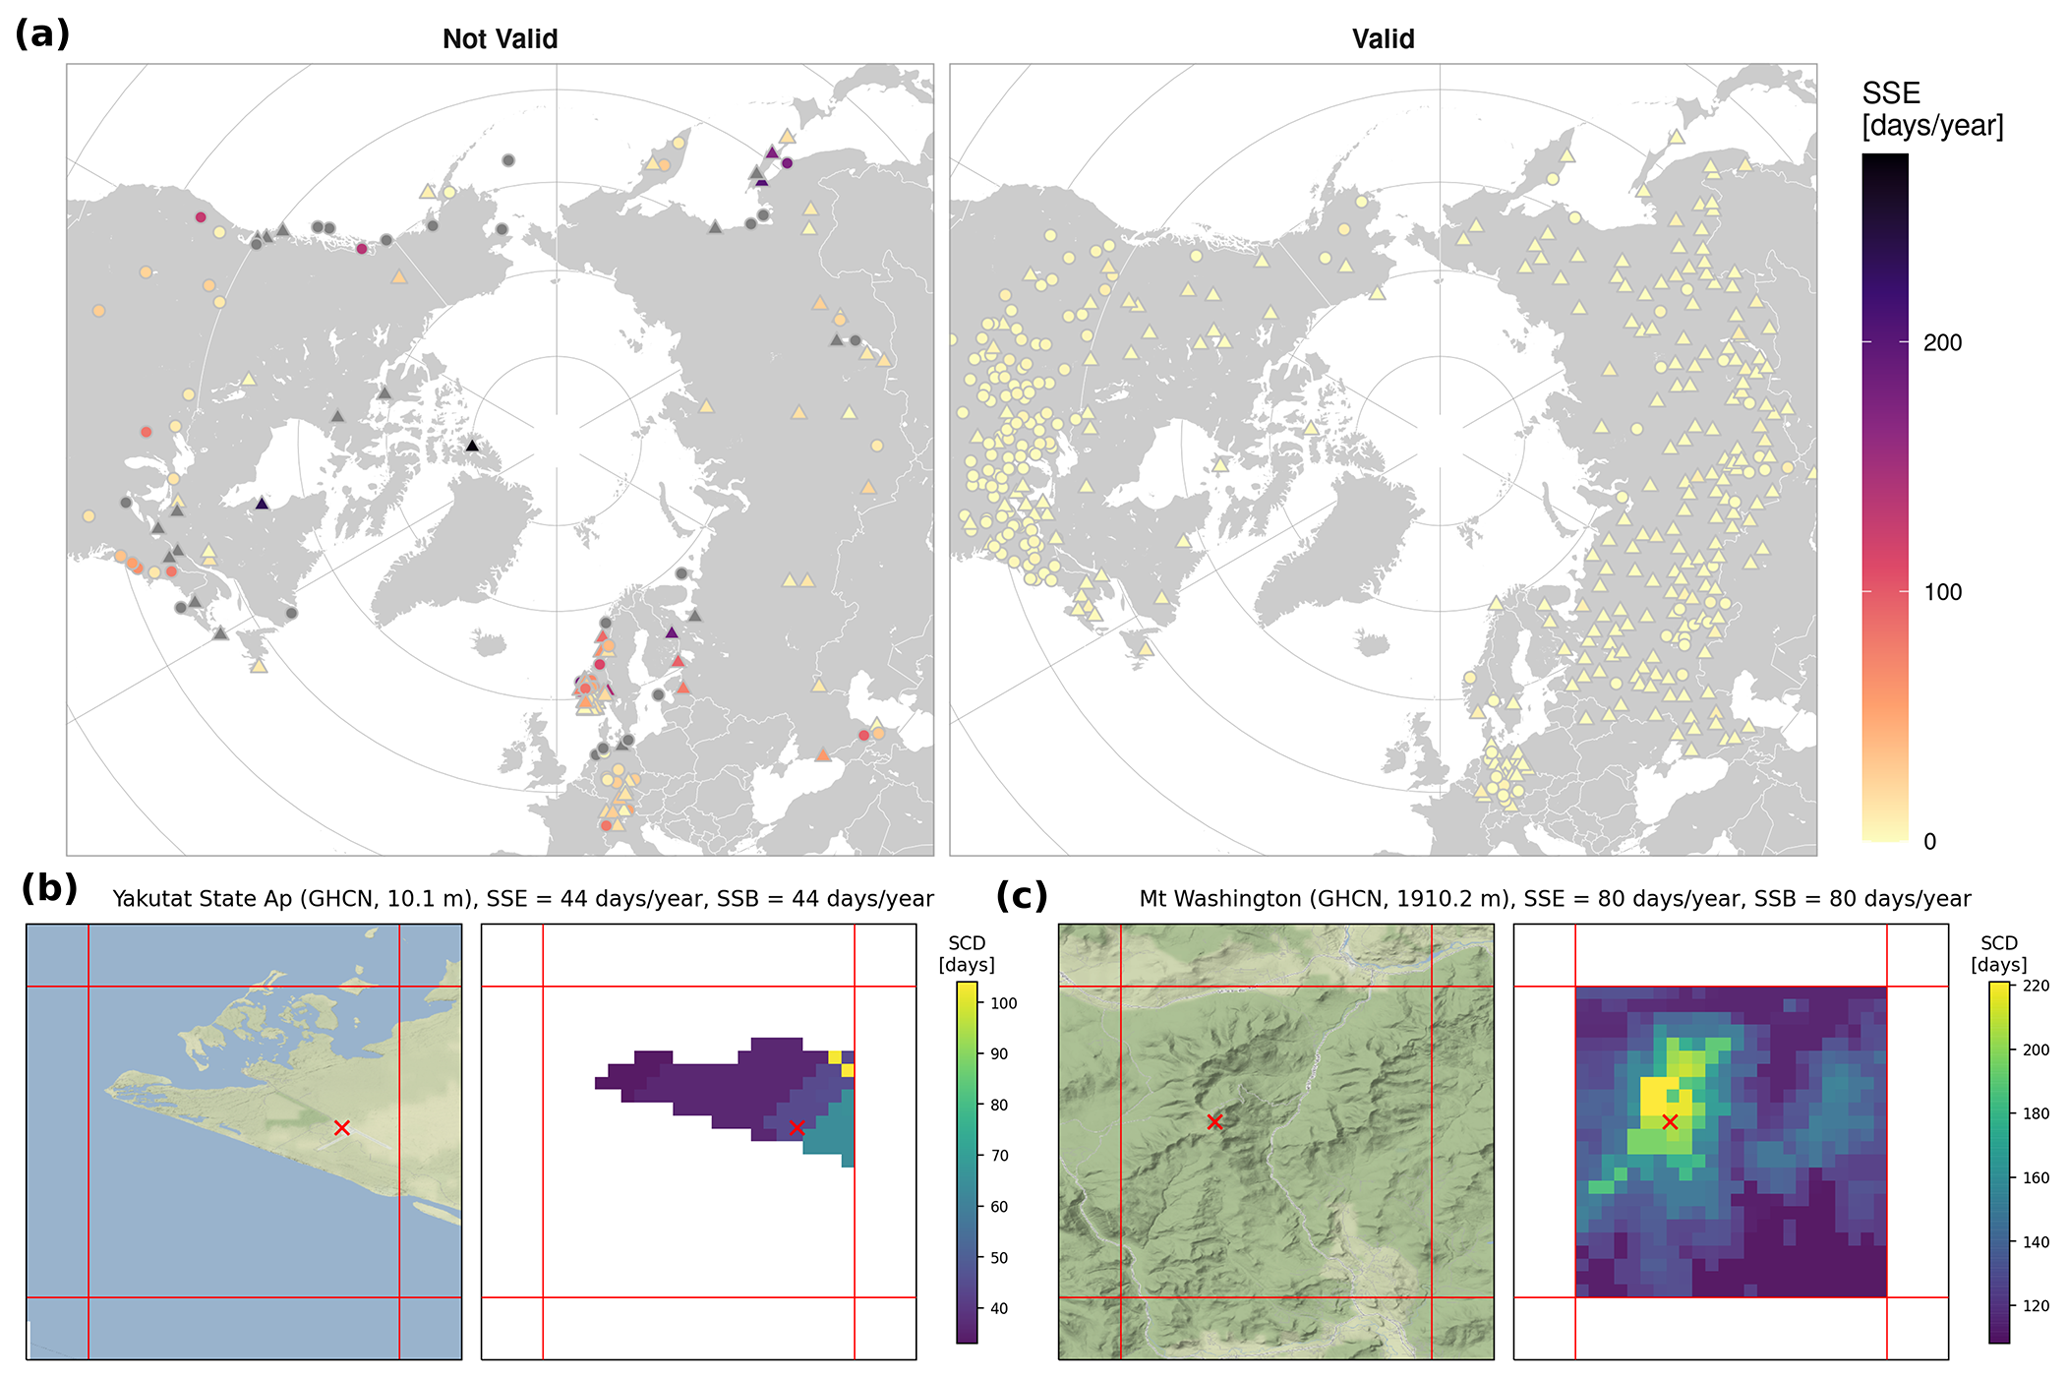
Figure 3(a) Spatial sampling error (SSE) of in situ snow measurements with respect to ERA5 grid. Stations in gray have an IMS snow cover equal to zero. Triangles indicate stations assimilated into the ERA5 model. Spatial distribution of annual snow cover duration (SCD) from the IMS 1 km product in two of the stations flagged as low spatially representative: (b) coastal station and (c) mountain station. Red lines represent the ERA5 grid. The red cross shows the station location. Terrain map tiles by Stamen Design, under CC-BY 3.0. Data by © OpenStreetMap, under ODbL.
The resulting group of 387 stations used for the validation has an average R2>0.91 and SSE<4.01 d in all regions. Non-representative stations were removed for both accuracy and stability assessment, despite the effects of low spatial representativeness on stability being smaller because SSE and SSB are usually constant in time. The spatial representativeness of the stations was not analyzed for the NOAA CDR grid. Despite the version used in this study having a similar resolution to ERA5, the resolution of the original input data (historical NOAA weekly charts) is much coarser (∼190.5 km) and not appropriate for point-to-pixel comparisons. Therefore, this product was not used in the accuracy assessment and was only kept in the stability evaluation as a reference, i.e., to discard potential artifacts/trends in the stations when evaluating the temporal evolution of the bias.
3.2 Temporal stability of the products
The analysis of the temporal stability reveals different step discontinuities and trends in the annual bias of both SD and SCD (Figs. 4 and 5) for the three products evaluated. Additional information about the seasonal stability of the bias is available in Figs. A3–A8.
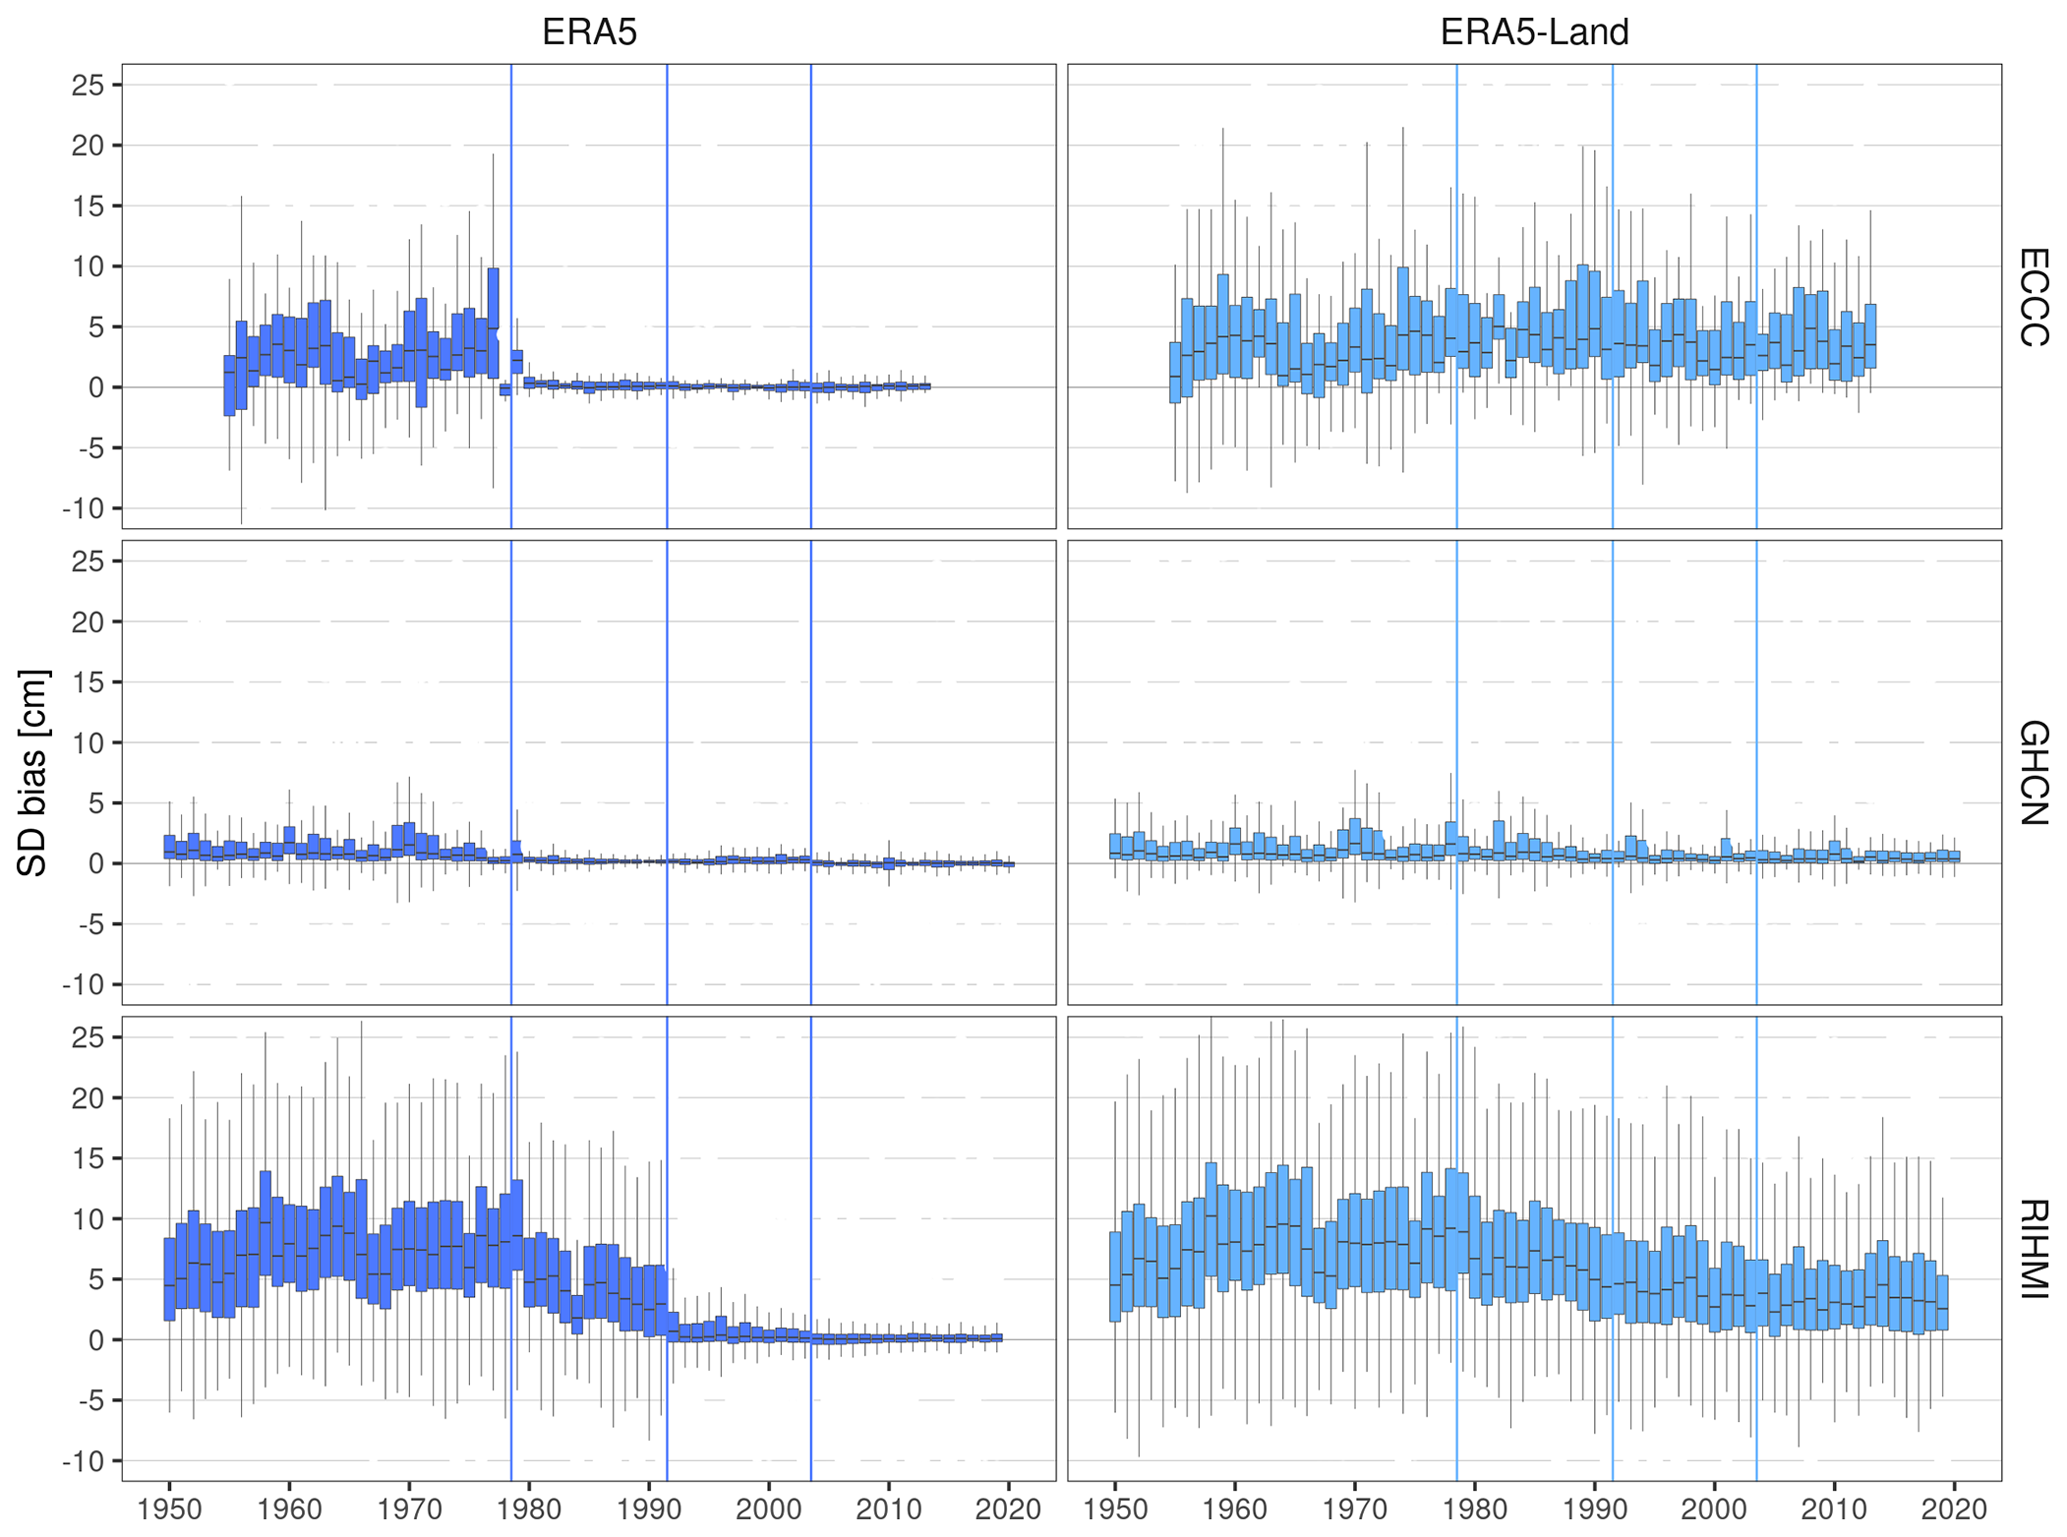
Figure 4Temporal evolution of the annual bias (product – station) in snow depth (SD) per network. Vertical lines show the years when the potential discontinuities in each product occur.

Figure 5Temporal evolution of the annual bias (product – station) in snow cover duration (SCD) per network. Vertical lines show the years when the potential discontinuities/trends in each product occur/start.
The annual bias of ERA5 significantly decreases in time for both SD and SCD, presenting three negative step discontinuities in 1977–1980, 1991–1992, and 2003–2004, as well as a negative trend between 1980–1991. From 1950 to 2020, the interquartile range (IQR) of the annual bias in SD decreases from [3.5,11.1 cm] to at RIHMI, from [0.3,1.9 cm] to at GHCN, and from [0.1,5.3 cm] to at ECCC. The greater initial bias and greater decrease at RIHMI stations are explained by the longer snow season and deeper snowpack over Russia (Bulygina et al., 2011, 2009). The decrease of the bias is more evident in DJF and MAM seasons (Figs. A4 and A5). The magnitude of the bias in SCD is more similar between both networks, with the bias IQR decreasing from [5,25 d] to at RIHMI, from [2,26 d] to at GHCN, and from to at ECCC. The negative change of the bias in both SD and SCD is driven by three stepwise discontinuities. They appear in both networks except for the 1992 discontinuity, which is only observed at RIHMI stations. The hypothesis of an artificial discontinuity in RIHMI in situ measurements was discarded, because the 1992 step discontinuity was not observed in the other products, ERA5-Land, and NOAA CDR. Instead, the three discontinuities are more likely caused by the assimilation of new observations into ERA5. In both 1978–80 and 1992 discontinuities, not only the median bias but also the bias variability, a measure of ERA5 random error, was reduced.
The ERA5-Land bias also decreases temporally for both SD and SCD but in a more gradual way without showing any stepwise discontinuity. The absence of discontinuities is explained by the lack of direct data assimilation in the ERA5-Land model. ERA5-Land is still indirectly influenced by the observations assimilated in ERA5 because ERA5 is used to control the simulated ERA5-Land fields (atmospheric forcing). Therefore, the gradual negative trends in ERA5-Land could be indirectly caused by the three stepwise discontinuities observed in ERA5. Despite being more stable than ERA5, ERA5-Land always exhibits a positive bias but larger bias variability in both SD and SCD. Both the magnitude and variability of ERA5-Land bias are comparable to that of ERA5 before 1980 when no data were being assimilated, whereas ERA5 has clearly been outperforming ERA5-Land since 1992. Despite having a finer spatial resolution and being tailored to land surface applications, the quality of ERA5-Land snow estimates is constrained by the lack of data assimilation.
The NOAA CDR showed a positive overestimation in SCD and a large bias variability. Both issues were somewhat expected. The positive bias could be explained by changes in the method used to produce the snow charts, which since 1999 have considered a pixel to be snow-covered when only 42 % of the IMS pixels within the pixel were snow-covered. On the other hand, the large bias variability could also be related to the coarse resolution of the original product (∼190.5 km), making it inappropriate for point-to-pixel comparisons. This was already stated in the product manual, which recommends using this CDR only for SCE studies over large regions (Estilow et al., 2015). Anyway, as discussed in Sect. 3.1, we decided to use the NOAA CDR in the stability assessment because the goal was not to make point SCD estimations but to include a satellite product in the comparison that helps to discard artificial trends and discontinuities in the in situ measurements. In this sense, the NOAA CDR shows an overall good temporal stability in spring and summer, but a positive trend in the bias has been observed since 1990 in fall (Fig. A6) and winter (Fig. A7). The positive trend in fall has been previously reported as problematic in several studies (Brown et al., 2017; Brown and Derksen, 2013; Derksen, 2014; Hori et al., 2017) and it is further investigated in Sect. 3.2.2.
3.2.1 ERA5 stepwise discontinuities
The magnitude of each ERA5 discontinuity is estimated by calculating the difference in the bias between the 4 years after and before the discontinuity occurred (Fig. 7 and Table A1).
The 1977–1980 discontinuity is the most important overall and could be explained by the assimilation of the first satellite products and in situ observations into ERA5 (Fig. 6). As reported in the ERA5 documentation web page (ECMWF, 2021), significant improvements were observed in the ERA5 forecast skill after 1978 over regions with scarce conventional observations. Carrying out simulations prior to the satellite era is the main challenge of the ERA5 back extension. The annual Δbias is larger in SD ( %, %, %) than in SCD ( %, %, %). The magnitude of the discontinuity is correlated with the snow depth, having more impact at RIHMI stations and particularly at mountain regions such as the Alps, southern Russia, or Norway. Similarly, the most affected seasons (ranked from largest to smallest) are those with more snow: DJF, MAM, and SON. A positive ERA5 bias in SD of similar magnitude was also observed in SD (Orsolini et al., 2019) and SWE (Bian et al., 2019) over the Tibetan Plateau, a region where neither in situ observations nor the IMS product is assimilated. Orsolini et al. (2019) suggested that the most likely cause was an excessive snowfall precipitation over the Tibetan Plateau, discarding other effects such as snow sublimation due to blowing snow or the SCF threshold. In this study, ERA5 also shows a large positive bias in periods with low data assimilation (before 1980). Besides, ERA5-Land, which does not directly assimilate observations, also shows a predominantly positive bias in SD. As suggested by Orsolini et al. (2019), the most likely cause of the snow depth overestimation in both ERA5 and ERA5-Land could be a precipitation bias, which is only corrected in ERA5 by the assimilation of snow depth observations after 1979.
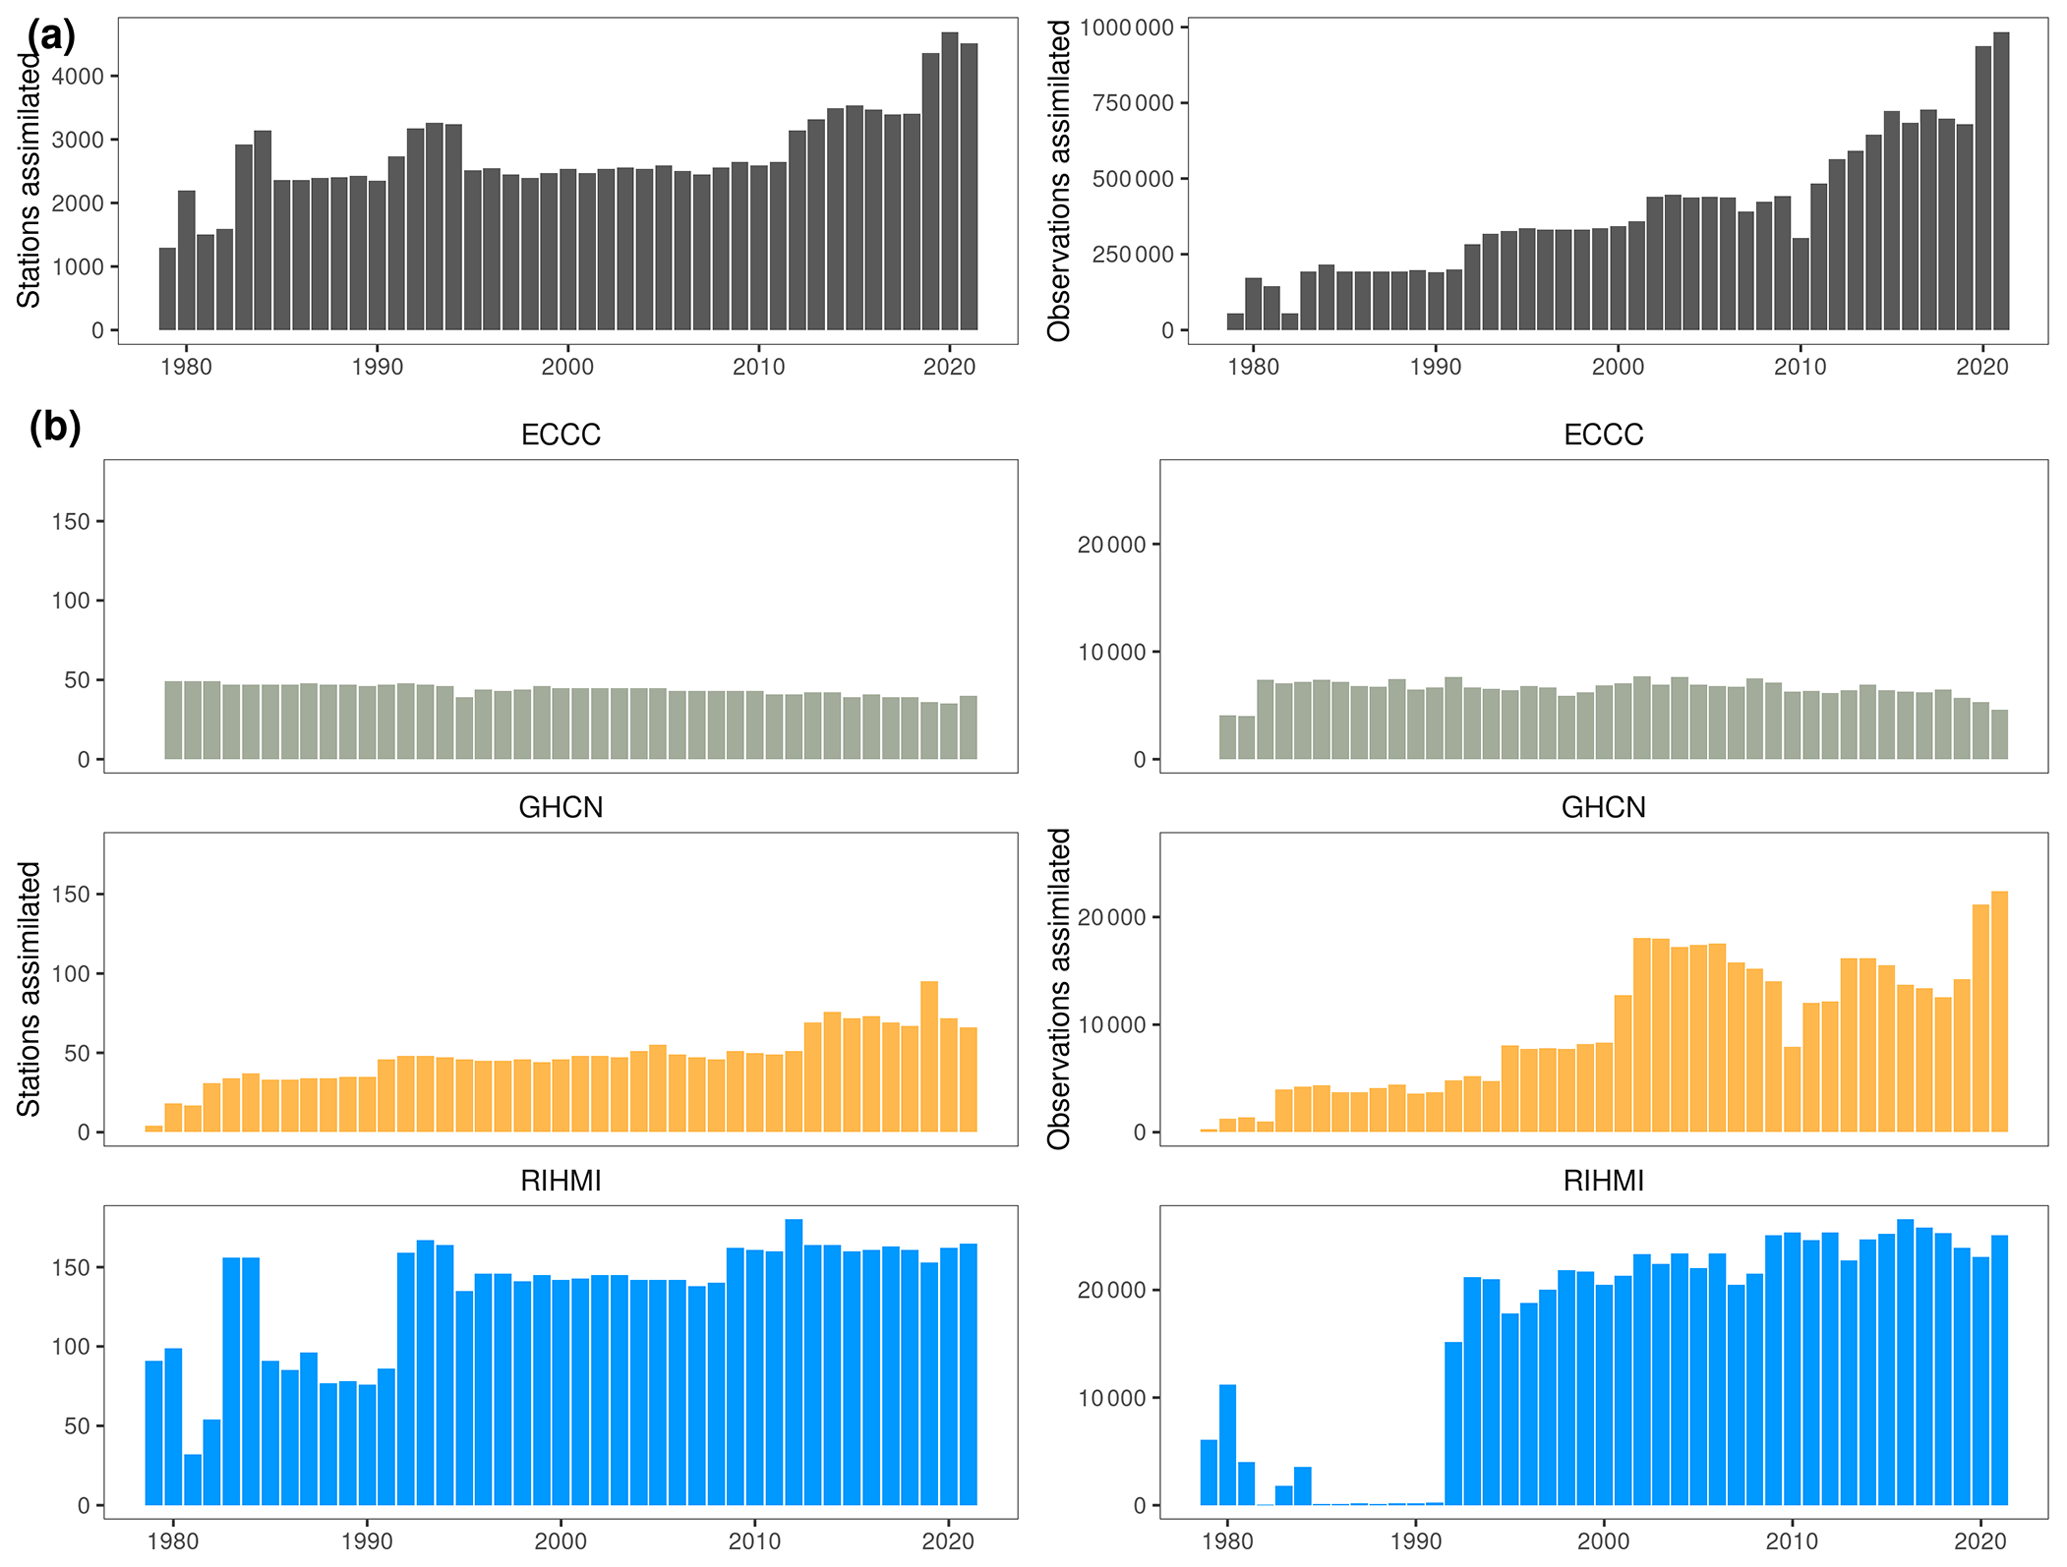
Figure 6Temporal evolution of the in situ snow stations and observations assimilated by ERA5: (a) all stations assimilated by ERA5 and (b) stations assimilated by ERA5 within our validation set.
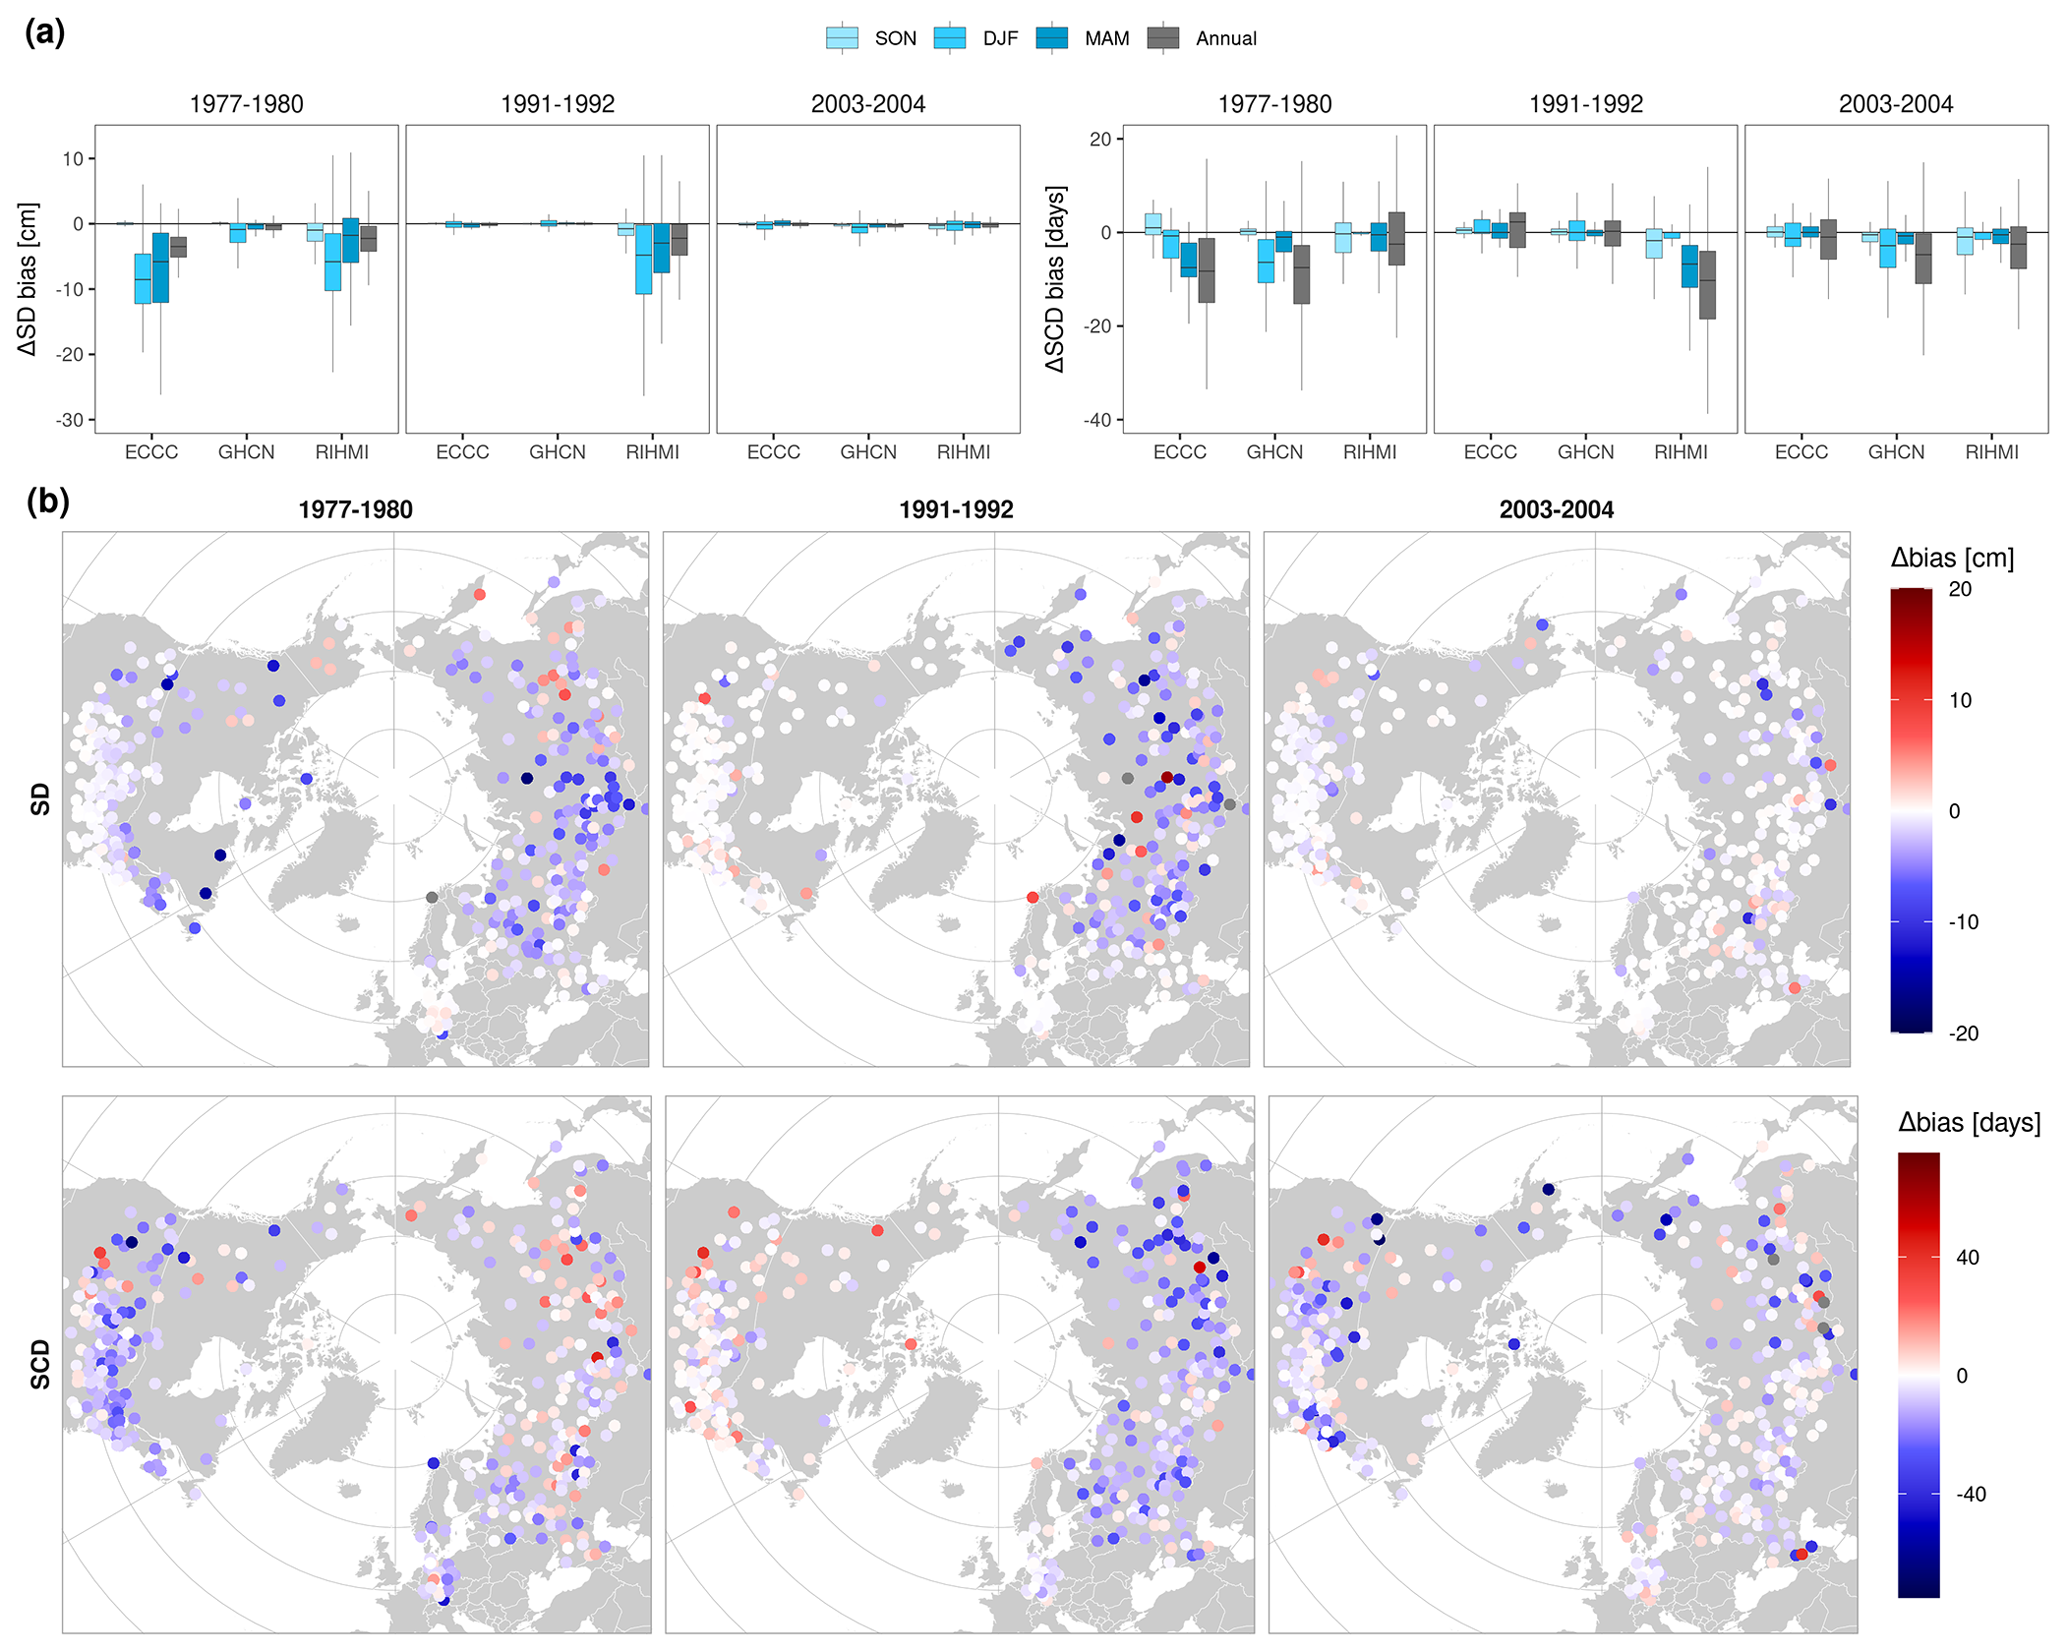
Figure 7Change in the ERA5 bias in snow depth (SD) and snow cover duration (SCD) during 1977–1980, 1991–1992, and 2003–2004 discontinuities. The 4 years before and after the discontinuity are compared (). (a) Seasonal change in the bias per network. (b) Annual change in the bias per station.
The 1991–1992 discontinuity presents a similar seasonal pattern in ΔbiasSD than the one in 1977–1980, having more impact (sorted from largest to smallest) in DJF (−52.8 %), MAM (−33.1 %), and SON (−8.1 %), respectively. The main difference is that the 1991–1992 discontinuity is only observed over Eurasia. This step is most likely caused by the assimilation of new in situ observations in Russia and China starting from 1992 (Fig. 6). The assimilation of these observations further corrects the large positive bias exhibited by most Russian stations ( %, %), falling within a similar range to that observed over Europe and North America. Similar to the 1980 discontinuity, this discontinuity not only reduced the median bias but also its variability.
The 2003–2004 discontinuity, already reported by Mortimer et al. (2020), is caused by the assimilation of the satellite-based IMS product. Compared with the previous ones, this discontinuity has a greater impact on snow onset and snowmelt detection than on snow depth. The change of the bias is larger in SCD than in SD, and spatially, the discontinuity is larger at GHCN stations ( %, %) than at RIHMI ones ( %, %). This could be explained by how the IMS product is integrated into the ERA5 model. Snow-covered pixels are assimilated as 5 cm of snow depth, explaining the relatively low impact in snow depth and the large improvements in the detection of the start/end of the snow season, which are more evident in SON, MAM, and regions with a short snow season. Particularly large changes are also observed in coastal or mountain regions (Rocky Mountains, southern Siberia), which could be related to the benefits of assimilating a product with a finer resolution over these regions where assimilated snow observations are also scarce. Note that the IMS product was only assimilated below 1500 m, so large improvements observed in mountain regions mostly occur at stations located in the valleys.
Figure 6 shows that the observations assimilated into ERA5 also increased significantly in 2001–2002 (more European stations), 2011–2015 (new stations in eastern Europe and the Scandinavian Peninsula), and 2019–2020 (new Kazakh stations and more observations in China and Europe). However, discontinuities related to these changes were observed in neither the SD/SCD bias time series nor the global SCE time series.
Table A1 summarizes the number of stations where ERA5 shows acceptable stability according to the GCOS requirements. This metric was only calculated for SD (stability = 10 mm) because no explicit requirement is made for SCD. The three discontinuities introduced a ΔbiasSD above this threshold in most of the stations, particularly if analyzing the winter trends alone. Only 10.6 %, 12.2 %, and 58.2 % of RIHMI stations; 41.1 %, 69.7 %, and 50.0 % of GHCN stations; and 0 %, 67.7 %, and 69.7 % of ECCC stations were below the stability threshold in winter during the 1977–1980, 1991–1992, and 2003–2004 discontinuities, respectively. Note that these values would be even larger if looking only at snow-covered days in regions such as the USA or Europe where snow does not last the full winter season.
3.2.2 NOAA CDR bias trend in fall and winter
The NOAA CDR exhibits a positive trend in the SCD bias during SON and DJF (Fig. 8 and Table A2). The trend steadily starts from 1990–1995, almost extending to present day. The positive trend in the bias explains the artificial positive trend in the snow cover extent observed in Fig. 11 during SON, which was already documented by different authors (Hori et al., 2017; Brown and Robinson, 2011; Brown and Derksen, 2013). Brown and Robinson (2011) reported that the positive October SCE trend was an artifact of the NOAA CDR since this positive trend was opposed to several independent snow products and to in situ measurements (Peng et al., 2013). They suggested that the most likely cause could be the increase of satellite data ingested by the NOAA CDR analysts, as well as the increase in the temporal and spatial resolution of these products, which led to a more accurate snow onset detection. In the same line, Mudryk et al. (2017) found that the NOAA CDR trends in October and November are non-physical and not consistent with other datasets. Our study corroborates the existence of a significant positive trend in the bias around 5–10 d per decade in many Eurasian stations and in some stations of northern USA. Additionally, our study reveals that the same trend in the bias appears in DJF in some European (10 d per decade) and eastern USA stations (7.2 d per decade), regions where snow onset takes place later than in Russia. Figure 5 also corroborates the fact that there is no step discontinuity related to the transition between the two methodologies in 1999, though the positive trend in the bias may have been aggravated after 1999 due to the improved resolution and the increasing number of satellite products ingested by the IMS product.
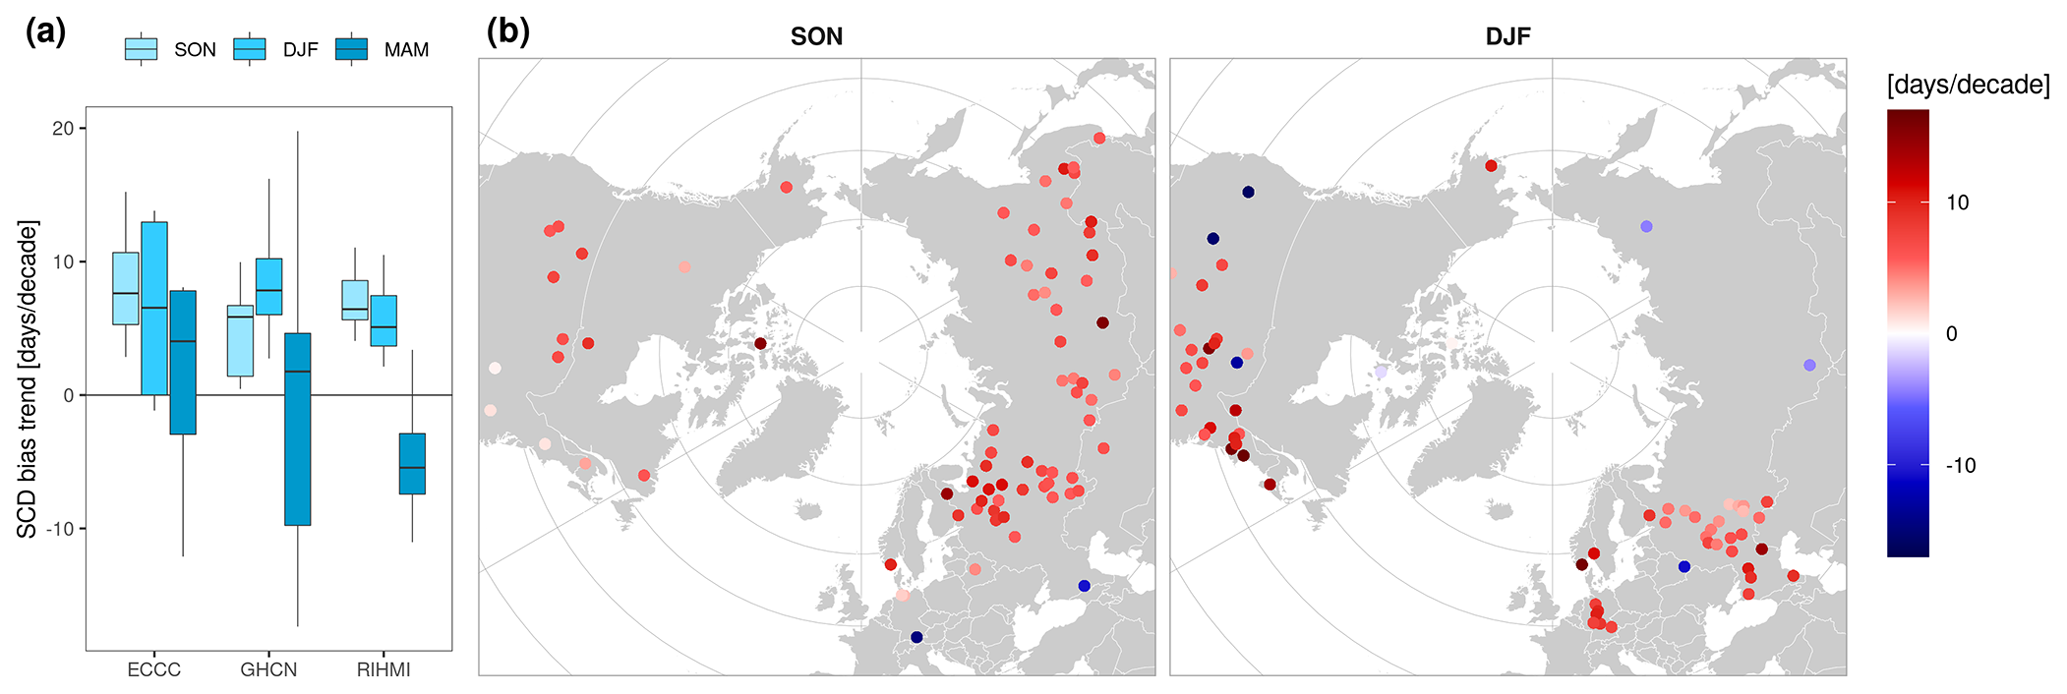
Figure 8Decadal trend of the annual bias in seasonal snow cover duration (SCD) of the NOAA CDR from 1992 to 2015 (a) per network and (b) per station. Only significant trends (p<0.05, Mann–Kendall) are shown. The MAM map was excluded due to the lack of an artificial trend globally during that season.
Brown and Derksen (2013) suggested that the opposite effect during the spring season could be expected but was not observed. Theoretically, improved detection of snow melting could lead to a stronger spring trend, introducing an artificial negative trend in the CDR. In this line, Derksen (2014) reported a tendency of the NOAA CDR to map less snow in spring since 2007 than the multi-dataset composed by the NOAA CDR, MERRA, and ERA-Interim. Mudryk et al. (2017) also found that the NOAA CDR has a spring trend stronger than other datasets. We analyzed this issue by evaluating the snow cover duration trends in spring. Negative trends in the spring bias only appear in some Russian stations (Fig. 8a). However, the number of stations showing significant trends in spring is smaller, and the magnitude of these trends is lower than those in fall and winter. Despite the fact that this issue could exist in some regions, the impact at a global scale is negligible (Fig. A8).
3.3 Spatial accuracy of the reanalyses after the last ERA5 discontinuity
Figure 9 shows the performance of ERA5 and ERA5-Land after the last ERA5 discontinuity (2005–2020). Only spatially representative stations that are not assimilated by ERA5 are used (152 of 527). The ERA5 estimations are mostly unbiased for SD, with the annual IQR bias within in most regions. Large positive biases only remain over the mountains (Rocky Mountains, southern Russia ranges), which could be related to not assimilating IMS snow above 1500 m. On the contrary, ERA5-Land constantly overestimates SD in most regions, with a bias IQR of [0.8,2.9 cm]. Despite its finer resolution, ERA5-Land quality also degrades in the mountains. Regarding the absolute error, ERA5 shows an RMSE below 1.5 cm in most stations that increases up to 12 cm in mountain stations. On average, 82.6 % of daily ERA5 snow depth values meet the GCOS accuracy requirements, while this number decreases to 10.5 % for ERA5-Land.
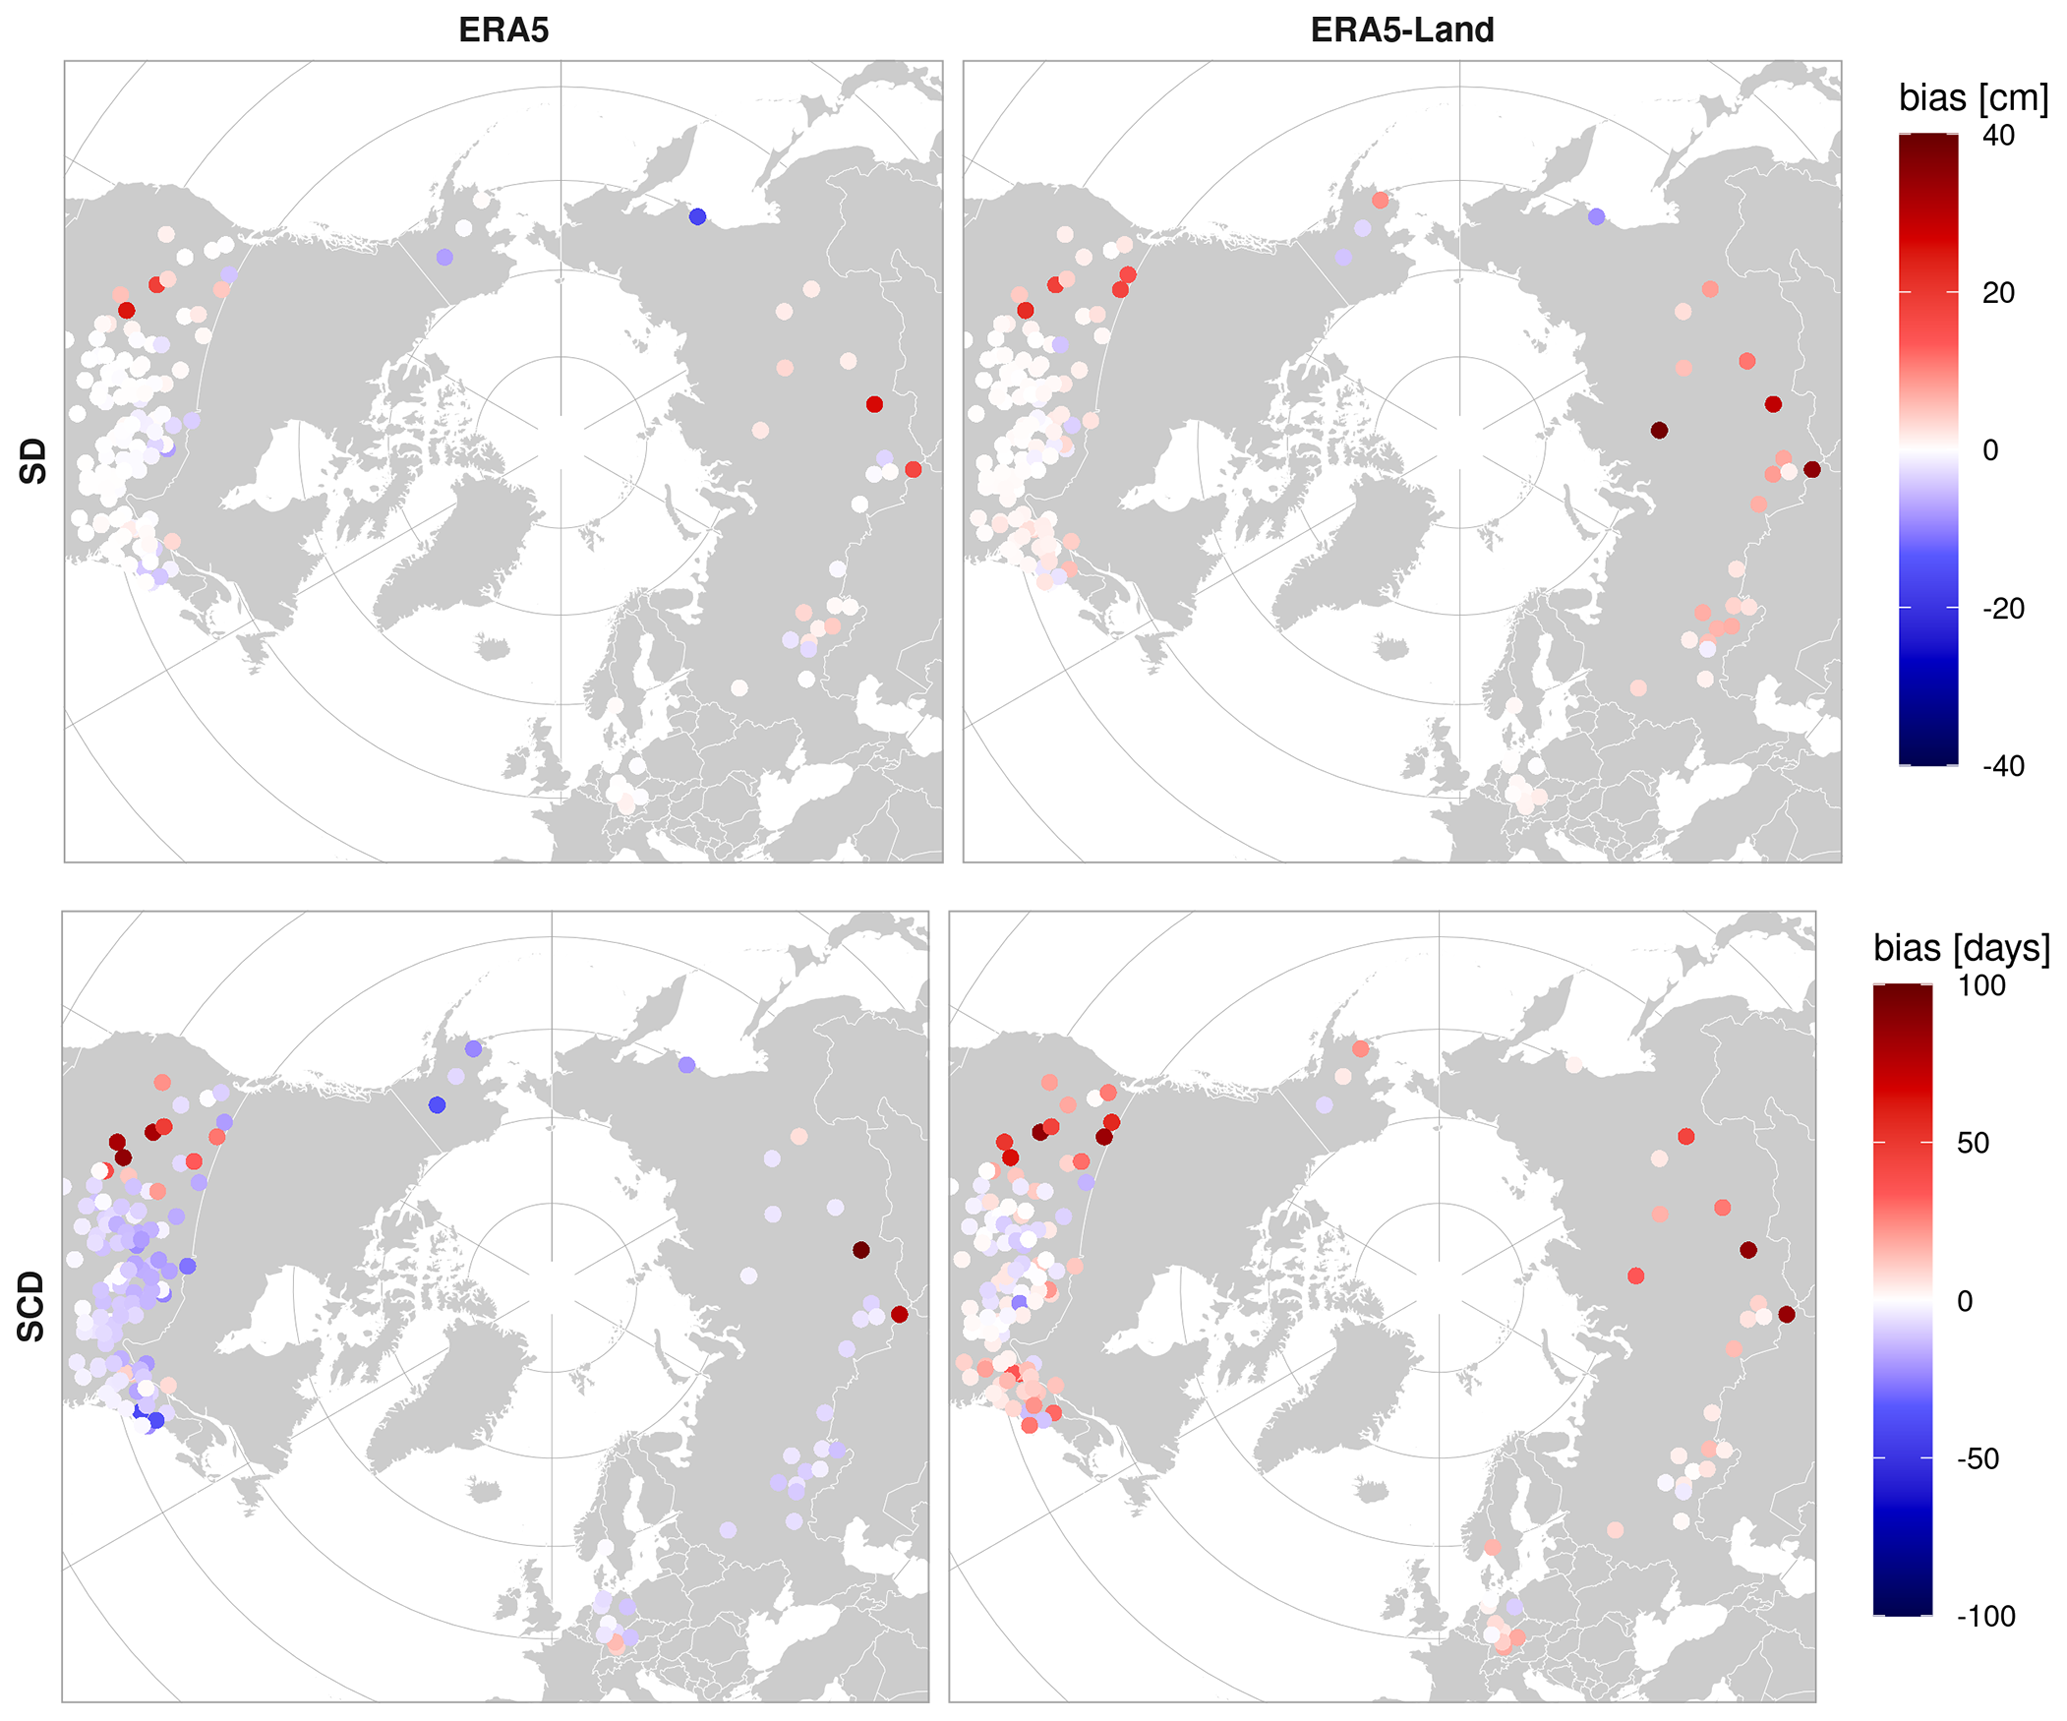
Figure 9Bias (product – station) in snow depth (SD) and snow cover duration (SCD) after the last ERA5 discontinuity (2005–2020). Stations assimilated by ERA5 have been excluded.
In SCD, ERA5 presents a constant underestimation (IQR) of around , while ERA5-Land keeps overestimating [2.4,11.2 d]. As mentioned above, the SCD bias strongly depends on the threshold used to convert SD to SC. Both ERA5 and ERA5-Land use a threshold (5 cm) larger than the one applied to the stations (2.5 cm). This could explain why ERA5 has a negative SCD bias despite having an unbiased snow depth. Indeed, when the ERA5 threshold is applied to the stations (Fig. A2), the ERA5 SCD bias is close to zero in the three networks. We could be tempted to use the same threshold for in situ and satellite data. However, the thresholds applied by the products need to be validated as well, and we can only do it by deriving independent thresholds for the station measurements. In this study, we have used RIHMI visual observations of snow cover in the station, but other data sources such as high-resolution satellite imagery could be used.
We investigated this issue further with a sensitivity analysis that evaluates how the SCD bias changes with different snow depth to snow cover thresholds (Fig. A2). The magnitude of the SCD bias is similar between networks, suggesting a good consistency between their measuring protocols. However, the magnitude of the SCD bias strongly varies between products. When a threshold of 2.5 cm is used, the mean SCD bias varies as follows: 24.8 d (NOAA CDR), 14.3 d (IMS), 8.0 d (ERA5-Land), and −6.7 d (ERA5). These differences are the result of the different thresholds applied by the products, as well as their different snow depth biases (in the case of reanalysis). Orsolini et al. (2019) already pointed out that the different thresholds applied by reanalysis datasets were one of the main limitations for inter-comparing them. The sensitivity analysis also shows that changing the threshold by 1 cm leads to changes in the annual SCD bias of around 2–3 d. These changes are constant between products but vary between networks (ECCC=2.8–4.3 d cm−1, GHCN=1.8–2.1 d cm−1, RIHMI=2.6–3.2 d cm−1) due to the different snow conditions in each region. Stations with many SD values near the threshold will be more affected by a change in the threshold.
3.4 Snow cover trends in the Northern Hemisphere
Linear decadal trends in SD and SCD were calculated annually and seasonally over the period 1955–2015 using data from the ground stations (Fig. 10 and Table 3). The temporal representativeness of the linear trends was further analyzed by plotting the temporal evolution of the anomalies per spatial region (Figs. A9 and A10).
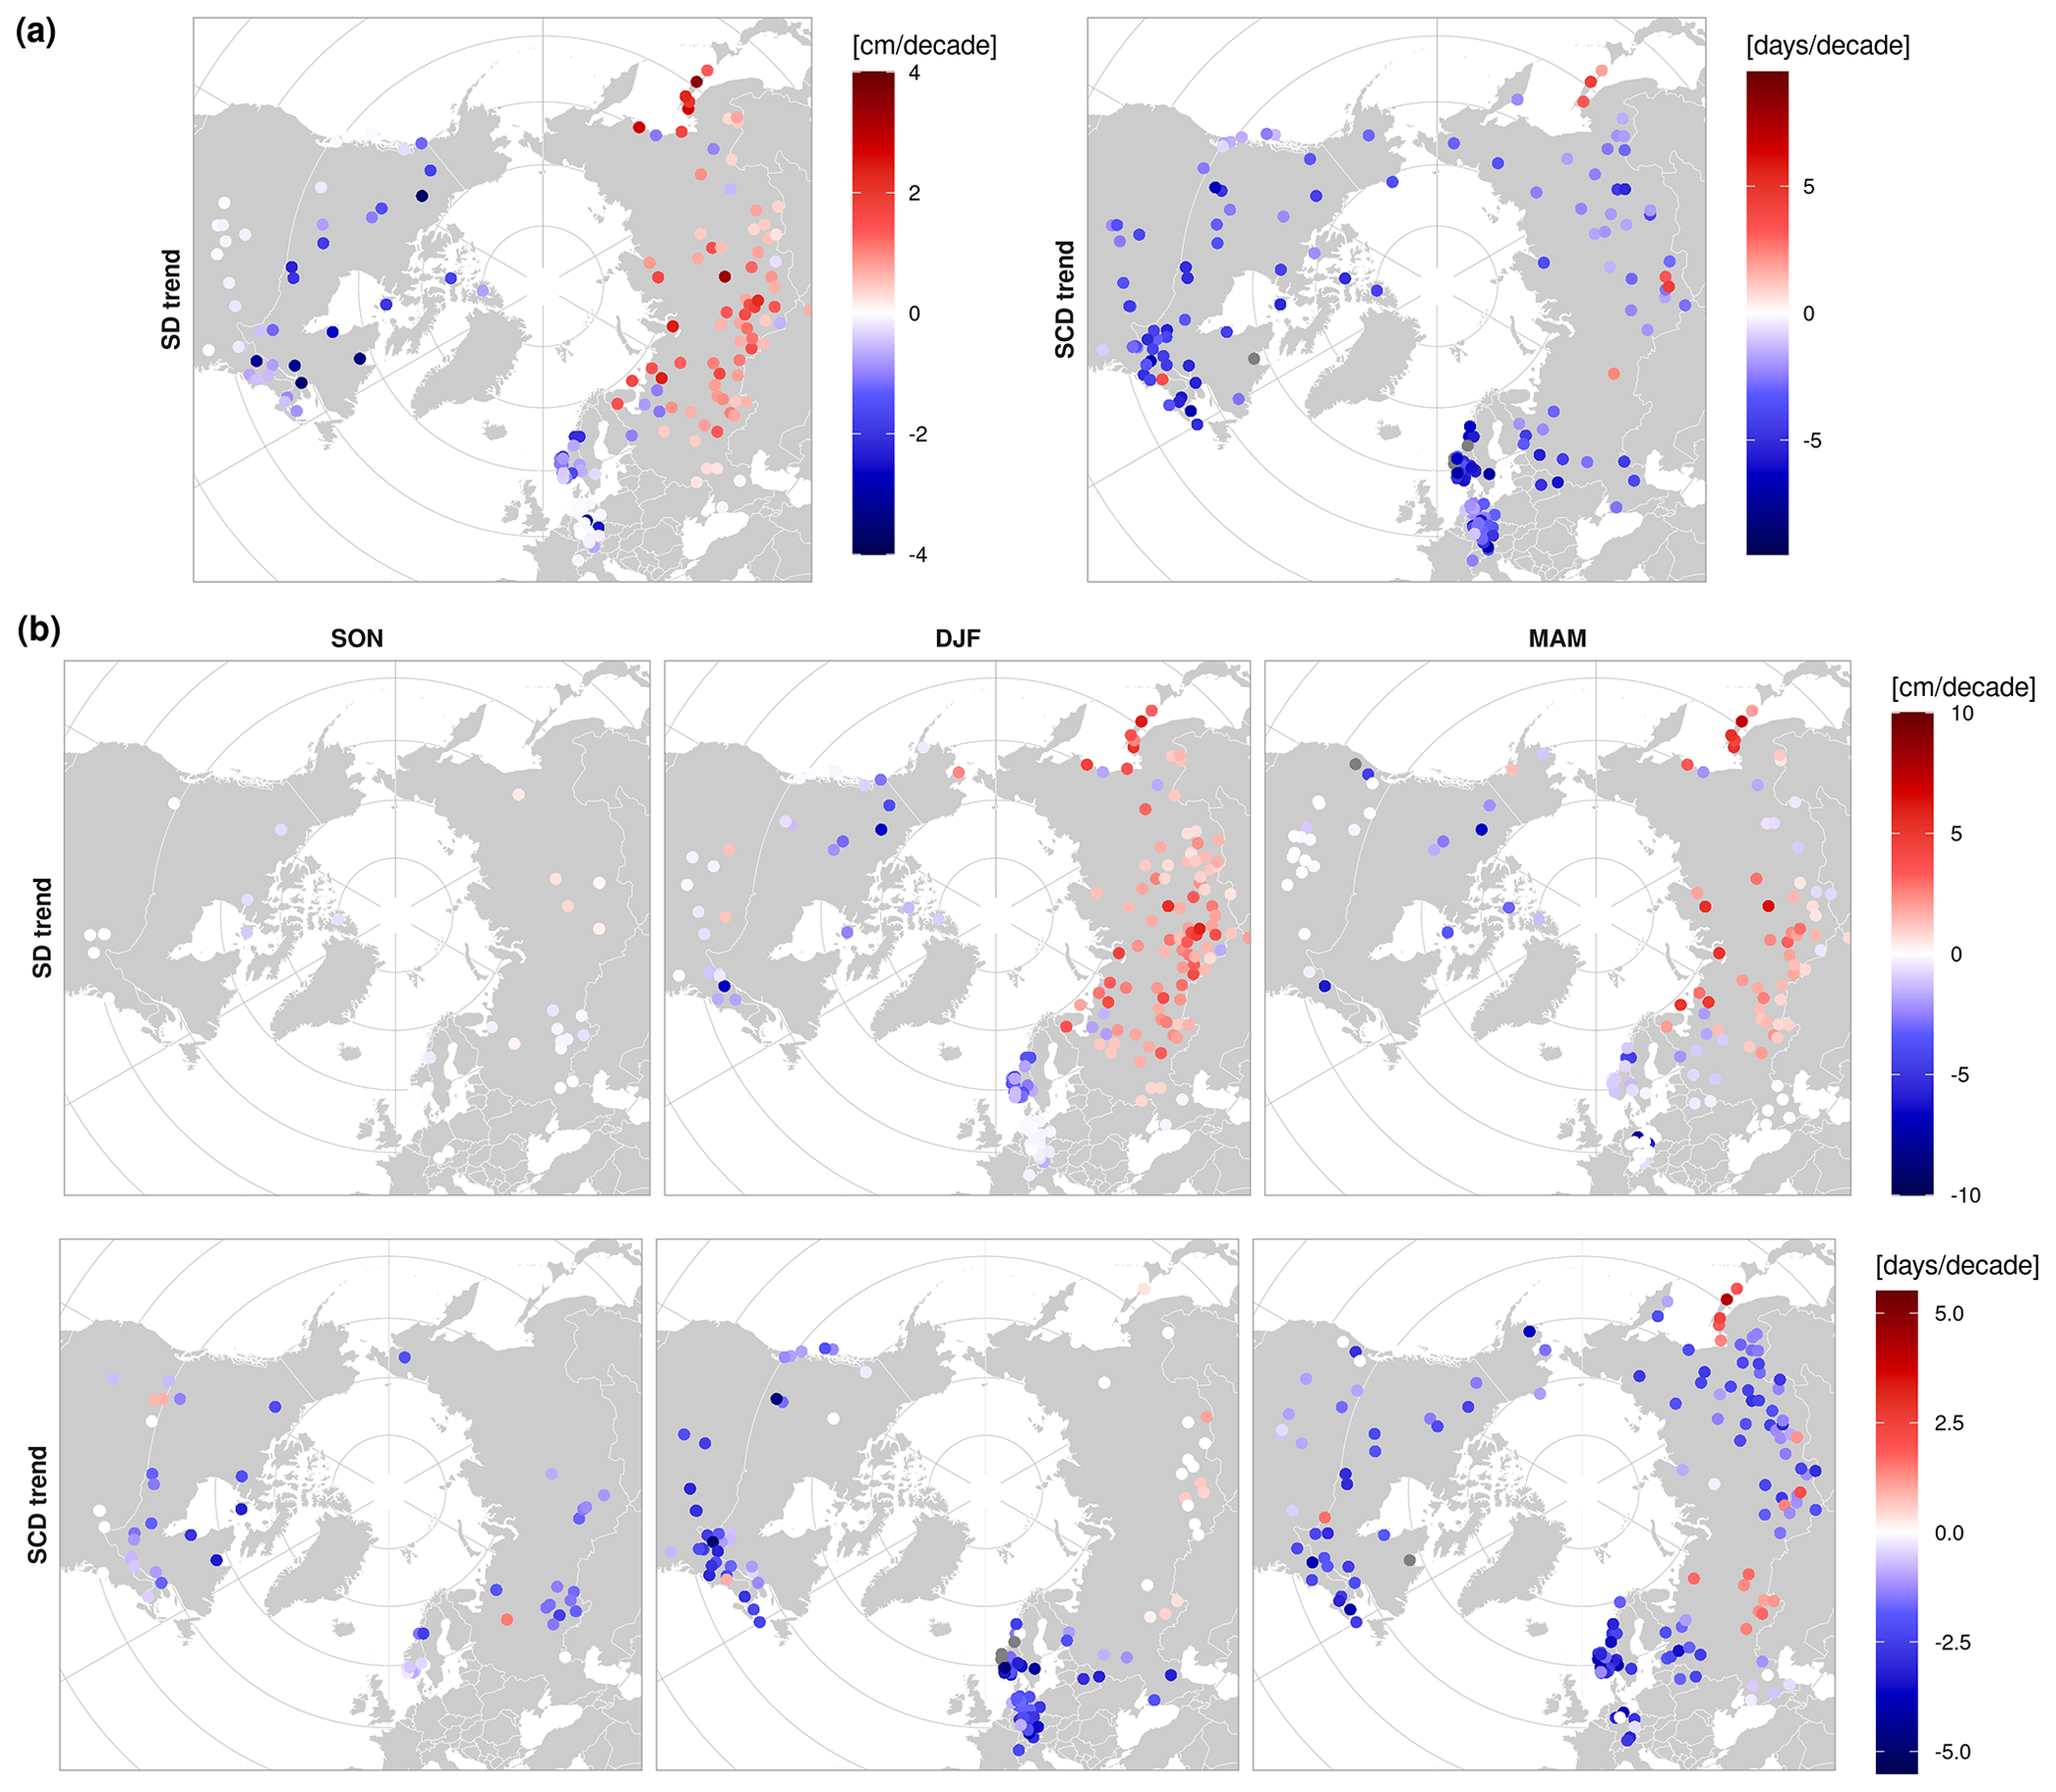
Figure 10(a) Annual and (b) seasonal decadal trends in snow depth (SD) and snow cover duration (SCD) from 1955 to 2015 based on in situ measurements. Only statistically significant trends (p value<0.05, Mann–Kendall) are shown.
Table 3Annual and seasonal decadal trends (median with its 95 % CI) in SD [cm per decade] and SCD [d per decade] from 1955 to 2015. Only statistically significant trends (p value<0.05, Mann–Kendall) are shown. N depicts the number of stations with significant trends in each region. The median was not calculated in regions that have fewer than five stations with significant trends.
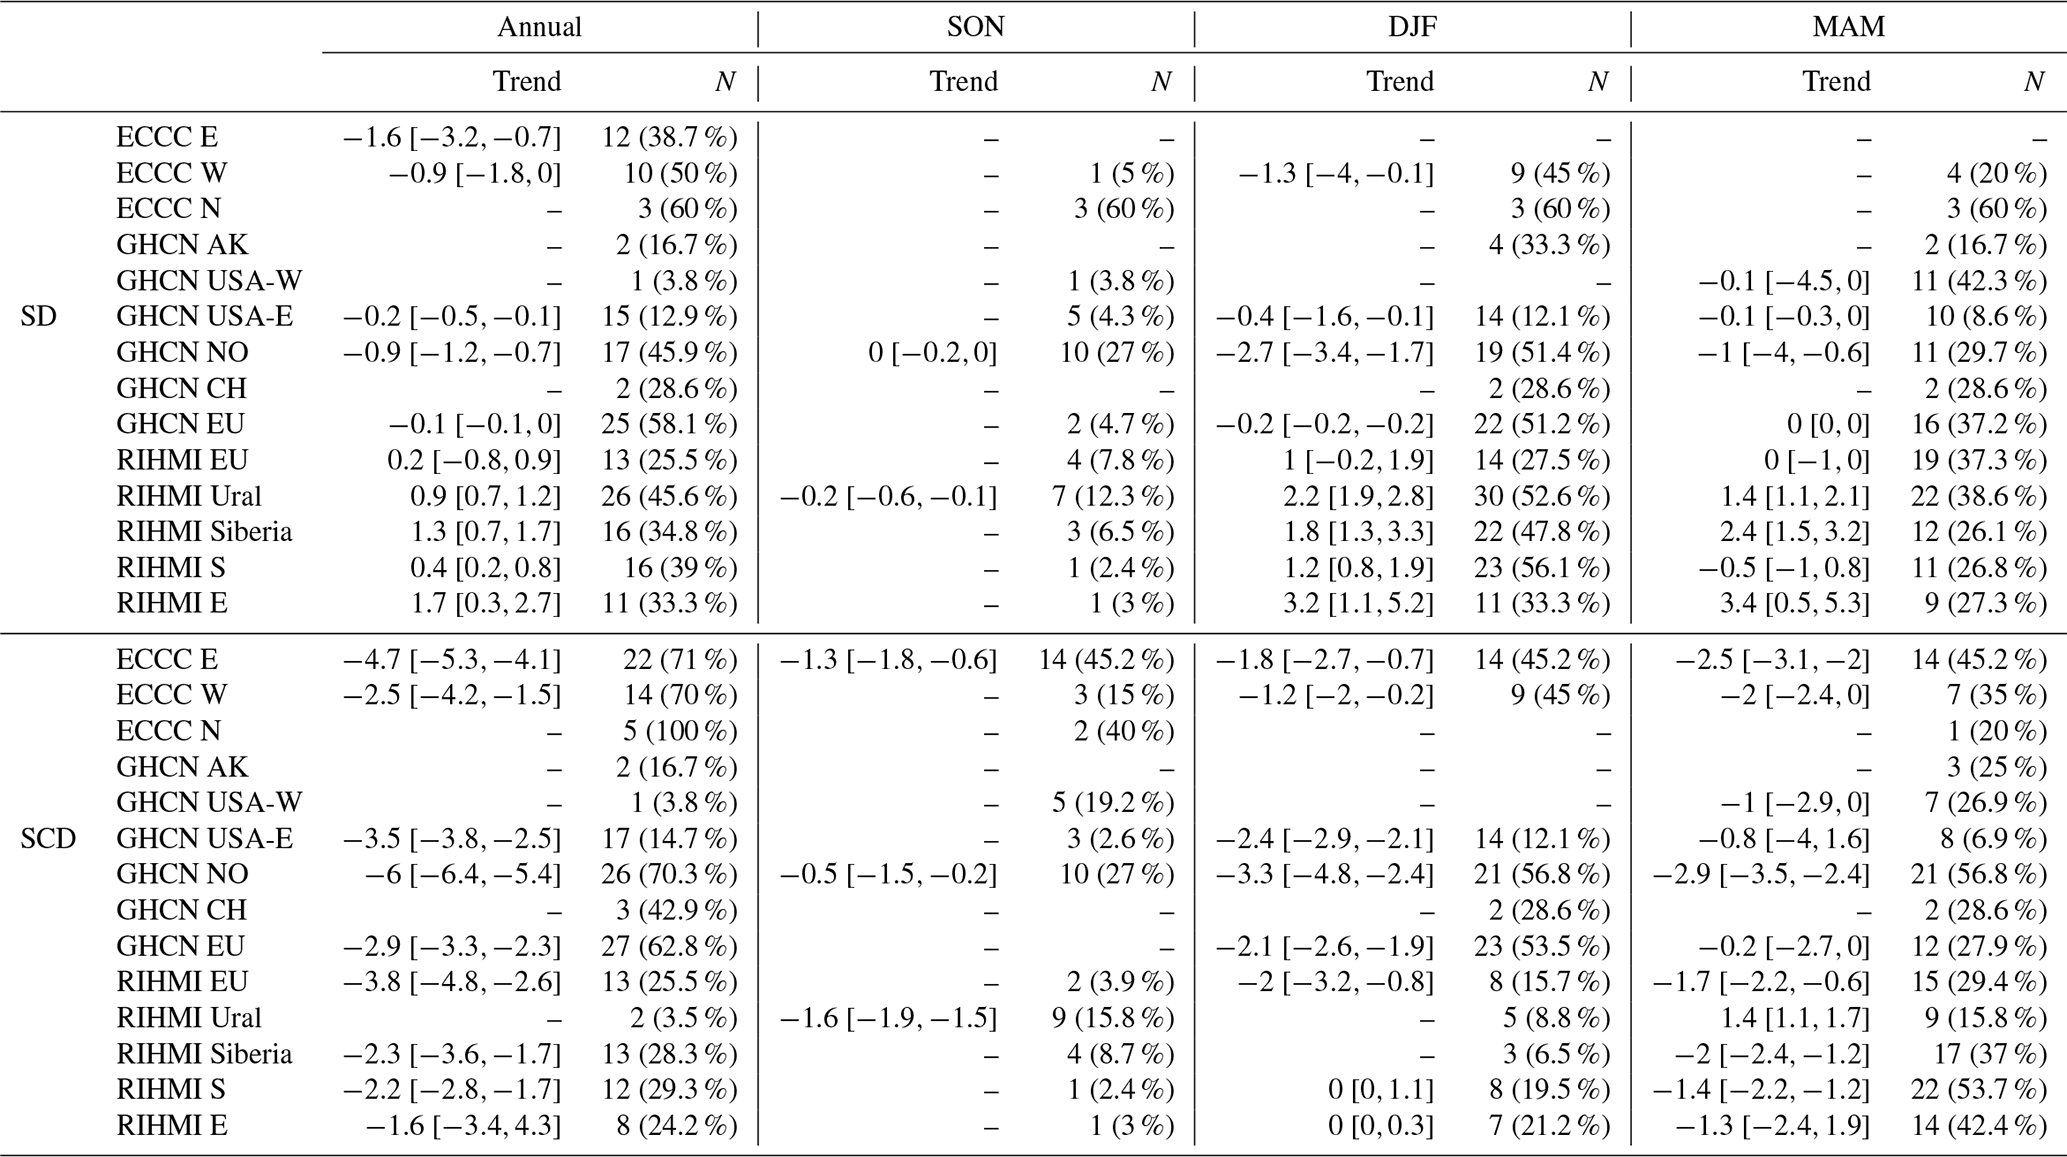
The SD trends show large spatial variability. Significantly negative trends are observed over Europe (Norway – −0.9 cm per decade, central Europe – −0.1 cm per decade) driven by a strong decrease in winter SD, particularly between 1980–1990. On the contrary, significantly positive SD trends are observed in most of Russia, specifically over the Ural region (+0.9 cm per decade), Siberia (+1.3 cm per decade), and the Sea of Okhotsk (+1.7 cm per decade), driven by a strong increase of both winter and spring snow depth. These trends agree with those reported by Brown et al. (2017) for the Russian Arctic over the 1966–2014 period (SDmax, +0.7 cm per decade). However, as mentioned by Brown et al. (2017), a tipping point is observed around 2000 that reverses the SD increase during the latest years in some Russian regions (e.g., European Russia, Ural region). Negative trends in SD are also observed in eastern USA and in most of Canada (−0.9 to −1.6 cm per decade)
The SCD trends are more spatially homogeneous. A predominantly negative SCD trend of around d per decade] is observed globally, driven by a strong negative trend during the melting season. The largest reductions in annual SCD are observed over Europe (Norway – −6 d per decade, central Europe – −2.9 d per decade, European Russia – −3.8 d per decade). In Russia, most regions experience a decrease in annual SCD despite their positive SD trends (Siberia – −2.3 d per decade, southern Siberia – −2.2 d per decade). Only a few stations in the Ural region and the Sea of Okhotsk show a longer snow season during the last 70 years. When the trends are recalculated for the period 1981–2020, an acceleration of the SCD decrease is observed as well as an increasing importance of the later snow onset in the annual SCD trends. Again, few stations in eastern USA show significant trends. The low number of significant trends compared to that reported by Knowles (2015) could be explained by a recent recovery in winter and spring SCD starting around 2000 (Fig. A10). Still, the few significant trends observed in the USA are predominantly negative with some exceptions around the Great Lakes that Knowles (2015) attributed to an increased precipitation pattern. The SCD trends are also consistently negative in most of Canada (−1.5 to −5.3 d per decade), driven by negative DJF trends in coastal regions and negative MAM trends in inland and polar regions.
The large spatial variability in SD trends is explained by the non-linear interactions between temperature and precipitation (Brown and Robinson, 2011). At high latitudes, increasing temperatures lead to increasing precipitation due to a moister climate (Thackeray et al., 2019), but snowfall depends on the precipitation phase as well. In relatively warmer climates and maritime regions (e.g., central Europe, Scandinavia, European Russia), negative SD trends could be related to a shift in the form of precipitation towards a rainfall-dominated winter (Luomaranta et al., 2019). On the contrary, in colder and drier climates such as Siberia, snow accumulation is limited by moisture availability (Kunkel et al., 2016), so the positive SD trends may be due to warmer and moister weather (Bulygina et al., 2009) and/or to more extreme snow events, which are more likely to occur below the freezing point (Kunkel et al., 2016). Despite these heterogeneous SD trends, SCD trends are consistently negative globally. The SCD reductions from 1955 to 2015 are mainly driven by an earlier melt that is strongly correlated with the increasing spring temperatures amplified by the snow-albedo feedback (Brown et al., 2017; Luomaranta et al., 2019; Bulygina et al., 2009; Matiu et al., 2021). In regions such as Europe, both SD and SCD are decreasing, with the trend towards shallow snow depth amplifying the shorter snow season. In Russia, spring SCD is also decreasing despite the positive trends in SD. This means that the spring melt driven by warming temperatures overrides any increase in snow accumulation during winter.
Larger variability has been reported for SCD trends during the snow onset season (Brown et al., 2017). However, as also recently suggested by Mudryk et al. (2020), this study evidences the increasing importance of negative SON trends in regions such as Europe, Russia, and the Rocky Mountains, where they have a higher impact than spring trends during recent years.
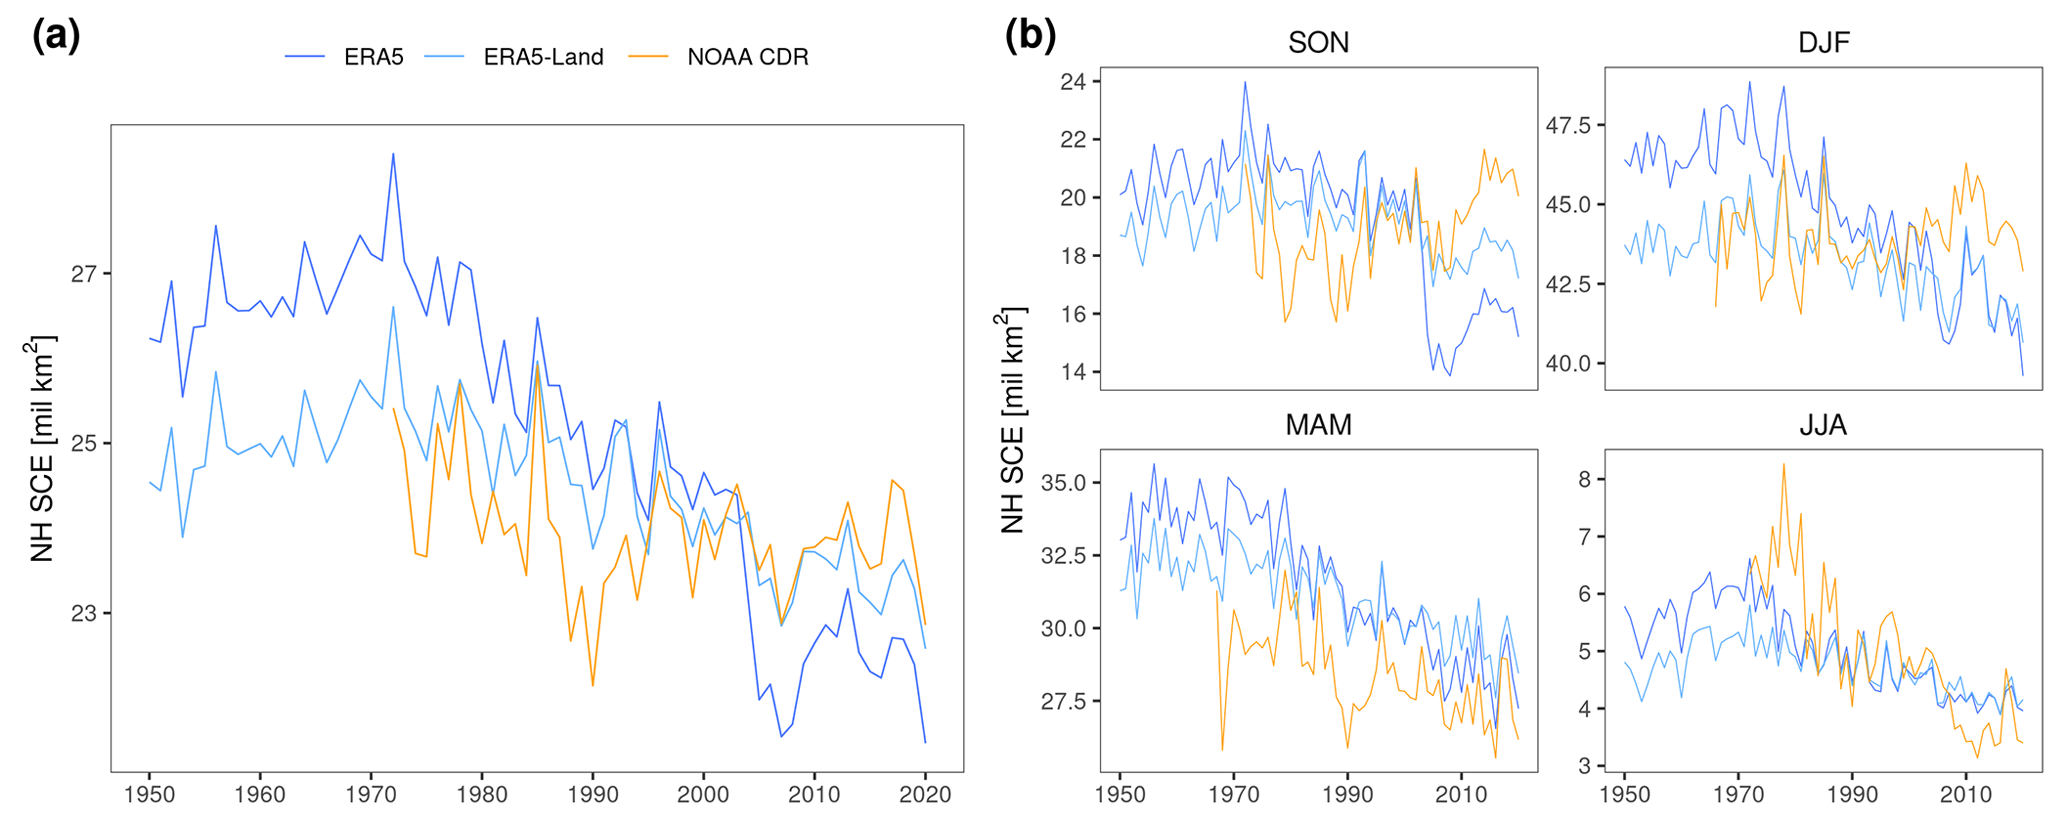
The Northern Hemisphere presents an average annual SCE of 23.9×10⁶ km2 (NOAA CDR) over the 1972–2020 period (the common period between the three products). The three products show an annual decrease in NH SCE (Fig. 11), though the SCE trends should be interpreted cautiously, taking into account the trends and discontinuities discussed in Sect. 3.2. The NOAA CDR is the product typically used for assessing the NH SCE trends. It shows the smallest trend (1972–2020) in annual SCE overall ( km2 per decade, −0.63 % per decade), which is driven by a significant decrease in MAM ( km2 per decade, −2.13 % per decade) and JJA ( km2 per decade, −14.2 % per decade). These seasons are when most snow melts, and again, these reductions are strongly related to the increasing temperature and the snow-albedo amplification. The small decrease in annual SCE compared to that in MAM and JJA is explained by the SCE positive trends of +0.62 and km2 per decade in SON and DJF, respectively. This is due to the artificial positive trend in SON and DJF SCD described in Sect. 3.2.2. In this sense, Derksen (2014) estimated that the artificial trend in October SCE for this product could be around 1×10⁶ km2 per decade, which would revert the sign of the SON trend. Other snow satellite products such as JAXA's GHRM5C (Hori et al., 2017) have also reported negative trends of −0.94 and km2 per decade for SON and DJF, respectively, during 1980–2020. Negative trends have been observed as well in SON for the group of stations used in this study. All of this corroborates the underestimation of the snow cover retreat in the fall and winter seasons by the NOAA CDR product.
The ERA5-Land reanalysis has better stability than ERA5, showing a small negative trend caused by the ERA5 atmospheric forcing. This is somewhat corroborated in terms of SCE, with ERA5-Land showing just a slightly smaller trend in MAM than NOAA CDR (−0.54 vs. km2 per decade). On the contrary, ERA5 strongly overestimates the SCE decrease throughout all seasons, showing the largest negative trend in annual SCE ( km2 per decade). Among the three ERA5 discontinuities detected, the assimilation in 2004 of IMS snow products has the largest impact overall, leading to a large step discontinuity of around −13 % (annual SCE) and −30 % (SON SCE) in just 1 year (Fig. 11b). As discussed above, the large impact of IMS on the onset and melting period is explained by how this product is assimilated into the model. Overall, ERA5 should be avoided to analyze the NH SCE trends before 2004. The ERA5-Land reanalysis has better stability but still overestimates the actual snow cover retreat.
Global reanalyses appear as an increasingly appealing option for climate studies due to their long-term global coverage of multiple atmospheric, land, and ocean variables. Great efforts have been made lately to extend backward global 4D-Var reanalyses with the release of ERA5 back extension (1950–present) and JRA-55 (1958–present). The core of reanalysis products is the data assimilation system that allows combining numerical weather prediction (NWP) simulations with in situ observations and satellite products. The number of available observations has increased exponentially during the latest years, improving the accuracy of reanalysis estimations and bringing them closer to satellite-based products. However, assimilating new observations creates a trade-off between accuracy and stability. For applications requiring high accuracy such as NWP initialization, more weight is given to new observations in order to provide the best possible estimations. However, this can introduce temporal inconsistencies in the data records, as observed in ERA5. These challenges increase even more when trying to extend backward reanalysis before the satellite era.
In the case of snow, the present study reveals the high dependence of the ERA5 accuracy on the assimilated snow observations. After 2004, when ERA5 assimilates the IMS snow product and more than 4000 snow stations, it clearly outperforms ERA5-Land, a specific land reanalysis with a much finer spatial resolution (9 vs. 31 km) but without direct assimilation of observations. The strong dependence of the bias on the assimilated observations created a significant negative trend in ERA5 far larger than the 10 mm stability limit of GCOS, particularly in winter. Therefore, the use of ERA5 snow parameters for climate studies before 2004 should be avoided as it artificially overestimates the decrease of all snow-related parameters (SD, SC, SCE). Correcting the systematic bias may be possible (Mortimer et al., 2020) and highly recommendable if using ERA5 before 2004. However, the study shows that some changes in the data assimilation also created discontinuities in the random error, whose correction is not so simple. The potential implications for other ERA5 snow-related parameters such as surface albedo or hydrological variables have not been evaluated in this study but could be significant in snow-covered regions as well.
Satellite products generally provide more accurate and stable estimates, but their temporal coverage is limited to that of the satellite instrument. Different satellite instruments can be combined to extend the temporal coverage of the products which alters the stability of the product during the transition period. The probability of adding artificial trends increases even more in products that assimilate a non-uniform number of satellite data such as IMS or NOAA CDR, similar to the reanalysis assimilation system. In any case, the temporal coverage of most satellite products is limited to the start of the satellite era. The NOAA CDR was able to extend its coverage up to 1969 by combining observations from different sensors and products with manual processing. This makes it the longest satellite CDR available and the one typically used in climate studies. However, the present study corroborates the existence of a positive artificial trend around in SON (mostly over Russia) and reveals the presence of a similar trend in DJF (over Europe and eastern USA). Both trends are most likely related to an improved detection of the snow onset due to the increasing number of satellite data ingested. This artificial trend explains the SCE recovery observed in SON and DJF, which opposes the trends observed with other satellite products and station measurements in these seasons. Therefore, NOAA CDR estimations in these seasons should be corrected to obtain reliable results (e.g., Hori et al., 2017). Moreover, using multi-datasets instead of a single product to calculate snow cover trends should be preferred, as also suggested by Mudryk et al. (2020). Note that despite multi-datasets being much more robust, characterizing the stability of the individual products is still critical to obtain stable ensembles, particularly when different products share the same instabilities (e.g., ERA5 and ERA5-Land).
This study evaluates the temporal stability of ERA5 (1950–2020), ERA5-Land (1950–2020), and NOAA CDR (1968–2020) for analyzing snow trends. Despite being some of the longest satellite and reanalysis datasets available and being extensively used for climate application, the study reveals the existence of different artificial trends and discontinuities in the three products that compromise their temporal stability. In the reanalysis, the assimilation of more observations into the model creates a trade-off between accuracy and stability. ERA5 presents the worst temporal stability overall due to three negative stepwise discontinuities caused by the assimilation of new observations, but it shows the best accuracy after 2004 when the amount of assimilated data is the largest. By contrast, ERA5-Land does not assimilate data showing better stability but worse accuracy.
The NOAA CDR presents a positive artificial trend in SON and DJF. These results provide another line of evidence supporting the problematic fall trends in the NOAA CDR and reveal that a similar trend appears in Europe of eastern North America during winter. Despite the numerous studies highlighting the inconsistency of NOAA CDR fall trends with in situ measurements and with other datasets, some studies keep claiming a positive snow cover trend in fall based solely on NOAA CDR data (e.g., Cohen et al., 2021). Using the NOAA CDR without correction in SON and DJF should be avoided. The NOAA CDR could still be valid after correction or in other regions and seasons (e.g., MAM) not affected by artificial trends.
We also analyze the NH snow trends (1950–2020) based on in situ measurements. The analysis shows a global decrease in SCD driven mostly by an earlier melt in spring which is directly linked to the snow-albedo feedback. However, a decrease due to a later snow onset in fall is also observed during the last years. In warmer regions such as Europe, SCD decrease is aggravated by a decreasing snow depth, which could be related to the decreasing amount of precipitation as snowfall. In drier regions such as Russia, SCD also decreases (except in the Ural region and the Sea of Okhotsk) despite the increase in snow depth observed over Russia due to warmer and moister weather.
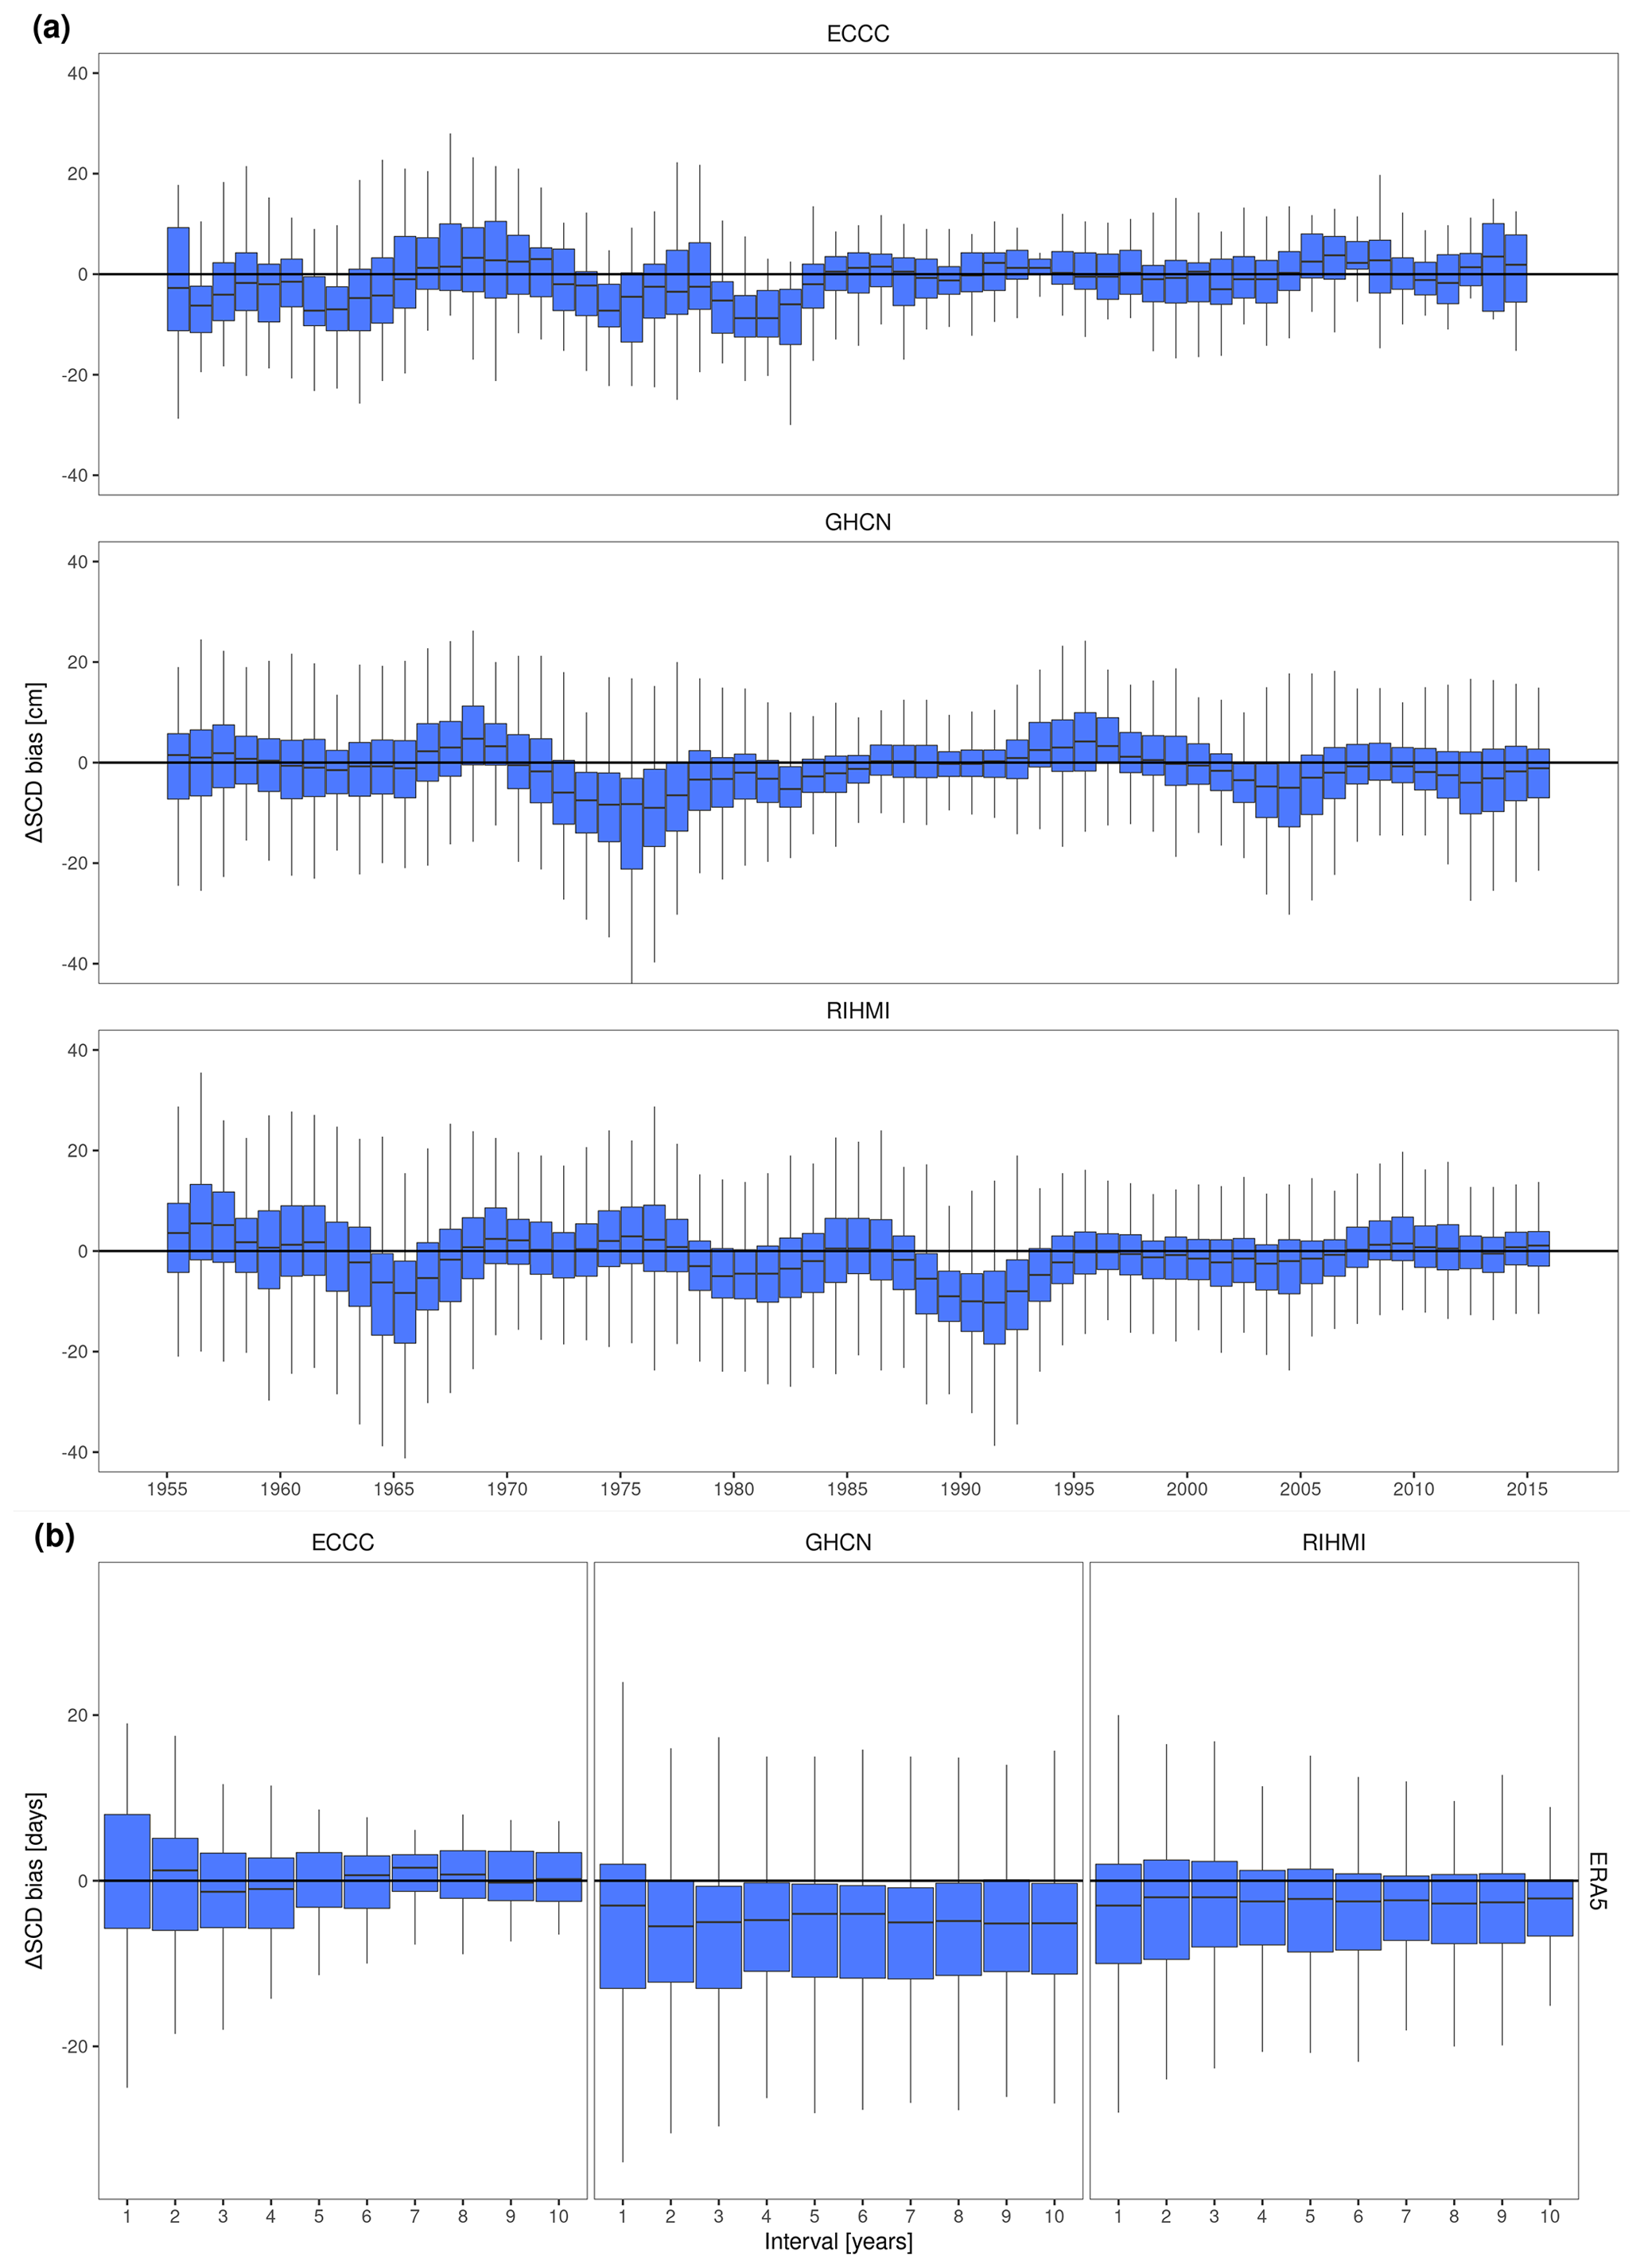
Figure A1Sensitivity analysis to determine (a) the exact year of step discontinuities and (b) the interval used to estimate the magnitude of the discontinuity. (a) Change in ERA5 ΔSCD bias (before – after) when the step year varies from 1955 to 2015. (b) Change in ERA5 ΔSCD bias (before – after) during the 2004 discontinuity when the number of years used for its calculation (interval) is varied from 1 to 10.
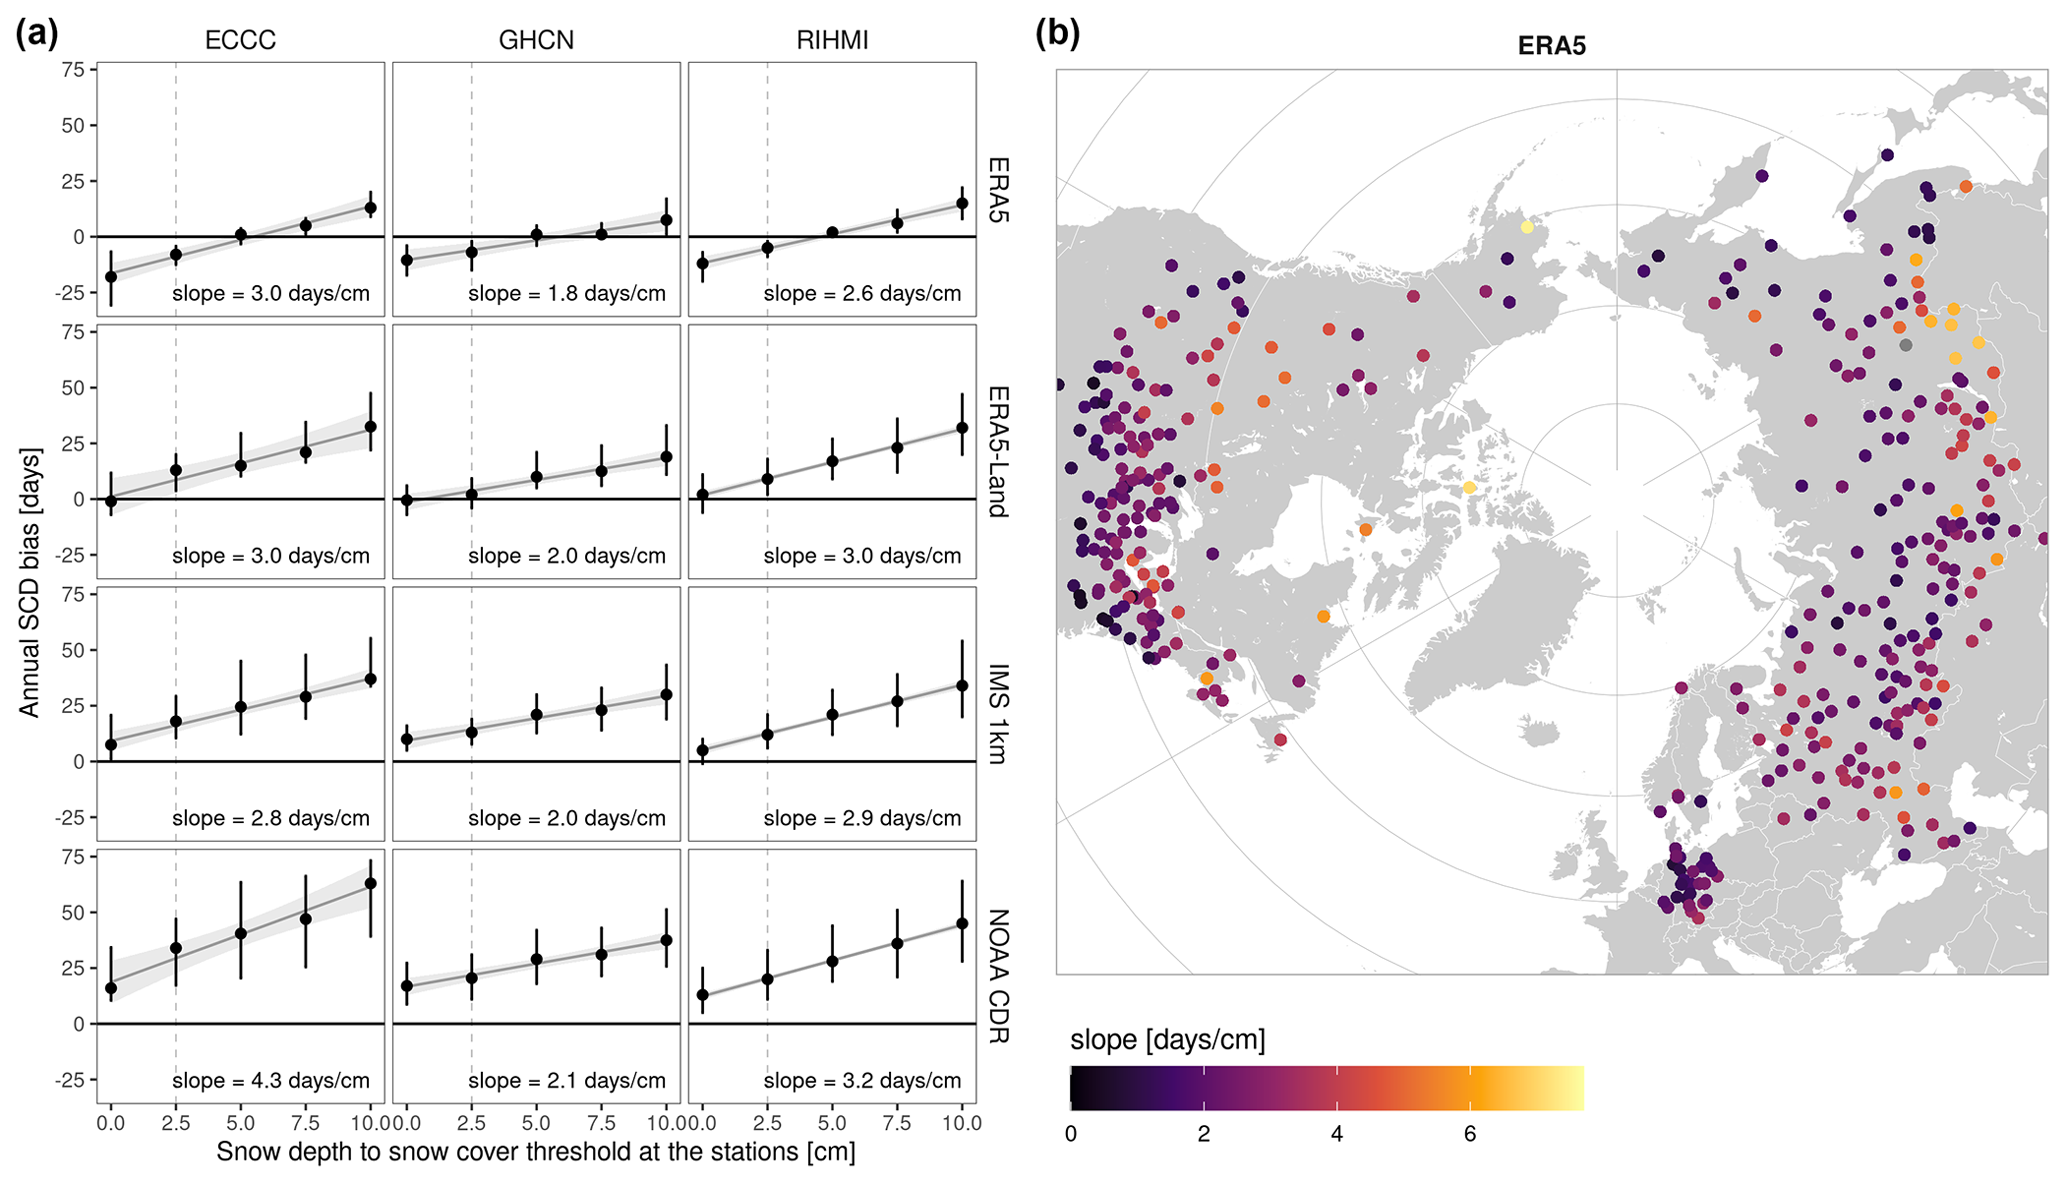
Figure A2Sensitivity of the snow cover duration (SCD) bias on the snow depth to snow cover threshold used at the stations. (a) Variation of the SCD bias (median ± interquartile range) per product and network when changing the threshold from 0 to 10 cm by intervals of 2.5 cm. (b) Spatial analysis of the rate of change [d cm−1] for ERA5. Both figures are derived with data from 2015.
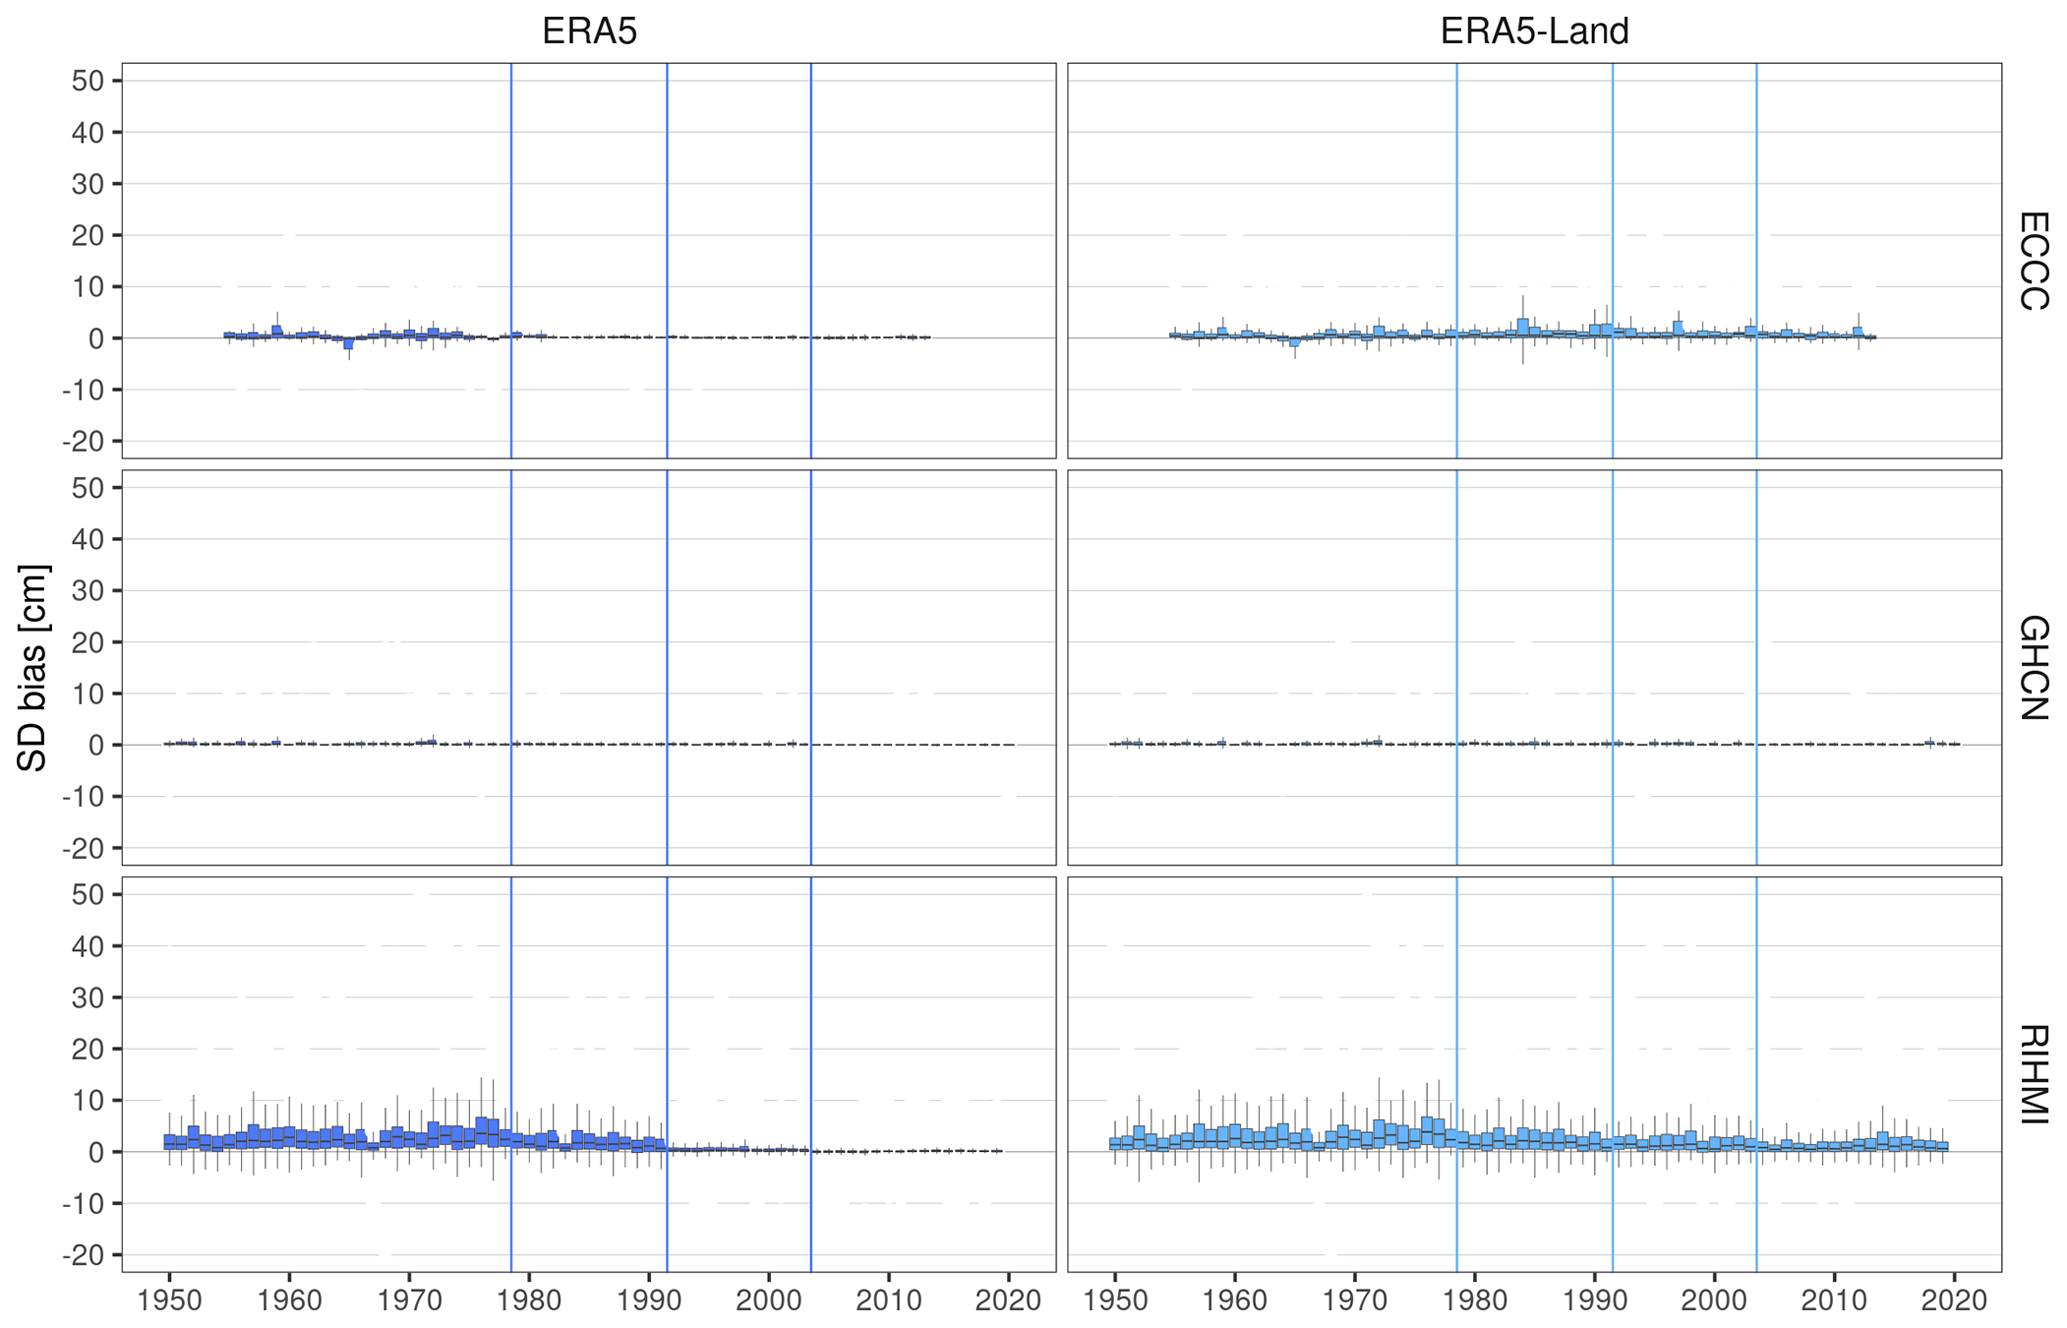
Figure A3Temporal stability of the bias (product – station) in snow depth (SD) per product and network during SON. Vertical lines show the years when the potential discontinuities in each product occur.
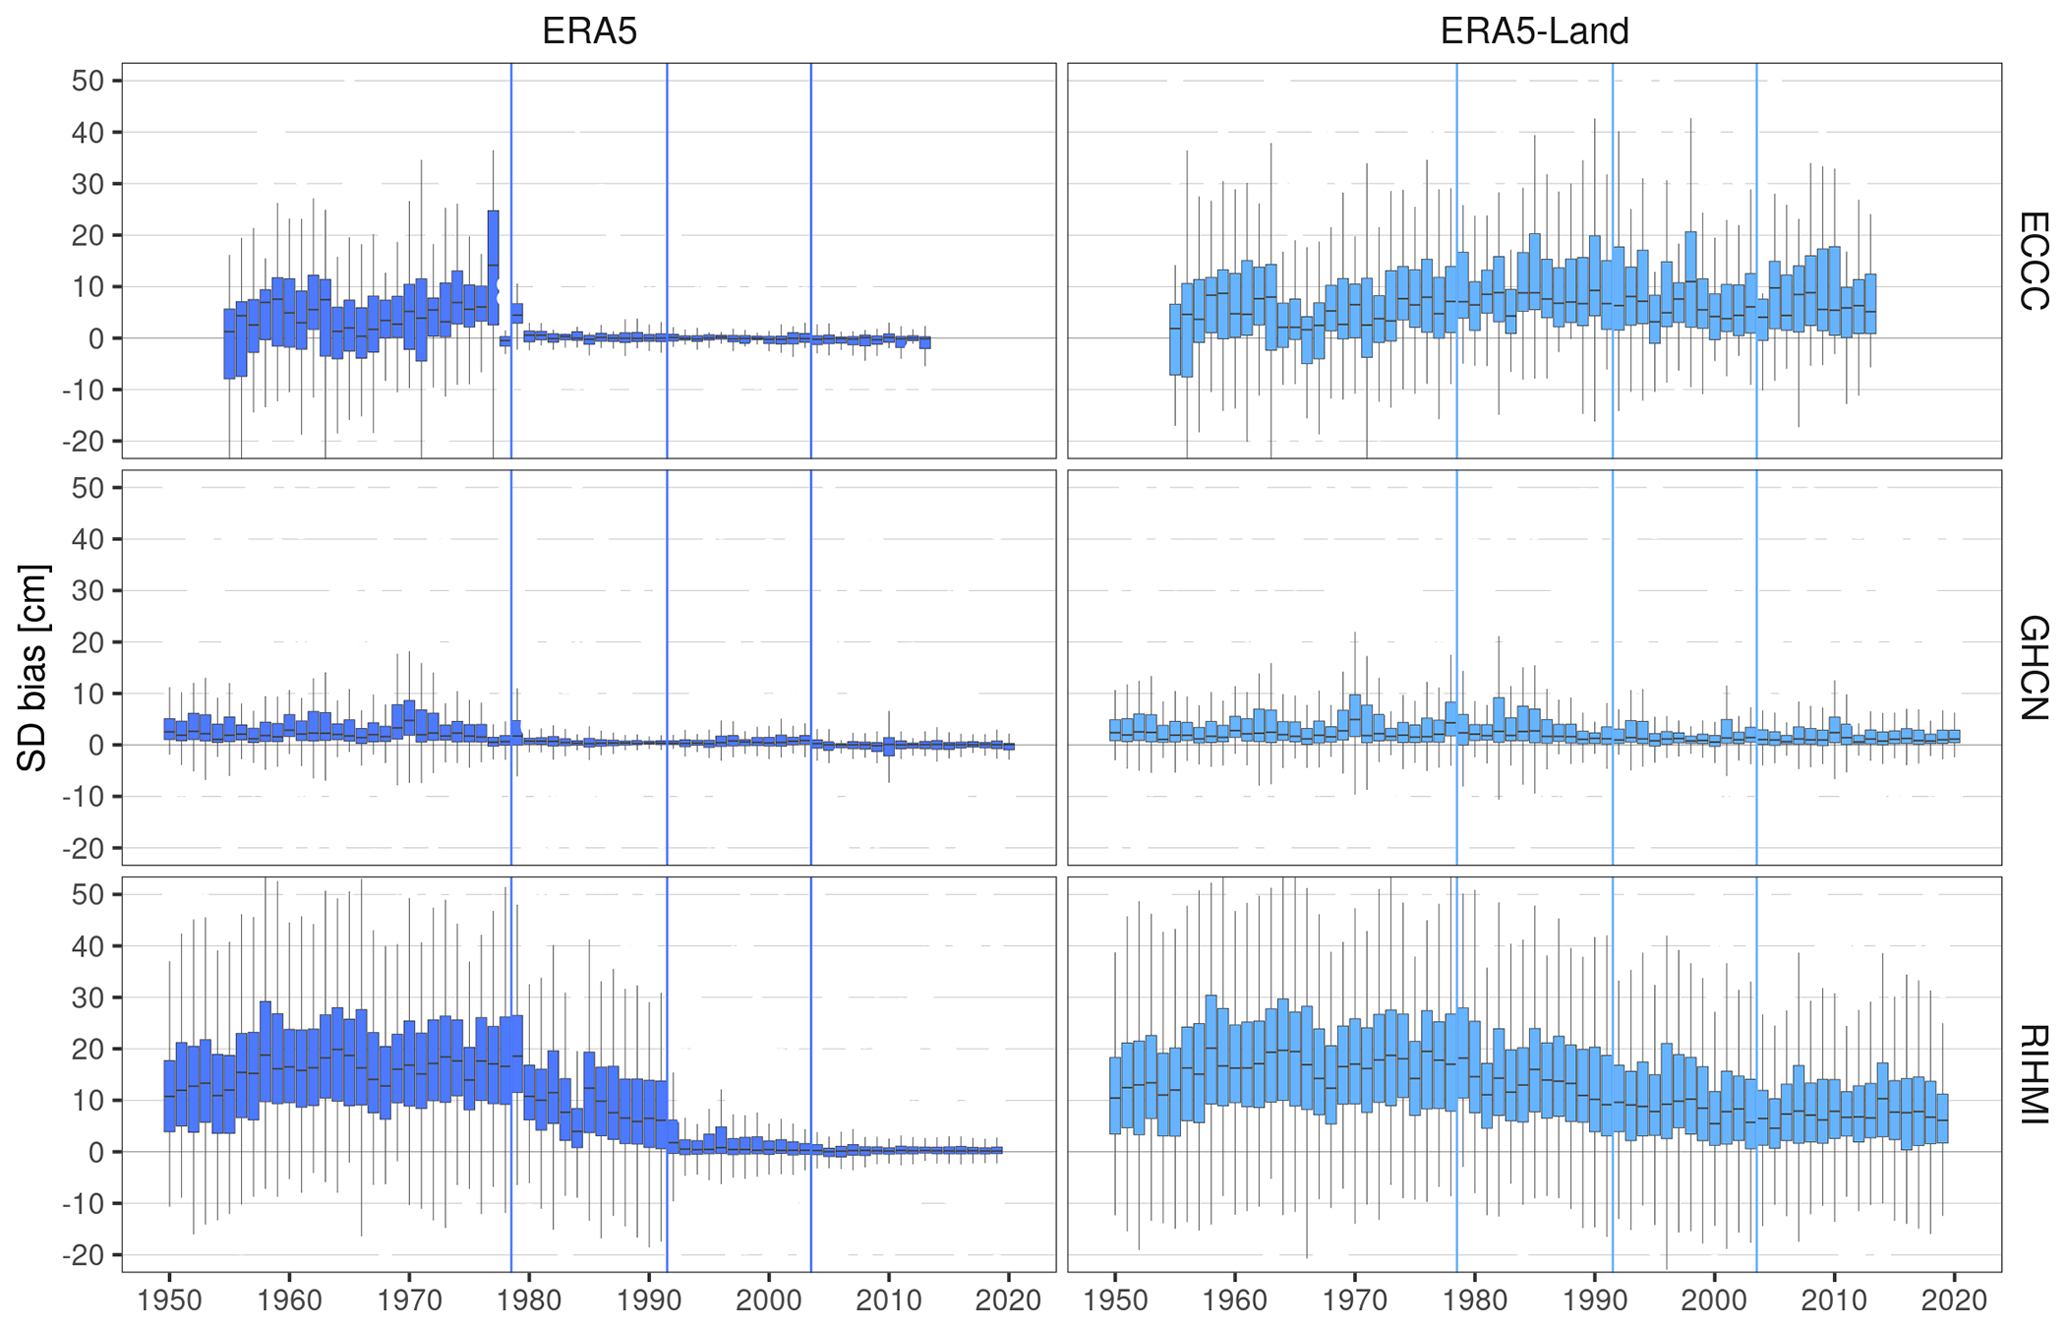
Figure A4Temporal stability of the bias (product – station) in snow depth (SD) per product and network during DJF. Vertical lines show the years when the potential discontinuities in each product occur.
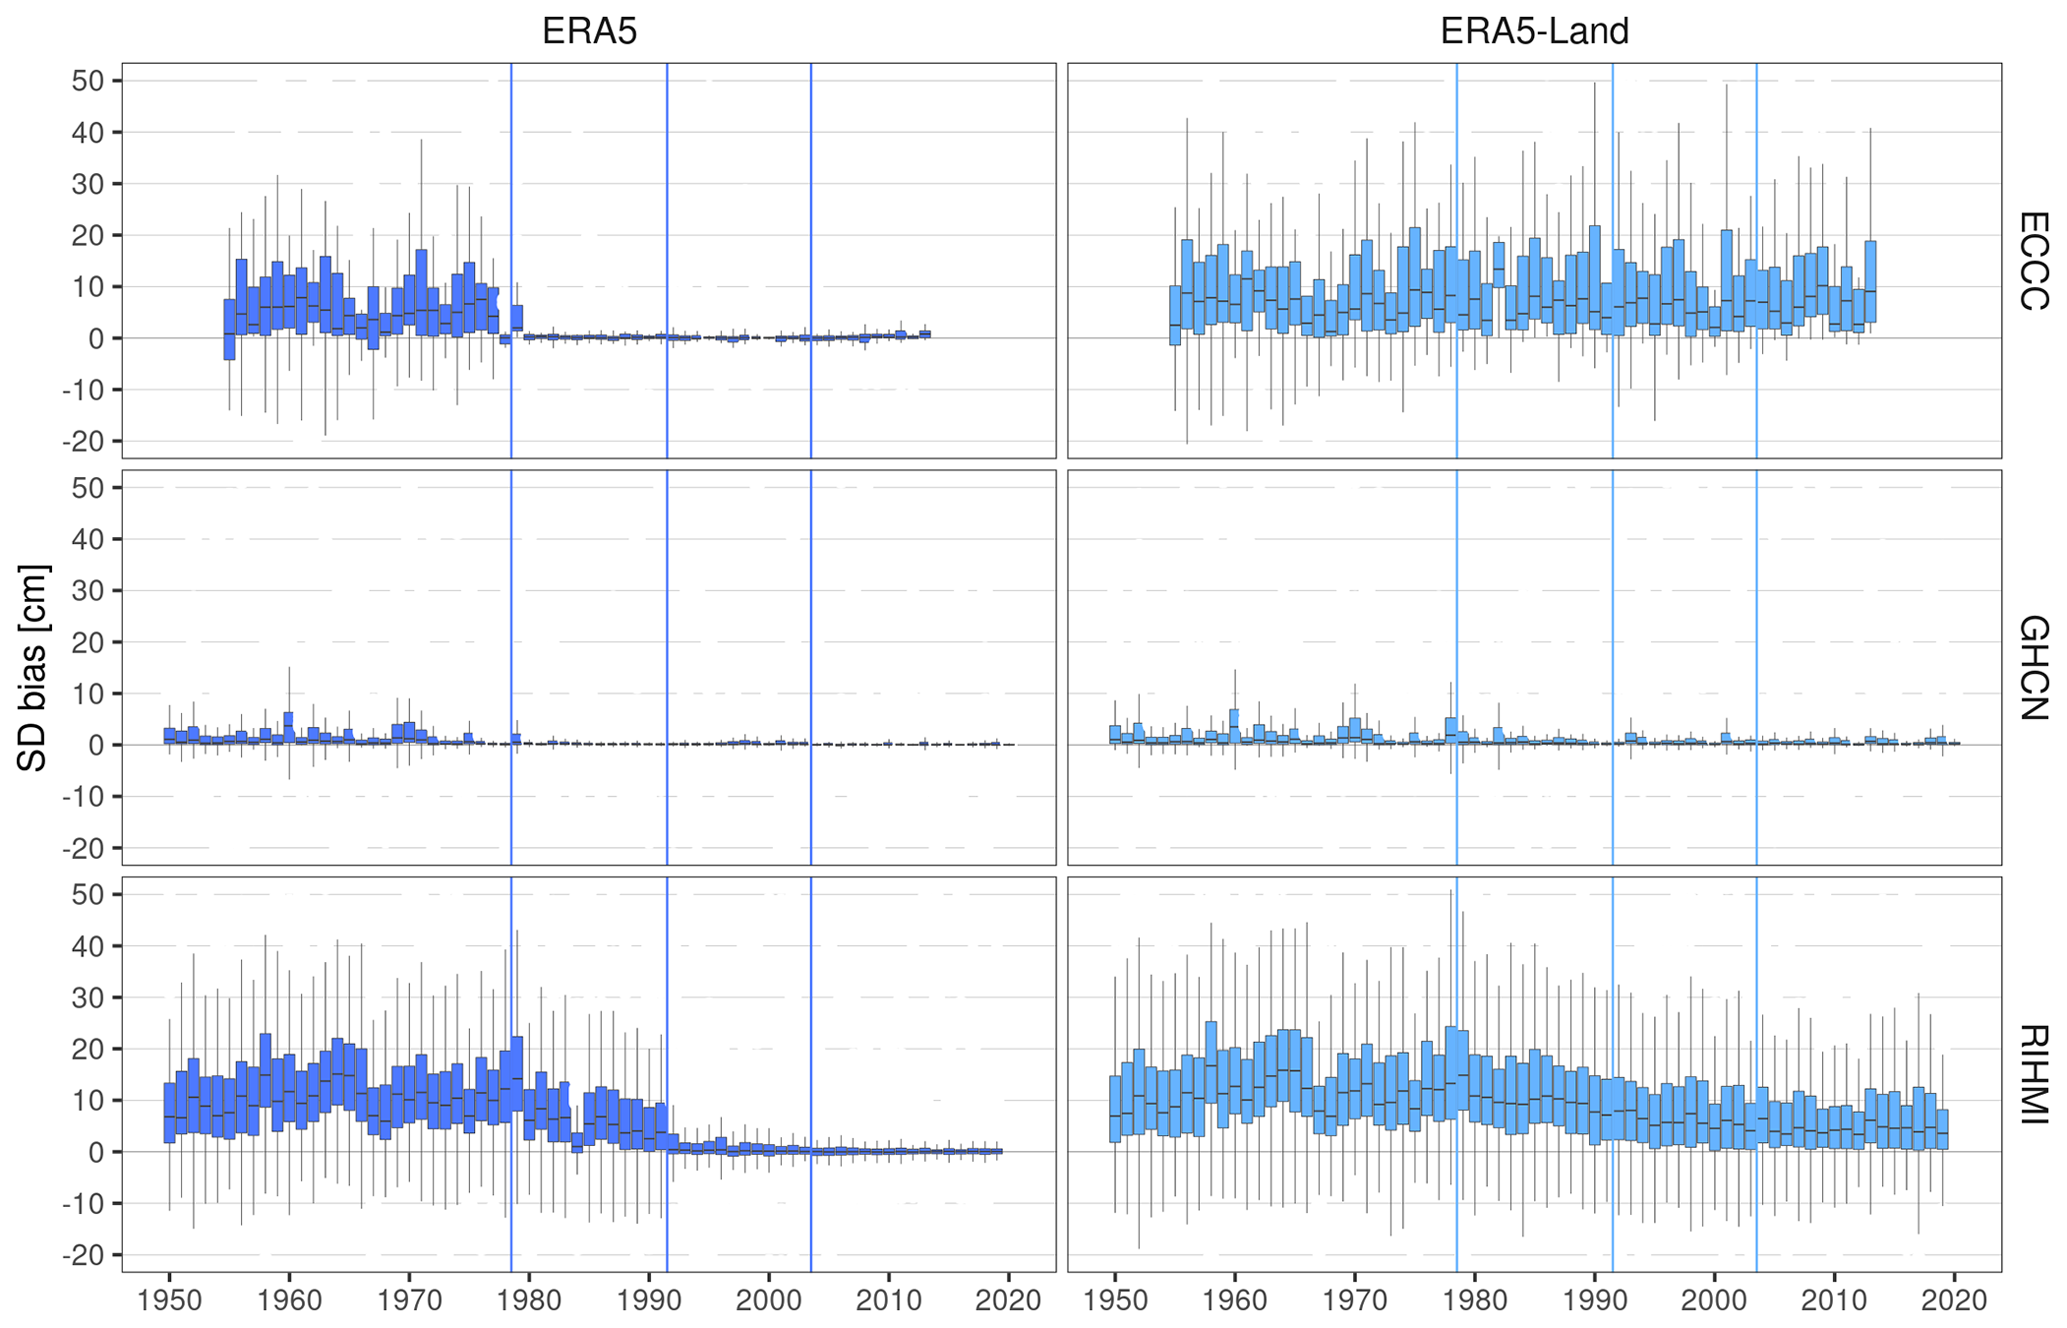
Figure A5Temporal stability of the bias (product – station) in snow depth (SD) per product and network during MAM. Vertical lines show the years when the potential discontinuities in each product occur.
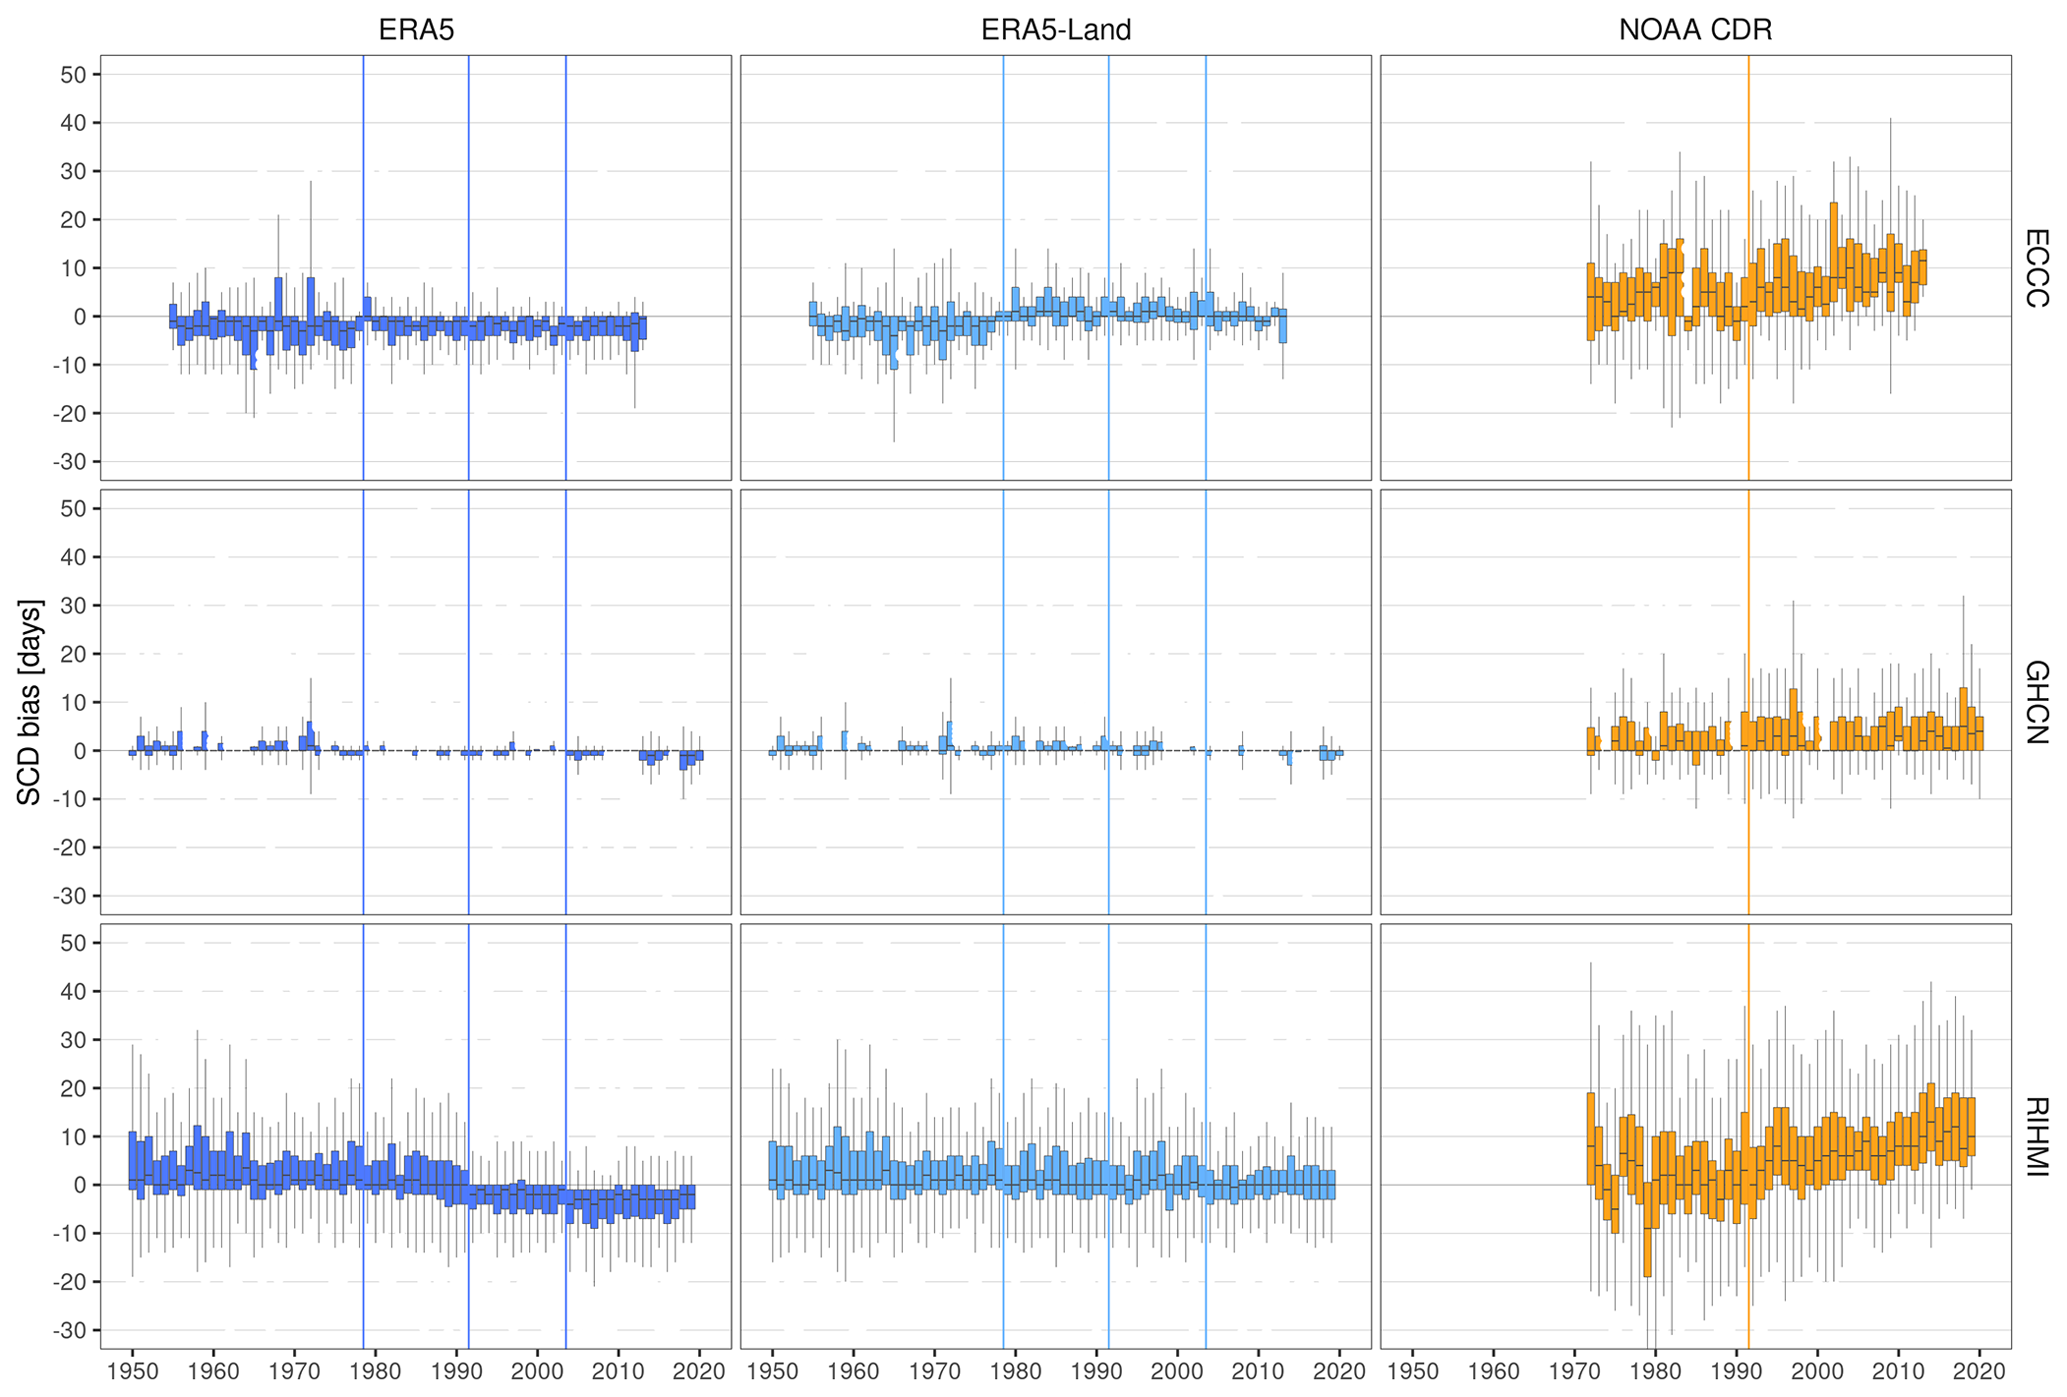
Figure A6Temporal stability of the bias (product – station) in snow cover duration (SCD) per product and network during SON. Vertical lines show the years when the potential discontinuities/trends in each product occur/start.
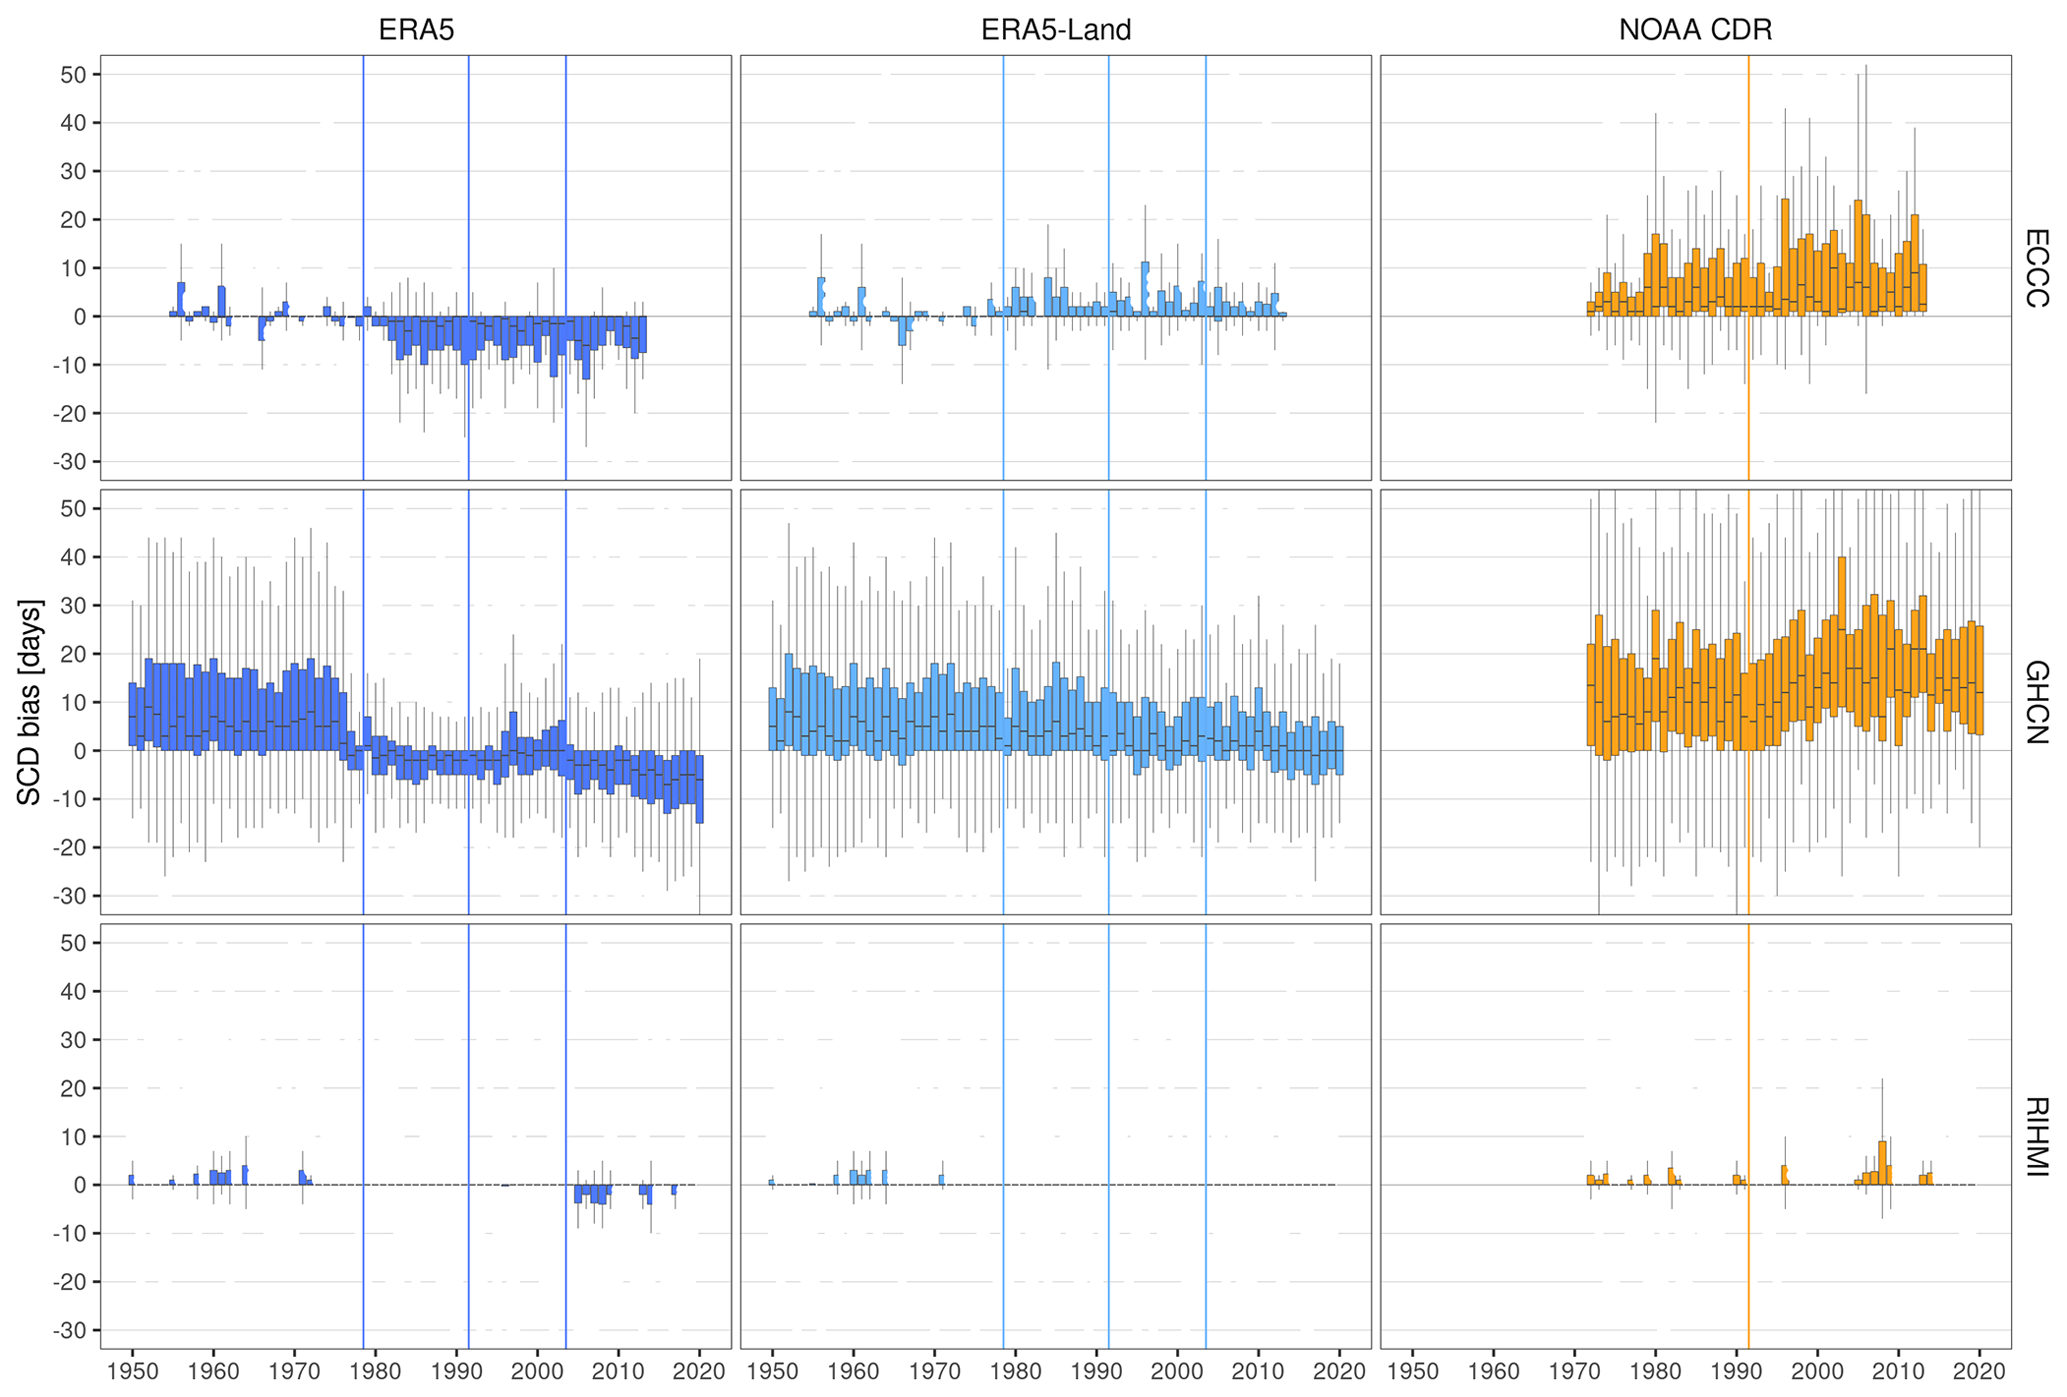
Figure A7Temporal stability of the bias (product – station) in snow cover duration (SCD) per product and network during DJF. Vertical lines show the years when the potential discontinuities/trends in each product occur/start.
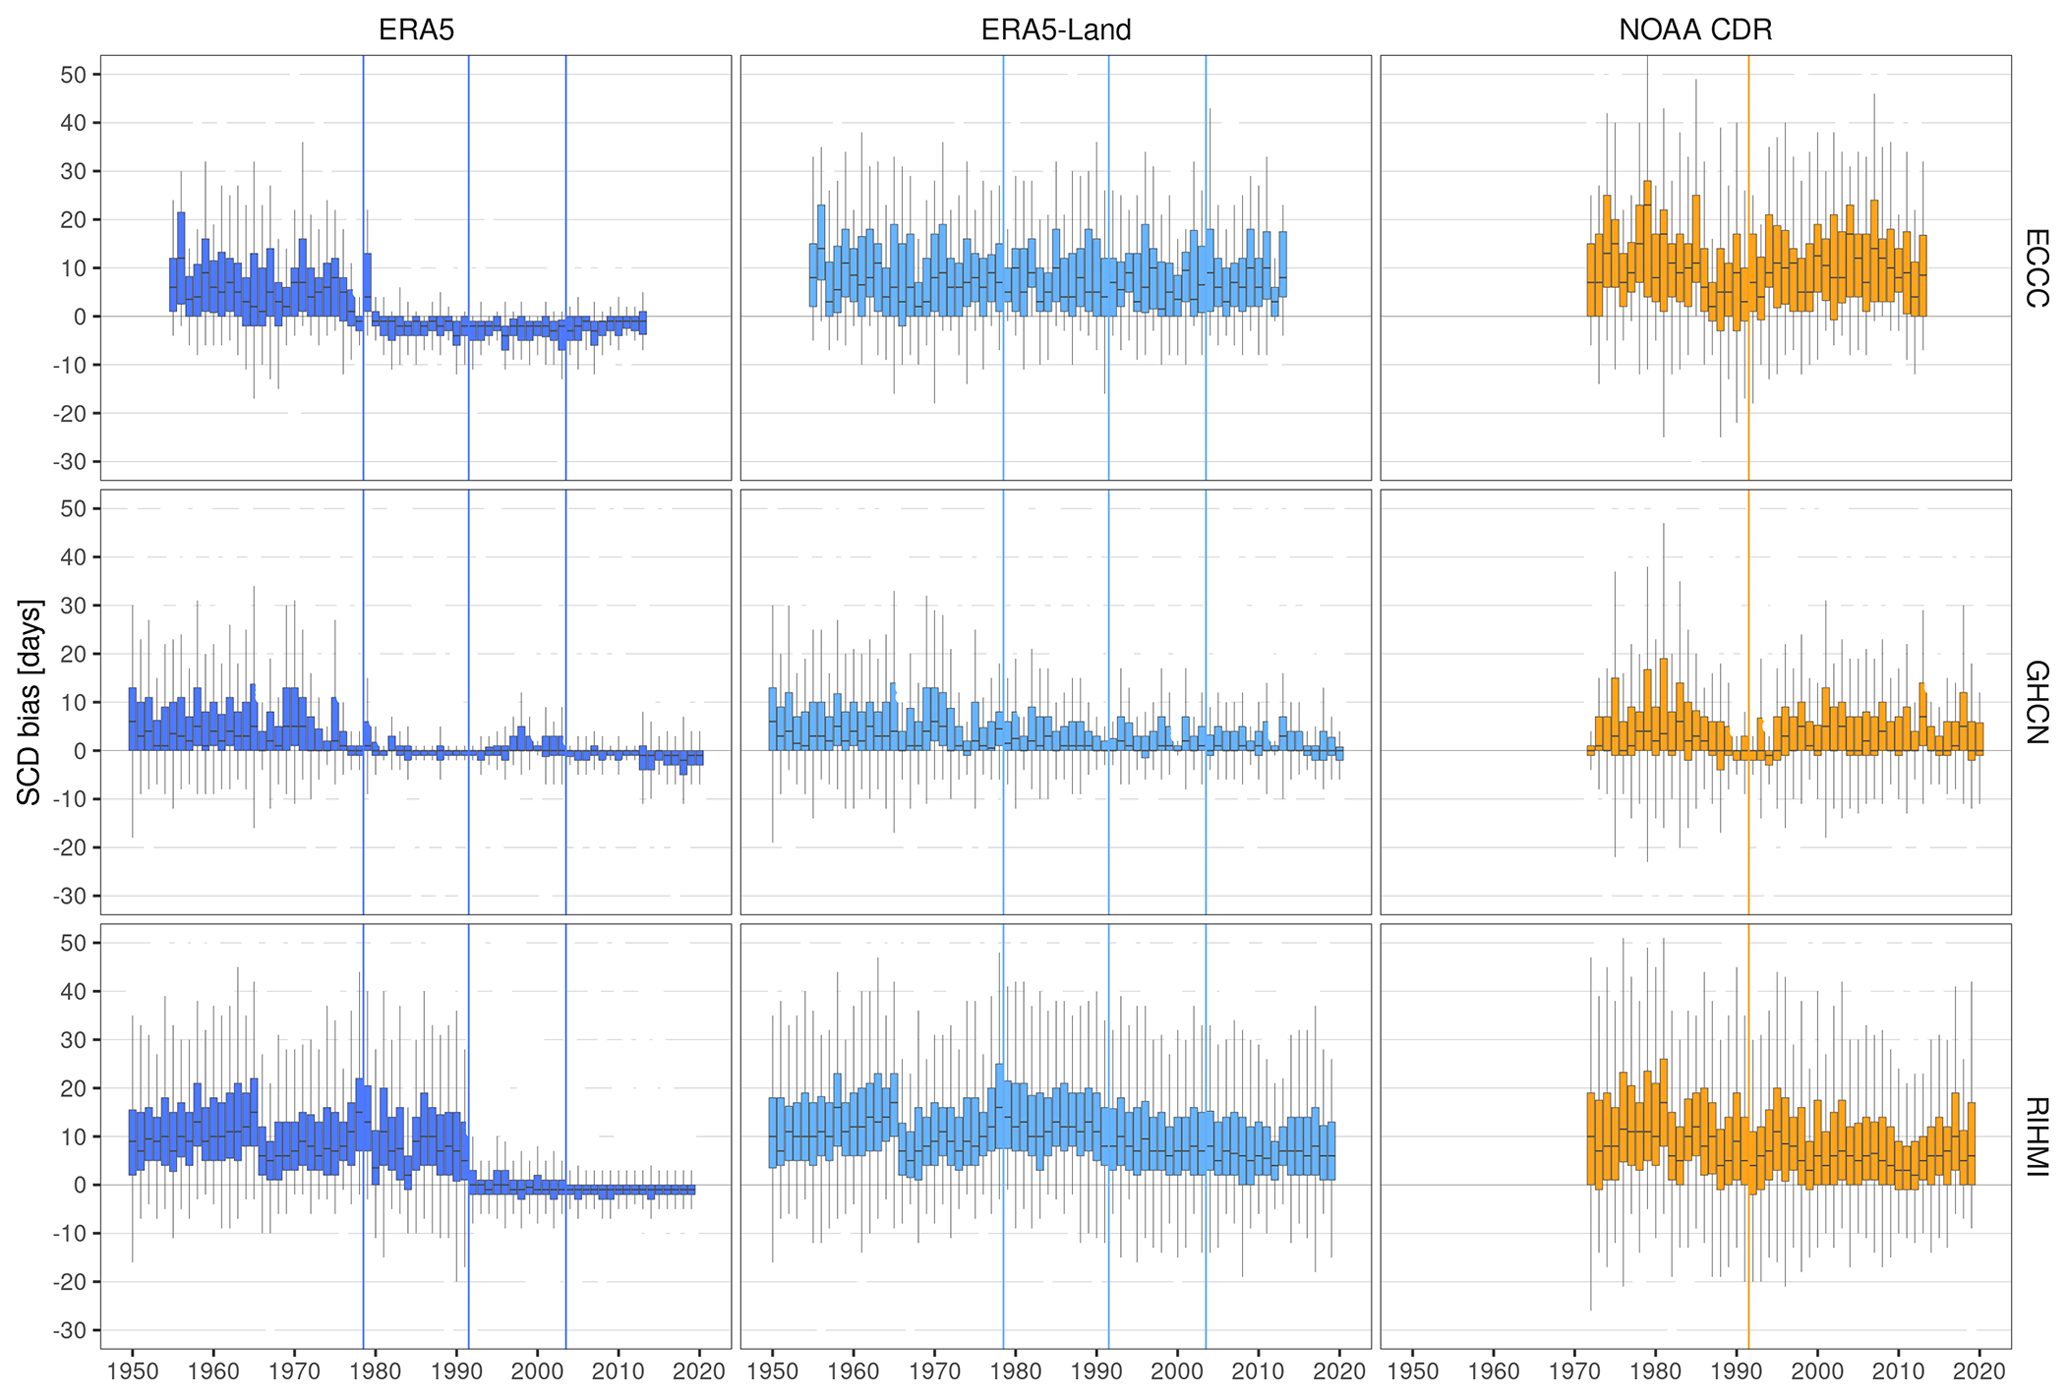
Figure A8Temporal stability of the bias (product – station) in snow cover duration (SCD) per product and network during MAM. Vertical lines show the years when the potential discontinuities/trends in each product occur/start.
Table A1Change in the ERA5 bias (median with its 95 % CI) during 1977–1980, 1991–1992, and 2003–2004 discontinuities. The 4 years before and after the discontinuity are compared (Δbias=biasafter – biasbefore). Valid [%] depicts the percentage of stations that meet the GCOS stability requirements.
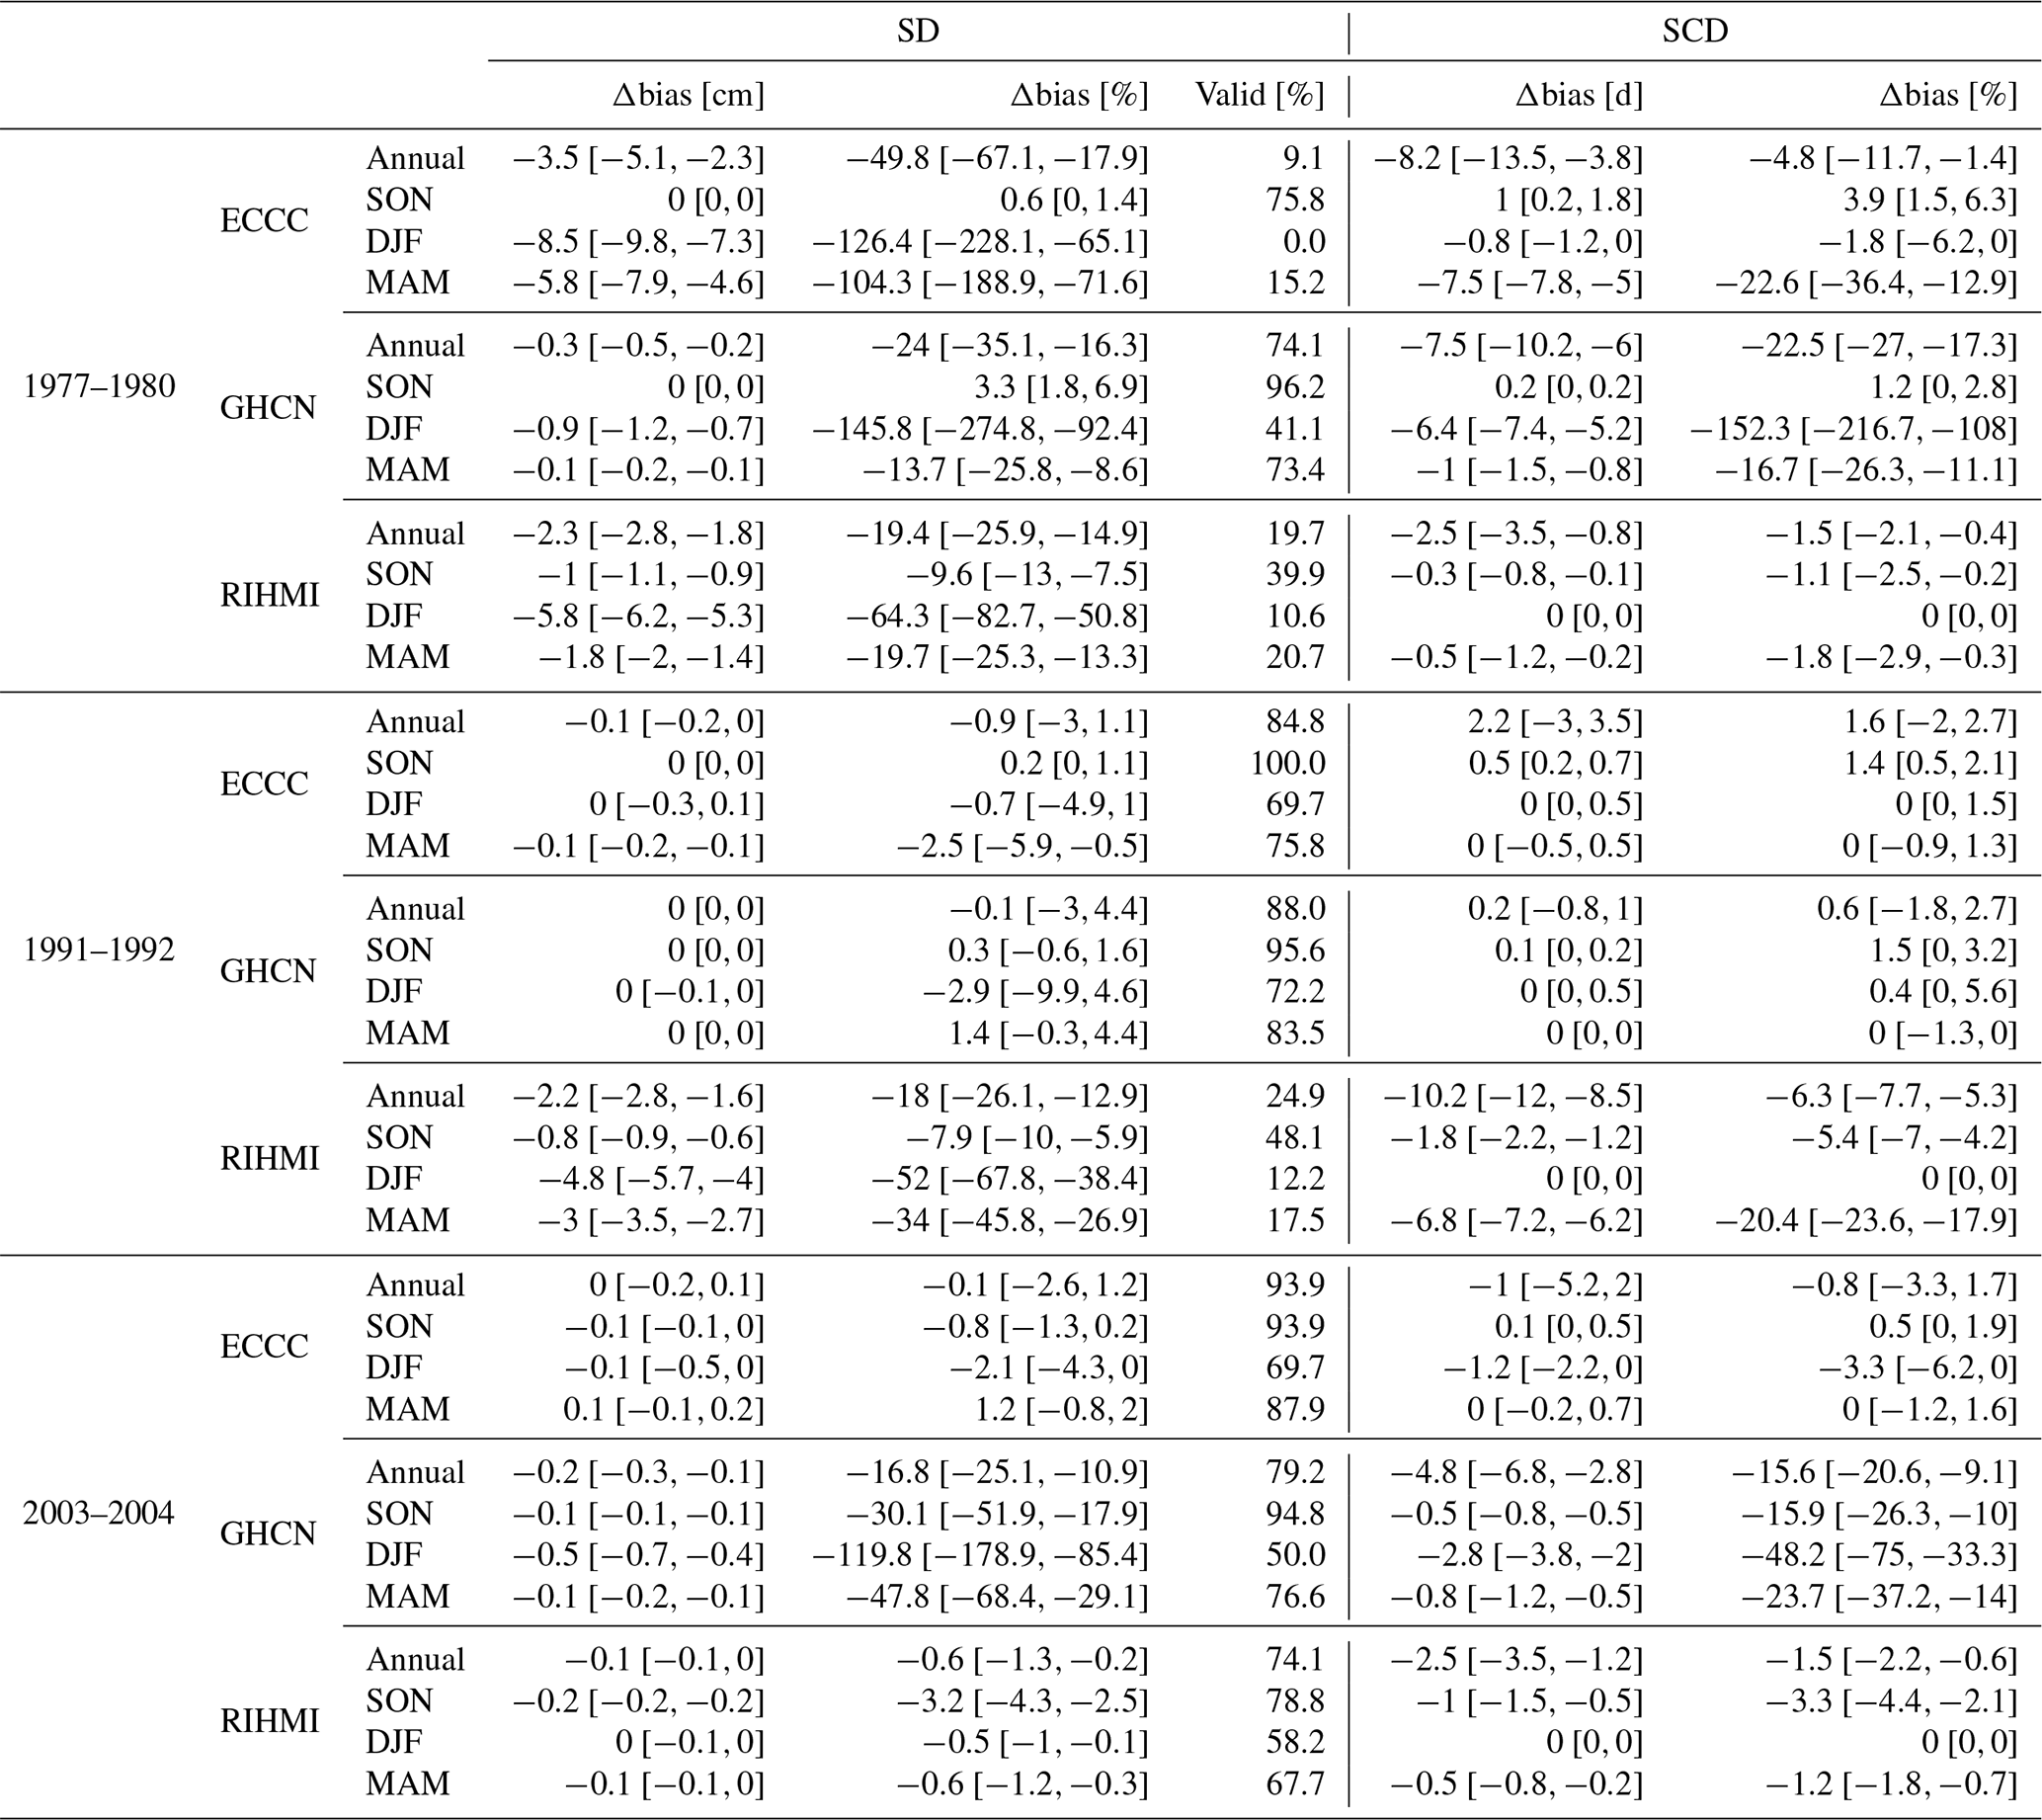
Table A2Decadal trend (median with its 95 % CI) of the seasonal bias in snow cover duration (SCD) of the NOAA CDR (1992–2015) per region. N shows the number of stations showing significant trends (p<0.05, Mann–Kendall). Only statistically significant trends are included in the median calculation.
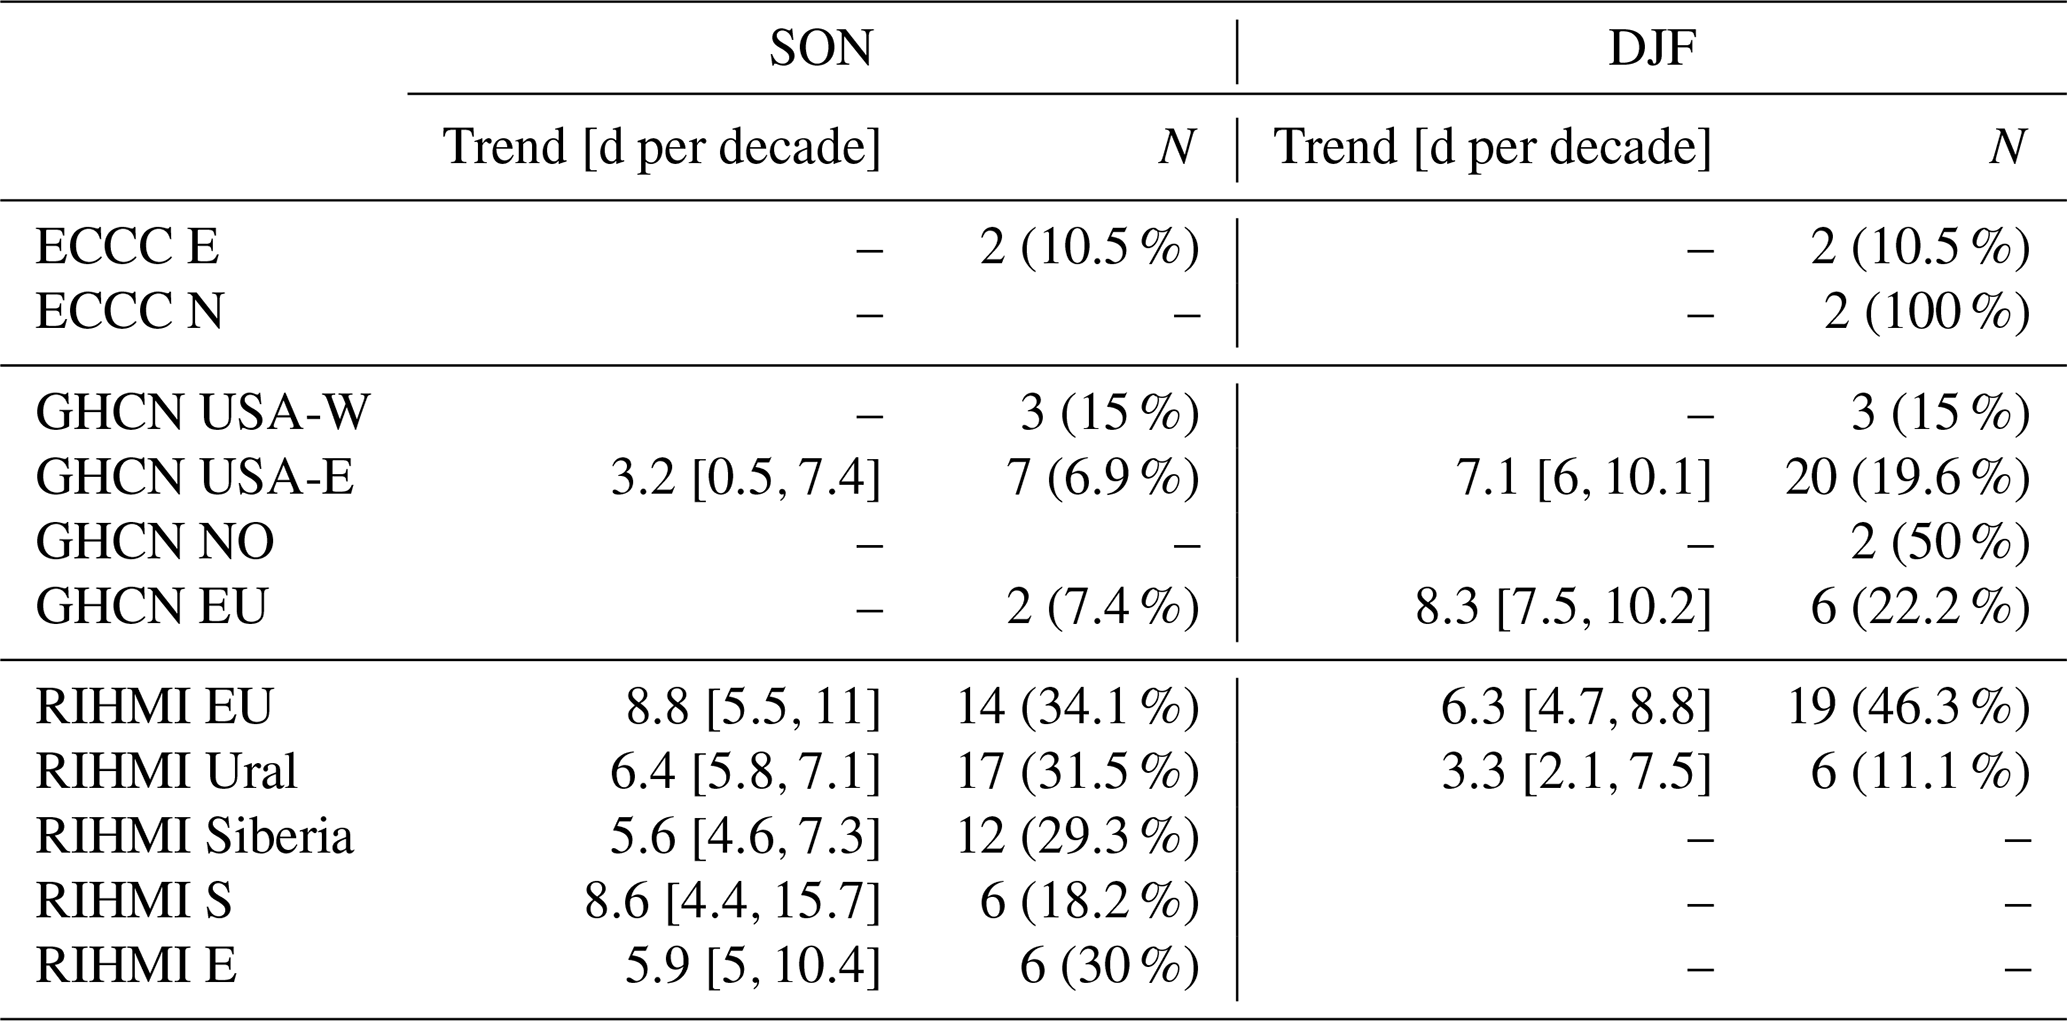
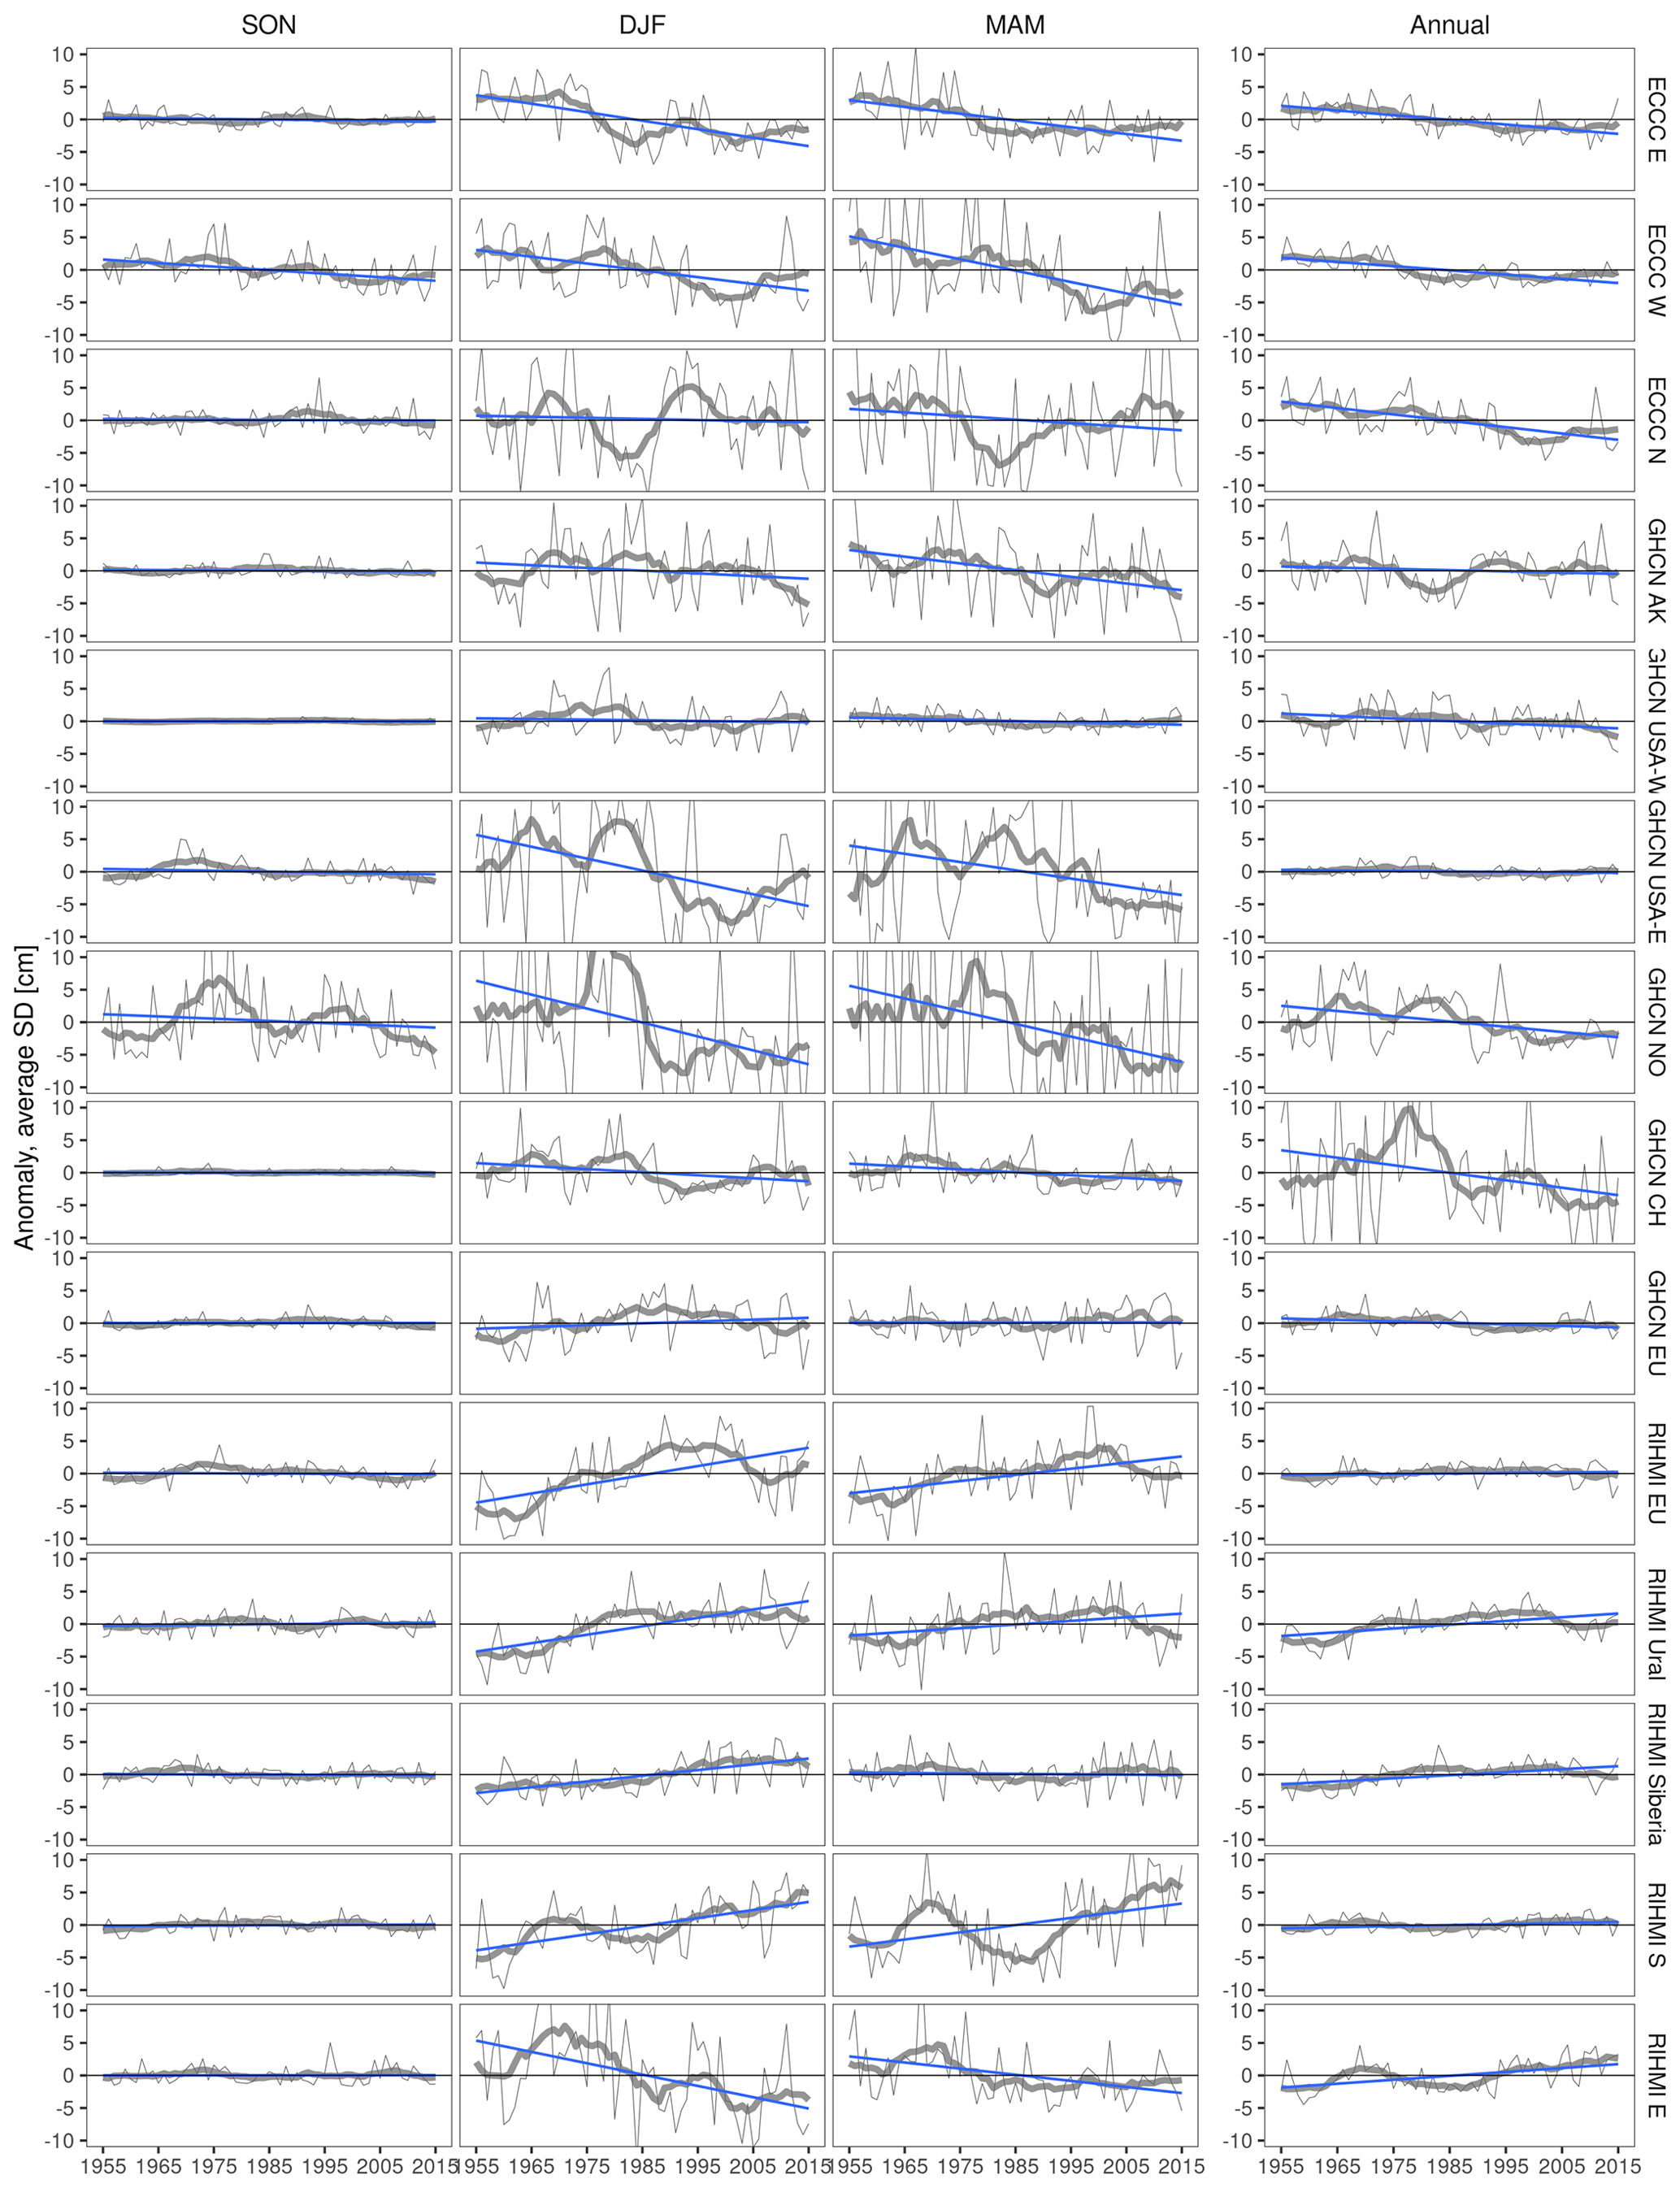
Figure A9Annual and seasonal anomalies in snow depth (SD) per spatial region compared to the 1955–2015 reference period. Thick gray lines show the 10-year running mean.
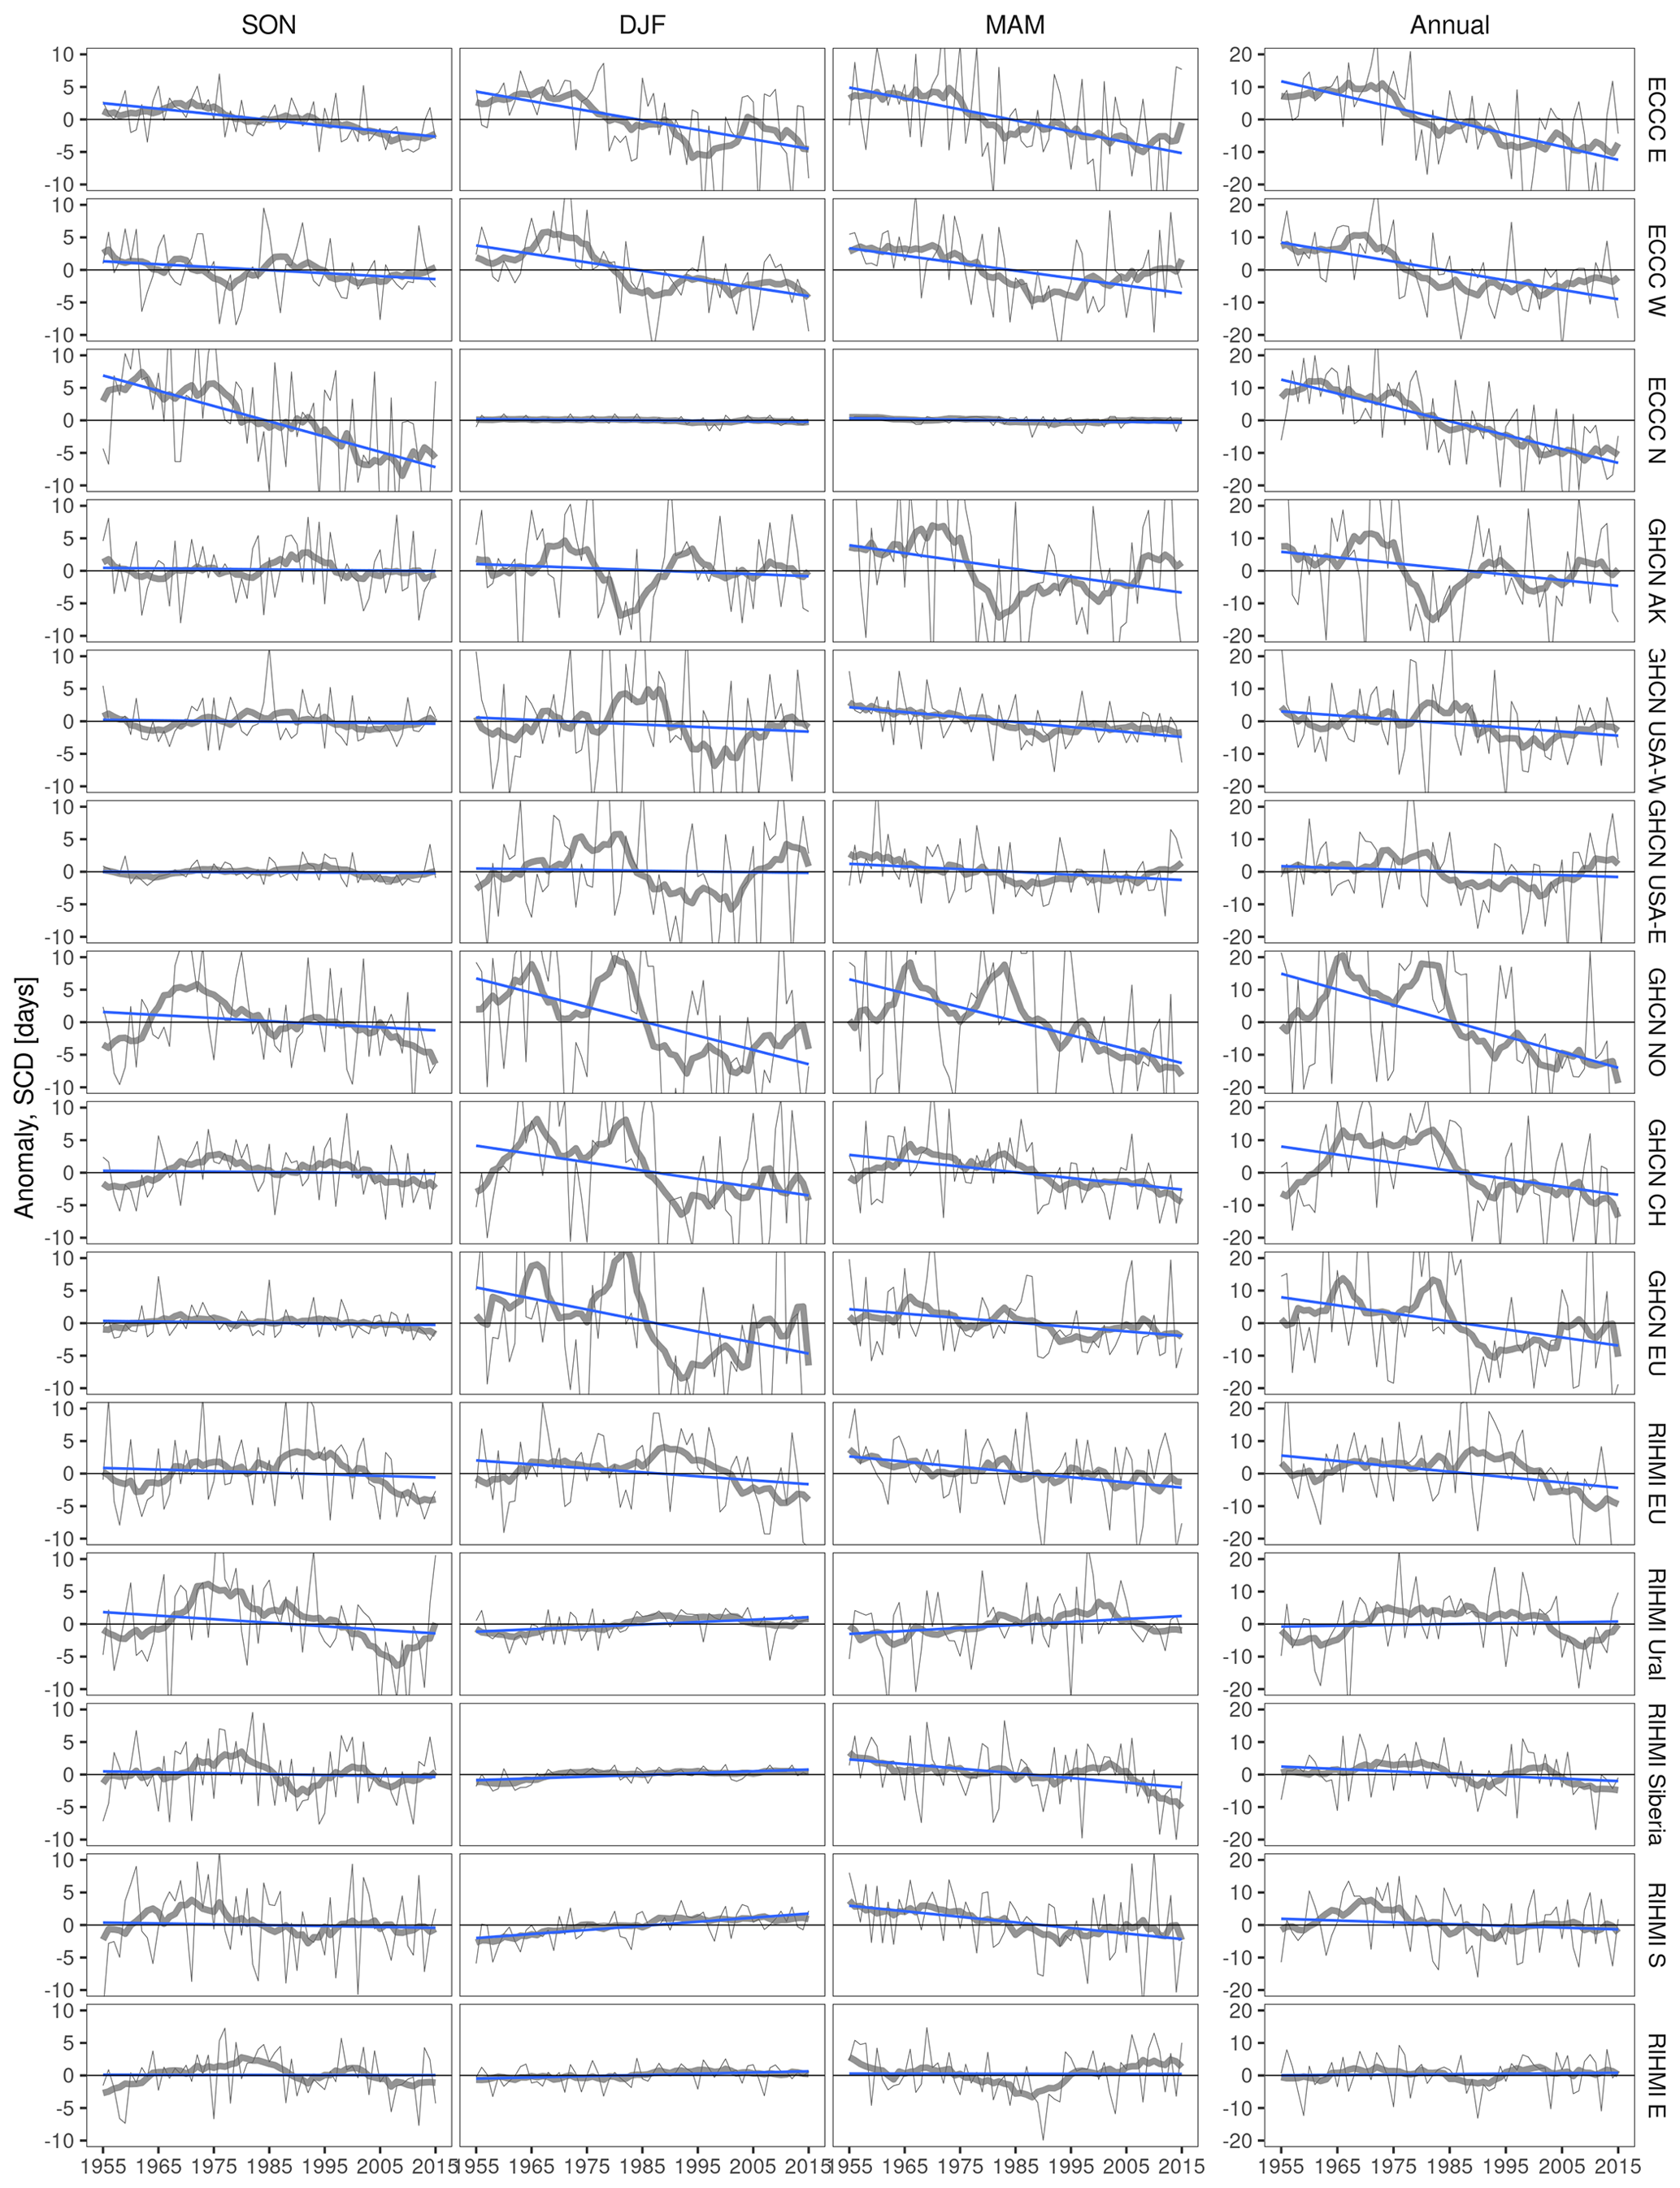
Figure A10Annual and seasonal anomalies in snow cover duration (SCD) per spatial region compared to the 1955–2015 reference period. Thick gray lines show the 10-year running mean.
All of the datasets used in the study are freely available. ERA5 (https://doi.org/10.24381/cds.adbb2d47, Hersbach et al., 2018) and ERA5-Land (https://doi.org/10.24381/cds.e2161bac, Muñoz Sabater, 2019) were retrieved from the Copernicus Climate Data Store (CDS, https://cds.climate.copernicus.eu/#!/home, last access: 17 December 2021). NOAA CDR (NH SCE version 4, https://doi.org/10.5067/P7O0HGJLYUQU, Brodzik and Armstrong, 2013) and NOAA IMS daily 1 km (https://doi.org/10.7265/N52R3PMC, U.S. National Ice Center, 2008) are available at NSIDC (https://nsidc.org/data, last access: 17 December 2021).
RIHMI snow measurements are available at http://meteo.ru/english/climate/snow1.php (Bulygina et al., 2021). GHCN daily measurements (https://doi.org/10.1175/JTECH-D-11-00103.1, Menne et al., 2012) can be retrieved from https://www.ncei.noaa.gov/products/land-based-station/global-historical-climatology-network-daily (last access: 16 June 2021). ECCC snow measurements are available from the ECCC data catalogue (https://doi.org/10.18164/e75562d9-625c-4dd8-9481-682d50adf2d7, Brown et al., 2021).
RU designed the experiment, performed the analysis, and wrote the original manuscript. NG supervised the study and reviewed the document. All authors have read and agreed to the published version of the paper.
The contact author has declared that neither of the authors has any competing interests.
Publisher's note: Copernicus Publications remains neutral with regard to jurisdictional claims in published maps and institutional affiliations.
The support provided by DG DEFIS, i.e. the European Commission Directorate-General for Defence Industry and Space, and the Copernicus Programme is gratefully acknowledged.
This paper was edited by Francesca Pellicciotti and reviewed by Álvaro Ayala and one anonymous referee.
Albergel, C., Dutra, E., Munier, S., Calvet, J.-C., Munoz-Sabater, J., de Rosnay, P., and Balsamo, G.: ERA-5 and ERA-Interim driven ISBA land surface model simulations: which one performs better?, Hydrol. Earth Syst. Sci., 22, 3515–3532, https://doi.org/10.5194/hess-22-3515-2018, 2018. a, b
Bell, B., Hersbach, H., Berrisford, P., Dahlgren, P., Horányi, A., Muñoz Sabater, J., Nicolas, J., Radu, R., Schepers, D., Simmons, A., Soci, C., and Thépaut, J.-N.: ERA5 hourly data on single levels from 1950 to 1978 (preliminary version), Tech. rep., Copernicus Climate Change Service (C3S) Climate Data Store (CDS), 2020. a
Bian, Q., Xu, Z., Zhao, L., Zhang, Y.-F., Zheng, H., Shi, C., Zhang, S., Xie, C., and Yang, Z.-L.: Evaluation and Intercomparison of Multiple Snow Water Equivalent Products over the Tibetan Plateau, J. Hydrometeorol., 20, 2043–2055, https://doi.org/10.1175/JHM-D-19-0011.1, 2019. a, b
Blunden, J. and Arndt, D. S.: State of the Climate in 2019, B. Am. Meteorol. Soc., 101, S1–S429, https://doi.org/10.1175/2020BAMSStateoftheClimate.1, 2020. a, b
Brodzik, M. and Armstrong, R.: Northern Hemisphere EASE-Grid 2.0 Weekly Snow Cover and Sea Ice Extent, Version 4, Tech. rep., Boulder, Colorado USA, NASA National Snow and Ice Data Center Distributed Active Archive Center [data set], https://doi.org/10.5067/P7O0HGJLYUQU, 2013. a, b
Brown, R., Vikhamar Schuler, D., Bulygina, O., Derksen, C., Luojus, K., Mudryk, L., and Wang, L.: Arctic terrestrial snow cover, in: Snow, Water, Ice and Permafrost in the Arctic (SWIPA) 2017, Arctic Monitoring and Assessment Programme (AMAP), 25–55, Oslo, Norway, ISBN 978-82-7971-101-8, 2017. a, b, c, d, e, f, g
Brown, R. D. and Derksen, C.: Is Eurasian October snow cover extent increasing?, Environ. Res. Lett., 8, 024006, https://doi.org/10.1088/1748-9326/8/2/024006, 2013. a, b, c
Brown, R. D. and Robinson, D. A.: Northern Hemisphere spring snow cover variability and change over 1922–2010 including an assessment of uncertainty, The Cryosphere, 5, 219–229, https://doi.org/10.5194/tc-5-219-2011, 2011. a, b, c
Brown, R. D., Smith, C., Derksen, C., and Mudryk, L.: Canadian In Situ Snow Cover Trends for 1955–2017 Including an Assessment of the Impact of Automation, Atmos. Ocean, 59, 77–92, https://doi.org/10.1080/07055900.2021.1911781, 2021. a, b, c
Bulygina, O. N., Razuvaev, V. N., and Korshunova, N. N.: Changes in snow cover over Northern Eurasia in the last few decades, Environ. Res. Lett., 4, 045026, https://doi.org/10.1088/1748-9326/4/4/045026, 2009. a, b, c, d
Bulygina, O. N., Groisman, P. Y., Razuvaev, V. N., and Korshunova, N. N.: Changes in snow cover characteristics over Northern Eurasia since 1966, Environ. Res. Lett., 6, 045204, https://doi.org/10.1088/1748-9326/6/4/045204, 2011. a, b, c
Bulygina, O. N., Razuvaev, V. N., and Aleksandrova, T. M.: RIHMI snow survey routines, http://meteo.ru/english/climate/snow1.php, last access: 16 June 2021.
Callaghan, T. V., Johansson, M., Brown, R. D., Groisman, P. Y., Labba, N., Radionov, V., Bradley, R. S., Blangy, S., Bulygina, O. N., Christensen, T. R., Colman, J. E., Essery, R. L. H., Forbes, B. C., Forchhammer, M. C., Golubev, V. N., Honrath, R. E., Juday, G. P., Meshcherskaya, A. V., Phoenix, G. K., Pomeroy, J., Rautio, A., Robinson, D. A., Schmidt, N. M., Serreze, M. C., Shevchenko, V. P., Shiklomanov, A. I., Shmakin, A. B., Sköld, P., Sturm, M., Woo, M.-K., and Wood, E. F.: Multiple Effects of Changes in Arctic Snow Cover, AMBIO, 40, 32–45, https://doi.org/10.1007/s13280-011-0213-x, 2011. a
Chiu, J., Paredes-Mesa, S., Lakhankar, T., Romanov, P., Krakauer, N., Khanbilvardi, R., and Ferraro, R.: Intercomparison and Validation of MIRS, MSPPS, and IMS Snow Cover Products, Adv. Meteorol., 2020, 4532478, https://doi.org/10.1155/2020/4532478, 2020. a, b, c
Cohen, J., Agel, L., Barlow, M., Garfinkel, C. I., and White, I.: Linking Arctic variability and change with extreme winter weather in the United States, Science, 373, 1116–1121, https://doi.org/10.1126/science.abi9167, 2021. a
Derksen, C.: Validation of satellite derived snow cover data records with surface networks and multi-dataset inter-comparisons, in: LPVE 2014, Land Product Validation and Evolution, ESA/ESRIN, Frascati (Italy), 2014. a, b, c
Dutra, E., Balsamo, G., Viterbo, P., Miranda, P. M. A., Beljaars, A., Schär, C., and Elder, K.: An Improved Snow Scheme for the ECMWF Land Surface Model: Description and Offline Validation, J. Hydrometeorol., 11, 899–916, https://doi.org/10.1175/2010JHM1249.1, 2010. a
ECMWF: CDS documentation, ERA5 back extension 1950–1978 (preliminary version): large bias in surface analysis over Australia prior to 1970, https://confluence.ecmwf.int/display/CKB/ERA5+back+extension+1950-1978+%28preliminary+version%29%3A+large+bias+in+surface+analysis+over+Australia+prior+to+1970, last access: 5 May 2021. a
ESA: Satellite Snow Product Intercomparison and Evaluation Exercise (SnowPEx), https://snowpex.enveo.at (last access: 1 May 2021), 2020. a
Estilow, T. W., Young, A. H., and Robinson, D. A.: A long-term Northern Hemisphere snow cover extent data record for climate studies and monitoring, Earth Syst. Sci. Data, 7, 137–142, https://doi.org/10.5194/essd-7-137-2015, 2015. a, b, c, d
Frei, A., Tedesco, M., Lee, S., Foster, J., Hall, D. K., Kelly, R., and Robinson, D. A.: A review of global satellite-derived snow products, Adv. Space Res., 50, 1007–1029, https://doi.org/10.1016/j.asr.2011.12.021, 2012. a, b
GCOS: The Global Observing System for Climate: Implementation Needs, Tech. rep., GCOS, No. 200, WMO, https://library.wmo.int/index.php?lvl=notice_display&id=19838#.Y_iKooTMKUk (last access: 1 June 2021), 2016. a, b
Gelaro, R., McCarty, W., Suárez, M. J., Todling, R., Molod, A., Takacs, L., Randles, C. A., Darmenov, A., Bosilovich, M. G., Reichle, R., Wargan, K., Coy, L., Cullather, R., Draper, C., Akella, S., Buchard, V., Conaty, A., da Silva, A. M., Gu, W., Kim, G.-K., Koster, R., Lucchesi, R., Merkova, D., Nielsen, J. E., Partyka, G., Pawson, S., Putman, W., Rienecker, M., Schubert, S. D., Sienkiewicz, M., and Zhao, B.: The Modern-Era Retrospective Analysis for Research and Applications, Version 2 (MERRA-2), J. Climate, 30, 5419–5454, https://doi.org/10.1175/JCLI-D-16-0758.1, 2017. a
Hall, D., Riggs, G., and Salomonson, V.: MODIS/Terra Snow Cover 5-Min L2 Swath 500 m, Version 5, Tech. rep., Boulder, Colorado, USA, NASA National Snow and Ice Data Center Distributed Active Archive Center [data set], https://doi.org/10.5067/ACYTYZB9BEOS, 2006. a
Helfrich, S. R., McNamara, D., Ramsay, B. H., Baldwin, T., and Kasheta, T.: Enhancements to, and forthcoming developments in the Interactive Multisensor Snow and Ice Mapping System (IMS), Hydrol. Process., 21, 1576–1586, https://doi.org/10.1002/hyp.6720, 2007. a
Hersbach, H., Bell, B., Berrisford, P., Biavati, G., Horányi, A., Muñoz Sabater, J., Nicolas, J., Peubey, C., Radu, R., Rozum, I., Schepers, D., Simmons, A., Soci, C., Dee, D., and Thépaut, J.-N.: ERA5 hourly data on single levels from 1959 to present, Copernicus Climate Change Service (C3S) Climate Data Store (CDS) [data set], https://doi.org/10.24381/cds.adbb2d47, 2018. a
Hori, M., Sugiura, K., Kobayashi, K., Aoki, T., Tanikawa, T., Kuchiki, K., Niwano, M., and Enomoto, H.: A 38 year (1978–2015) Northern Hemisphere daily snow cover extent product derived using consistent objective criteria from satellite-borne optical sensors, Remote Sens. Environ., 191, 402–418, https://doi.org/10.1016/j.rse.2017.01.023, 2017. a, b, c, d, e, f
Kendall, M.: Rank Correlation Methods, Charles Griffin & Co, ISBN-13 978-0852641996, 1975. a
Knowles, N.: Trends in Snow Cover and Related Quantities at Weather Stations in the Conterminous United States, J. Climate, 28, 7518–7528, https://doi.org/10.1175/JCLI-D-15-0051.1, 2015. a, b
Kobayashi, S., Ota, Y., Harada, Y., Ebita, A., Moriya, M., Onoda, H., Onogi, K., Kamahori, H., Kobayashi, C., Endo, H., Miyaoka, K., and Takahashi, K.: The JRA-55 Reanalysis: General Specifications and Basic Characteristics, J. Meteorol. Soc. Jpn. Ser. II, 93, 5–48, https://doi.org/10.2151/jmsj.2015-001, 2015. a
Krinner, G., Derksen, C., Essery, R., Flanner, M., Hagemann, S., Clark, M., Hall, A., Rott, H., Brutel-Vuilmet, C., Kim, H., Ménard, C. B., Mudryk, L., Thackeray, C., Wang, L., Arduini, G., Balsamo, G., Bartlett, P., Boike, J., Boone, A., Chéruy, F., Colin, J., Cuntz, M., Dai, Y., Decharme, B., Derry, J., Ducharne, A., Dutra, E., Fang, X., Fierz, C., Ghattas, J., Gusev, Y., Haverd, V., Kontu, A., Lafaysse, M., Law, R., Lawrence, D., Li, W., Marke, T., Marks, D., Ménégoz, M., Nasonova, O., Nitta, T., Niwano, M., Pomeroy, J., Raleigh, M. S., Schaedler, G., Semenov, V., Smirnova, T. G., Stacke, T., Strasser, U., Svenson, S., Turkov, D., Wang, T., Wever, N., Yuan, H., Zhou, W., and Zhu, D.: ESM-SnowMIP: assessing snow models and quantifying snow-related climate feedbacks, Geosci. Model Dev., 11, 5027–5049, https://doi.org/10.5194/gmd-11-5027-2018, 2018. a
Kunkel, K. E., Robinson, D. A., Champion, S., Yin, X., Estilow, T., and Frankson, R. M.: Trends and Extremes in Northern Hemisphere Snow Characteristics, Current Climate Change Reports, 2, 65–73, https://doi.org/10.1007/s40641-016-0036-8, 2016. a, b
Luojus, K., Pulliainen, J., Takala, M., Lemmetyinen, J., Mortimer, C., Derksen, C., Mudryk, L., Moisander, M., Hiltunen, M., Smolander, T., Ikonen, J., Cohen, J., Salminen, M., Norberg, J., Veijola, K., and Venäläinen, P.: GlobSnow v3.0 Northern Hemisphere snow water equivalent dataset, Scientific Data, 8, 163, https://doi.org/10.1038/s41597-021-00939-2, 2021. a
Luomaranta, A., Aalto, J., and Jylhä, K.: Snow cover trends in Finland over 1961–2014 based on gridded snow depth observations, Int. J. Climatol., 39, 3147–3159, https://doi.org/10.1002/joc.6007, 2019. a, b
Mann, H. B.: Nonparametric Tests Against Trend, Econometrica, 13, 245–259, https://doi.org/10.2307/1907187, 1945. a
Matiu, M., Crespi, A., Bertoldi, G., Carmagnola, C. M., Marty, C., Morin, S., Schöner, W., Cat Berro, D., Chiogna, G., De Gregorio, L., Kotlarski, S., Majone, B., Resch, G., Terzago, S., Valt, M., Beozzo, W., Cianfarra, P., Gouttevin, I., Marcolini, G., Notarnicola, C., Petitta, M., Scherrer, S. C., Strasser, U., Winkler, M., Zebisch, M., Cicogna, A., Cremonini, R., Debernardi, A., Faletto, M., Gaddo, M., Giovannini, L., Mercalli, L., Soubeyroux, J.-M., Sušnik, A., Trenti, A., Urbani, S., and Weilguni, V.: Observed snow depth trends in the European Alps: 1971 to 2019, The Cryosphere, 15, 1343–1382, https://doi.org/10.5194/tc-15-1343-2021, 2021. a
Menne, M. J., Durre, I., Vose, R. S., Gleason, B. E., and Houston, T. G.: An Overview of the Global Historical Climatology Network-Daily Database, J. Atmos. Ocean. Tech., 29, 897–910, https://doi.org/10.1175/JTECH-D-11-00103.1, 2012. a, b
Meredith, M., Sommerkorn, M., Cassotta, S., Derksen, C., Ekaykin, A., Hollowed, A., Kofinas, G., Mackintosh, A., Melbourne-Thomas, J., Muelbert, M. M. C., Othersen, G., Pritchard, H., and Schuur, E. A. G.: Polar regions, in: IPCC Special report on the ocean and cryosphere in a changing climate, edited by: Portned, H. O., Roberts, D., Masson-Delmotte, V., Zhai, P., Tignor, M., Poloczanska, E., Mintenbeck, K., Alegria, A., Nicolai, M., Okem, A., Petzold, J., Rama, B., and Weyer, N. M., Cambridge University Press, Cambridge, UK and New York, NY, US, https://doi.org/10.1017/9781009157964.005, 2019. a
Mortimer, C., Mudryk, L., Derksen, C., Luojus, K., Brown, R., Kelly, R., and Tedesco, M.: Evaluation of long-term Northern Hemisphere snow water equivalent products, The Cryosphere, 14, 1579–1594, https://doi.org/10.5194/tc-14-1579-2020, 2020. a, b, c, d
Mortimer, C., Mudryk, L., Derksen, C., Brady, M., Luojus, K., Venäläinen, P., Moisander, M., Lemmetyinen, J., Takala, M., Tanis, C., and Pulliainen, J.: Benchmarking algorithm changes to the Snow CCI+ snow water equivalent product, Remote Sens. Environ., 274, 112988, https://doi.org/10.1016/j.rse.2022.112988, 2022. a
Mudryk, L., Santolaria-Otín, M., Krinner, G., Ménégoz, M., Derksen, C., Brutel-Vuilmet, C., Brady, M., and Essery, R.: Historical Northern Hemisphere snow cover trends and projected changes in the CMIP6 multi-model ensemble, The Cryosphere, 14, 2495–2514, https://doi.org/10.5194/tc-14-2495-2020, 2020. a, b
Mudryk, L. R., Derksen, C., Kushner, P. J., and Brown, R.: Characterization of Northern Hemisphere Snow Water Equivalent Datasets, 1981–2010, J. Climate, 28, 8037–8051, https://doi.org/10.1175/JCLI-D-15-0229.1, 2015. a
Mudryk, L. R., Kushner, P. J., Derksen, C., and Thackeray, C.: Snow cover response to temperature in observational and climate model ensembles, Geophys. Res. Lett., 44, 919–926, https://doi.org/10.1002/2016GL071789, 2017. a, b
Muñoz Sabater, J.: ERA5-Land hourly data from 1981 to present, Tech. rep., Copernicus Climate Change Service (C3S) Climate Data Store (CDS) [data set], https://doi.org/10.24381/cds.e2161bac, 2019. a, b
Orsolini, Y., Wegmann, M., Dutra, E., Liu, B., Balsamo, G., Yang, K., de Rosnay, P., Zhu, C., Wang, W., Senan, R., and Arduini, G.: Evaluation of snow depth and snow cover over the Tibetan Plateau in global reanalyses using in situ and satellite remote sensing observations, The Cryosphere, 13, 2221–2239, https://doi.org/10.5194/tc-13-2221-2019, 2019. a, b, c, d, e, f
Peng, S., Piao, S., Ciais, P., Friedlingstein, P., Zhou, L., and Wang, T.: Change in snow phenology and its potential feedback to temperature in the Northern Hemisphere over the last three decades, Environ. Res. Lett., 8, 014008, https://doi.org/10.1088/1748-9326/8/1/014008, 2013. a
Pirazzini, R., Leppänen, L., Picard, G., Lopez-Moreno, J. I., Marty, C., Macelloni, G., Kontu, A., von Lerber, A., Tanis, C. M., Schneebeli, M., de Rosnay, P., and Arslan, A. N.: European In-Situ Snow Measurements: Practices and Purposes, Sensors, 18, 7, https://doi.org/10.3390/s18072016, 2018. a
Pulliainen, J., Luojus, K., Derksen, C., Mudryk, L., Lemmetyinen, J., Salminen, M., Ikonen, J., Takala, M., Cohen, J., Smolander, T., and Norberg, J.: Patterns and trends of Northern Hemisphere snow mass from 1980 to 2018, Nature, 581, 294–298, https://doi.org/10.1038/s41586-020-2258-0, 2020. a
Robinson, D. A., Dewey, K. F., and Heim, R. R.: Global Snow Cover Monitoring: An Update, B. Am. Meteorol. Soc., 74, 1689–1696, https://doi.org/10.1175/1520-0477(1993)074<1689:GSCMAU>2.0.CO;2, 1993. a
Schwaizer, G., Keuris, L., Nemec, J., Metsamaki, S., and Luojus, K.: Snow Cover Extent, Collection 1 km Northern Hemisphere, Version 1.0., Tech. rep., Copernicus Global Land Service, 2020. a
Schwarz, M., Folini, D., Hakuba, M. Z., and Wild, M.: Spatial Representativeness of Surface-Measured Variations of Downward Solar Radiation, J. Geophys. Res.-Atmos., 122, 13319–13337, https://doi.org/10.1002/2017JD027261, 2017. a, b
Solberg, R., Schwaizer, G., Nagler, T., Wunderle, S., Naegeli, K., Luojus, K., Takala, M., Pulliainen, J., Lemmetyinen, J., and Moisander, M.: ESA CCI+ Snow ECV: Product User Guide, version 2.0, Tech. rep., ESA, https://catalogue.ceda.ac.uk/uuid/ef8eb5ff84994f2ca416dbb2df7f72c7 (last access: 4 June 2021), 2020. a
Stocker, T., Qin, D., Plattner, G.-K., Tignor, M., Allen, S., Boschung, J., Nauels, A., Xia, Y., Bex, V., and Midgley, P. (Eds.): Climate Change 2013: The physical science basis. Contribution of working group I to the Fift Assessment Report of the Intergovernamental Panel on Climate Change, Cambridge University Press, Cambridge, UK and New York, USA, ISBN 978-1-107-05799-1, 978-1-107-66182-0, 2013. a, b, c, d
Thackeray, C. W., Derksen, C., Fletcher, C. G., and Hall, A.: Snow and Climate: Feedbacks, Drivers, and Indices of Change, Current Climate Change Reports, 5, 322–333, https://doi.org/10.1007/s40641-019-00143-w, 2019. a
Urraca, R., Huld, T., Gracia-Amillo, A., Martinez-de Pison, F. J., Kaspar, F., and Sanz-Garcia, A.: Evaluation of global horizontal irradiance estimates from ERA5 and COSMO-REA6 reanalyses using ground and satellite-based data, Sol. Energy, 164, 339–354, https://doi.org/10.1016/j.solener.2018.02.059, 2018. a
U.S. National Ice Center: IMS Daily Northern Hemisphere Snow and Ice Analysis at 1 km, 4 km, and 24 km Resolutions, Version 1, Boulder, Colorado USA. National Snow and Ice Data Center [data set], https://doi.org/10.7265/N52R3PMC, 2008. a