

Introduction
Materials and Methods
Growth Conditions of Paprika
Measuring ECp in Paprika
Temperature Calibration
ECp Modeling and Its Validation
Water Content and Sap Extract Properties of Paprika Stems
Results and Discussion
Resistance Calibration with Temperature
Correlation between ECp and Environmental Conditions
Relationship between ECp, and Water Content and Ion Concentration in Paprika
Conclusions
Introduction
The electrical properties of plants can be used to estimate plant growth and physiological characteristics. Electrical properties of plants occur at the cellular level and are caused by differences in the flow of electrical current, which affect cell membrane functions and the movement of extra- and intracellular fluids. Among the electrical properties, the electrical potential, resistance, and impedance are the most commonly used in trees (Gora and Yanoviak, 2015). The electrical potentials in avocado and white spruce were first measured by Fensom (1963) and recently Gibert et al. (2006) measured the electrical potential in poplar trees (Populus nigra L.). Electrodes were inserted in both the soil and plant, and the electrical potential was measured with a voltmeter. Gibert et al. (2006) reported that the flow of sap in the poplar is associated with electrical variation caused by
electrochemical effects including membrane diffusion potentials and active transport of ions. Differences in electrical potential can be measured to indicate daily variations in sap flow (Morat et al., 1994). However, these data were influenced by environmental factors such as atmospheric electricity, point discharge, and the geomagnetic and electric fields of the Earth (Koppán et al., 1999; Koppán et al., 2000).
Electrical resistance was first quantified for trees using a Wheatstone bridge in the early 1900s (Stone and Chapman, 1912). In the 1970s, a device called a “Shigometer” was used to measure the electrical resistance in trees that was nondestructive, simple, and rapid (Shigo and Shigo, 1974). The electrical resistance in the cambial zone of plants is inversely proportional to their growth rate (Shortle et al., 1977); however, the difference in resistance is observed only when there are significant differences in plant growth (Piene et al., 1984). In addition, resistance is not highly correlated with growth in individual plants (Smith and Ostrofsky, 1993).
Recently, it was reported that the electrical resistivity in English oak was inversely correlated with sap pH, and the potassium and magnesium content of the measured cross section rather than with moisture content (Bieker and Rust, 2010). Resistance data can be converted to resistivity using the equation ρ = RA/L, where R = resistance in ohms, A = cross-sectional area of the plant stem or wood block, and L = distance between the electrodes (Gora et al., 2017). However, the resistivity was not measured using the entire cross-sectional area of the plant stem, but by a part of the cross-sectional area of the plant stem; therefore, the accurate electrical resistivity of the plant could not be measured. Thus, if electrical properties are to be used as plant physiological indicators it is necessary to acquire stable and accurate electrical signals that reflect plant responses to environmental conditions.
Although, there have been many efforts to understand the relationships between physiological properties and electrical properties, it is still unclear whether environmental conditions are correlated with electrical conductivity in plants (ECp). The ECp is not easily acquired because of the instability of the data; Jeon et al. (2017) tried to measure ECp to evaluate plant physiological properties and concluded that there are still many technological challenges that hamper measuring stable ECp, which reflects the physiological conditions of plants.
Electrical properties are frequently related to rapid responses to stress (Fromm and Lautner, 2007). These responses in plants are sometimes not apparent or do not produce constant visual indicators such as wilting and changes in leaf color. Therefore, the development of evaluation techniques that are non-destructive, easily applied in the field are needed to effectively assess plant responses to stress and environmental conditions. Modelling can be one of the efficient approaches for estimation (Jung et al., 2016; Moon et al., 2018). Sap flow measurement was proposed for the evaluation of transpiration rates in plants, and can be measured by the heat balance of the moving sap stream (Smith and Allen, 1996). However, sap flow measurements only provide information about water movement within plants and does not directly relate to rapid plant responses to the environment or stress. The measurement of electrical potential was proposed as a method to assess plant responses to stress, but this is greatly affected by soil water and weather conditions (Dobbertin, 2005). Therefore, the relationship between environmental conditions and ECp should be characterized. The objectives of this study were to develop methods that provide more stable and accurate ECp measurements and to understand the relationship between the ECp with environmental factors such as temperature, irradiation, and relative humidity. In addition, the effect of water content, pH, electrical conductivity (EC), and ion content of plant sap on ECp was evaluated in Paprika (Capsicum annuum L. ‘Cupra’).
Materials and Methods
Growth Conditions of Paprika
Paprika (Capsicum annuum L. ‘Cupra’) seedlings were sown on 25 August, 2016 and transplanted into a venlo-type greenhouse at the Protected Horticulture Research Institute, National Institute of Horticultural and Herbal Science located at Haman, Korea on 22 September, 2016. Dutch PBG nutrient solutions were used for the paprika plants and contained N, P, K, Ca, and Mg at concentrations of 12.75, 3.75, 6.0, 7.5, and 2.5 mg·L-1, respectively. The EC of the nutrient solutions was maintained at 2.5-3.0 dS·m-1 and pH 5.8-6.0. Ventilation windows were opened when the room temperature rose above 25°C during the day, and heating was activated when the temperature fell below 18°C at night. Shading screens on the roof were closed when the temperature rose above 33°C. The temperature, irradiation, and relative humidity in the greenhouse were monitored every hour during the experimental period.
Measuring ECp in Paprika
A test plant was selected 90 d after transplanting when the plant had developed its cambium zone and its outer layer had lignified. It was possible to measure the ECp in paprika continuously with little influence from the needle insertions. To test the relationship between the ECp and selected environmental conditions, two electrodes with three needles made of stainless steel were inserted into each side of the lower stem of a paprika plant (Fig. 1). Preliminary experiments determined that insertion of three pins provided more stable data than insertion of one or two pins (data not shown). The resistance was measured with the bridge circuit method after pulsing direct current on both sides of the two electrodes. Electrical resistance and environmental data were received every minute during 3-5 February and 18-20 May 2017 using a data logger (CR1000, Campbell Scientific, Logan, UT, USA) and the recorded data were averaged every hour. The resistance was converted to ECp with Eq. (1).
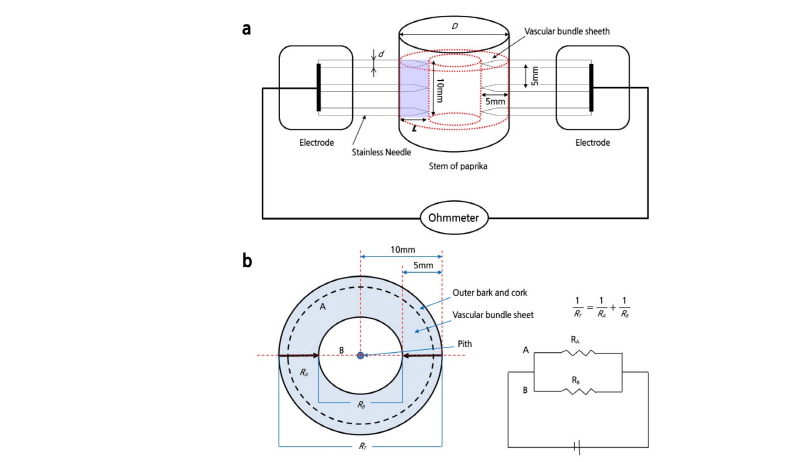
Fig. 1.Measurement of electrical conductivity (ECp) in vascular tissue of paprika stems with a diameter D; two electrodes with three needles each were inserted 5 mm deep into the both sides of the stem (a). Calculation of resistance RA in vascular tissue of the stem; RA is the resistance in outer bark + cork and vascular bundle sheet; RT is the total resistance in the stem; and RB is the resistance in B section of the stem (b).
The electrical conductivity in the paprika stem was calculated per cross-sectional area of the stem contacted by needles. The area of the stem contacted by three needles is 3 × L × πd and the average length of the stem between the needles was π (D-L) (Fig. 1B).
 (1)
(1)
where ECp is the electrical conductivity (S·m-1) in the paprika stem (refer to Fig. 1 for RA and RT); D is the diameter (mm) of the stem; L is the length (mm) of needle inserted into the bundle sheaths of the stem; d is the diameter (mm) of needle; and k is constant. After RT was measured, vascular bundle sheath of the stem was removed and RB was consequently measured. In this experiment, RB occupied 79% of RT. RA was calculated using RT and RBas described in Fig. 1B. k was obtained as 0.316 by calculating with the ratio of RA and RT.
Temperature Calibration
The paprika was cut 30 cm above the base and inserted into a rock wool cubic bed (0.1 × 0.1 × 0.1 m) in a water container. The rock-wool bed was filled with water and a film covering prevented evaporation from the top of the paprika stem to keep the water content in the paprika stem constant. A temperature sensor was inserted into the paprika stem at a depth of 5 mm. The rock wool cubic bed with the paprika stem was kept in a refrigerator at 4°C for 8 h and then placed in an incubator at 45°C. The temperature of the paprika was monitored and its resistance was measured every 10 min.
ECp Modeling and Its Validation
All resistance data were converted to ECp and calibrated at 20°C. The ECp ( ) and the temperature-calibrated ECp (
 20) were correlated with temperature, relative humidity, vapor deficit, and irradiation. A correlation matrix using Pearson’s correlation coefficient for each type of data was created to assess the relationship between environmental conditions and the ECp. Regression was used to define a model that could predict the ECp in the selected environmental conditions (temperature, irradiation, and relative humidity) on 3-5 Februaryand 18-20 May 2017. The goodness-of-fit of the regression model was evaluated using the coefficient of determination (R2). A model was developed using the data from February and May to predict the ECp on 25 May 2017 in relation to monitored environmental data of the temperature, relative humidity, and irradiation. The predicted ECp was validated using the ECp measured on 25 May 2017 to evaluate whether the ECp model made from environmental data measured at a certain date was applicable to environmental conditions on other days. Statistical analysis of the data was carried out using SPSS version 24 (IBM, New York, NY, USA).
Water Content and Sap Extract Properties of Paprika Stems
To measure the water content, EC, pH, and ion content of paprika stems, two individual paprika plants were cut at 15:00 (day) and 22:00 (night) on 6 February 2017. Paprika stems were severed every 5 cm from their base and were weighed (n=5). Distilled water was added to all five of the paprika stem pieces at a ratio of 10:1 (wt/wt). After 24 h of shaking at 20°C, EC, pH, and ions (NO3, PO4, SO4, Cl, Ca, Mg, K, and Na) in the extracted water were measured using an Orion EC, a calibrated pH meter, and ion chromatography (DX-500, Dionex, Thermo Scientific, MA, USA) and an inductively coupled plasma optical emission spectroscopy (ICP-OES, ICAP7400, Thermo Scientific, MA, USA), respectively. The remaining five pieces of paprika were dried at 60°C for 24 h to determine the water content of the paprika plants. Comparison of the mean values of ECp, pH, EC, water, and ion content of the paprika between day and night was made using a t-test (SPSS) to verify which factors affected ECp.
Results and Discussion
Resistance Calibration with Temperature
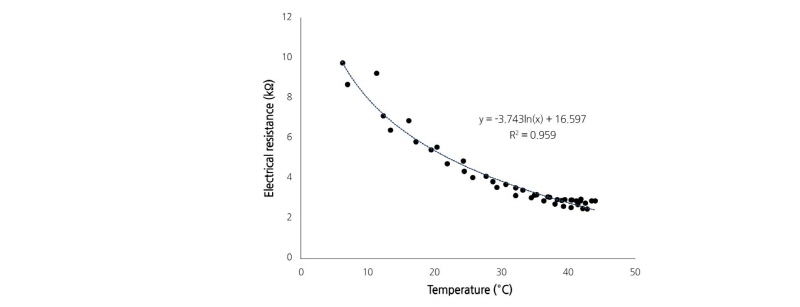
The resistance of paprika plants decreased with increasing temperatures (Fig. 2) and temperature dependent values of paprika resistance were best represented by a logarithmic fit. Therefore, the resistance of paprika measured at a given temperature was calibrated to resistance at 20°C using Eq. (2).
 (2)
(2)
where  is the resistance in paprika at 20°C and RT is the resistance at T°C.
Correlation between ECp and Environmental Conditions
When irradiation inside the greenhouse increased, the air temperature and ECp increased while the relative humidity decreased (Fig. 3). Changes in ECp with increased irradiation and temperature was attributed to the high transpiration rate in paprika plants and to increased water transport in the paprika stem during daylight hours. As irradiation increases, the stem electrical capacitance in spruce and fir trees is strongly influenced by sap water (Lekas et al., 1990). Temperature and irradiation were highest around 13:00-14:00 and the ECp ( ) was highest at 13:00 on 3-4 February 2017, while the relative humidity was lowest between 13:00-15:00 (Fig. 3A). However, the ECp, temperature, and irradiation of the paprika were all highest at 11:00 on 5 February 2017 due to clouded weather in the afternoon, as indicated by the irradiation levels measured on that day (Table 1).
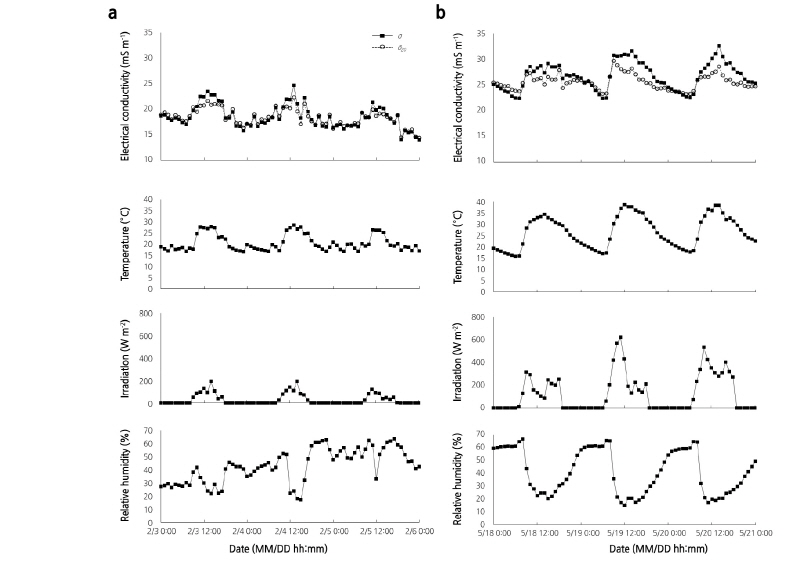
Table 1. ECp (mS·m-1) in paprika (σ) vs the environmental factors: temperature (°C), irradiation (W·m-2), and relative humidity (RH, %) measured in February 2017  |
Table 2. ECp (mS·m-1) in paprika (σ) vs the environmental factors: temperature (°C), irradiation (W·m-2), and relative humidity (RH, %) measured in May 2017 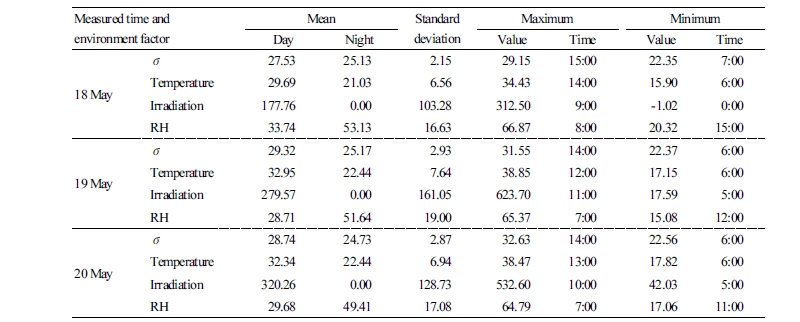 |
In May, irradiation was highest between 09:00-11:00. This was 2-3 h faster than in February because in May, the shading screens in the roof were closed at temperatures above 33°C (Table 2). The screens were applied to maintain an optimum temperature for plant growth when irradiation was saturated in summer. Temperature was highest between 12:00-14:00 and the ECp was highest at 14:00-15:00 (Fig. 3B). The time when paprika reached maximum ECp was delayed by 1-2 h in February compared with the data collected in May.
The mean value of the ECp during daytime hours was calculated when irradiation had a positive value. The maximum and mean of ECp were higher during the day than night, and higher on clear days than cloudy days. The mean values of ECp in May increased 7-10 mS·m-1 compared to February, which can probably be attributed to increased intensity of irradiation followed by increased temperature. The mean temperature and irradiation values in February were lower than those in May, which corresponds with a previous report that suggested electrical resistance, which is inversely proportional to EC in olive trees, increased as the temperature declined (Mancuso 2000). In our study, some differences in ECp were attributed to the growth stages of paprika; the same paprika plants were used for monitoring ECp in February and May 2017. In the February measurements, the paprika plants were three and half months younger than in May and therefore, the biomass and physiological activities of paprika would depend on the degree and stage of plant growth. Lekas et al. (1990) also reported seasonal trends in stem capacitance. The stem capacitance of trees increased following bud break until early June, although it slowly declined after that. Electrical resistivity varies with stem diameter, growth form, and plant species (Gora and Yanoviak, 2015). Increased ECp can be related to increased physiological activity represented by increase in ion and water transport (Fromm and Lautner, 2007).
The ECp ( ) in paprika plants was positively correlated with temperature and irradiation, with correlation coefficients of 0.815 and 0.642, respectively. The ECp and relative humidity were negatively correlated with a correlation coefficient of -0.416. The inverse correlation of ECp with relative humidity can be explained by the high transpiration rate of plants grown under conditions of low relative humidity and high water flow in stems. The ECp was calibrated for 20°C (
 20), which was less correlated with the experimental environmental conditions than the non-calibrated ECp. Temperature calibration decreased the correlation coefficient because temperature greatly affected the ECp (Table 3). Regression analysis between ECp and temperature (T), irradiation (IR), and relative humidity (RH) completed was as follows.
 predicted = 0.765 × T + 0.002 × IR + 0.105 × RH + 0.012 (R2 = 0.715, p < 0.01) (3)
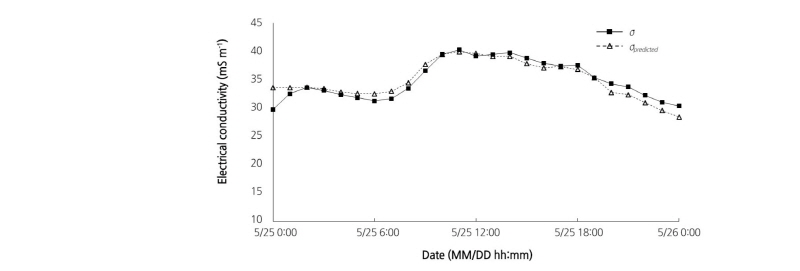
where  predicted is the ECp predicted by the regression equation. The model was only applicable to paprika plants and basic ECp information should be provided when it is used for other plants. Eq. (3) was used to predict the ECp with environmental conditions, and the predicted values were validated by comparing them with measured ECp. The values predicted using Eq. (3) corresponded well with the ECp measured on 25 May 2017(correlation coefficient 0.931; p < 0.01; Fig. 4). The high correlation coefficient indicated that the growth status of paprika was in accordance with environmental conditions. If the ECp predicted by environmental conditions was higher than the measured ECp, this could indicate some physiological problems within the plant; for example, a low ECp could be related to water and salt stress conditions within the plant. Sap flow and hydraulic conductance in paprika was affected by salt stress (Carvajal et al., 1999). Under salt stress conditions (NaCl and Na2SO4) in hydroponic growth conditions, Capsicum annuum L. had reduced stomatal conductance, root hydraulic conductance, and increased solute flow into the xylem (Navarro et al., 2003). Changes in solute flow and hydraulic conductance under salt and water stress conditions result in changes in measured ECp. Therefore, differences in predicted and measured ECp could indicate that the growth of paprika was affected by other factors such as salt and water stress.

Relationship between ECp, and Water Content and Ion Concentration in Paprika
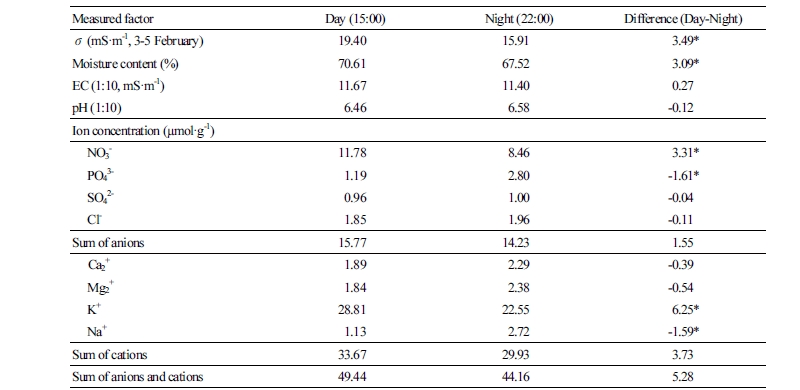
The ECp can be influenced by changes in water content and ion concentration in paprika stems. The water content and ECp were significantly higher at 15:00 (day) than at 22:00 (night). The EC of 1:10 paprika-stem extracts was slightly higher at 15:00 than 22:00, and the sum of anions and cations was also slightly higher at 15:00 than at 22:00 (Table 4). Because the EC was high and pH was low at 15:00 compared to 22:00, organic acids in the sap might contribute to the higher EC at 15:00. Organic acids (e.g., malic acid and glutamic acid) decreased the pH and increased the EC of water (data not shown).
Most ion concentrations were similar between 15:00 and 22:00; however, the ion concentrations of potassium, sodium, phosphate, and nitrate were significantly higher at 15:00 than at 22:00, which could be related to the higher EC at 15:00. Peuke et al. (2001) reported that solute concentrations were constant during light and dark cycles in the phloem and xylem, except for the major solutes such as potassium and nitrate. When the aerial parts of olive plants were exposed to moderately high temperature, potassium accumulated in the stems (Benlloch-González et al., 2016). Potassium regulates stomatal opening to avoid dehydration in the aerial organs when the air temperature and evaporation increases (Fischer and Hsiao, 1968; Benlloch-González et al., 2016). Bieker and Rust (2010) reported that increasing potassium and magnesium correlated with decreased electrical resistivity in the heartwood of English oak. Lower phosphate concentrations at 15:00 than at 22:00 can be attributed to ATP production by photophosphorylation and oxidative phosphorylation during the day (Gardeström and Igamberdiev, 2016).
The electric field of a paprika stem is generally consistent because the structure of the vascular bundle sheaths does not significantly change in a day. The density of a paprika stem will increase with increased current flow as the water and ion content in the vascular bundle sheaths increase. Therefore, the ECp is positively correlated with the water and ion content in the vascular bundle sheath in paprika (Tattar et al., 1972).
The change in the ECp might be influenced by increased water content in paprika stems and the ion concentration in the vascular bundle sheaths with decreased transpiration rate when the irradiation and temperature increased during the day. The ECp correlated primarily with the moisture and mineral content of the vascular bundle sheaths in paprika (Table 4). Below the cambium saturation point, the degree of resistance correlated primarily with the amount of moisture, while above the cambium saturation point the resistance correlated primarily with the concentration of mobile ions (Koppán et al., 2002). Nutrient absorption by the roots is constant during the day and night, but the evaporation rate is lower at night, thereby resulting in lower ion concentrations in the sap at night in paprika. Therefore, the difference in ECp at 15:00 (day) and 22:00 (night) seems to be more affected by water than by sap ion content in the vascular bundle sheaths in paprika. Hagrey (2006) showed that electrical resistivity was inversely related to the moisture content in tree trunks, and Lekas et al. (1990) reported that stem electrical capacitance of spruce and fir trees was strongly influenced by water when irradiation increased. In this study, ECp showed a good correlation with water content in the paprika stems.
Conclusions
The ECp in paprika could be stably monitored and well represented the water and ion content of paprika stems. The ECp was precisely predicted using environmental data from irradiation, temperature, and relative humidity conditions; moreover, the predicted ECp corresponded to the experimental results. The ECp was affected by the water and ion content of paprika stems, and differences in the predicted and measured ECp values could be related to changes in water and salt flow in paprika that was caused by external water and salt stress.
