Abstract
We investigated the characteristics of laser ablation phenomena in supercritical fluids by optical emission and shadowgraph imaging. In comparison with laser ablation in liquid H2O, the optical emission of a laser ablation plasma produced in supercritical H2O had a longer lifetime and a larger transport length. It was found in supercritical CO2 that laser ablation plasmas with bright optical emissions were produced at a mass density of approximately 300 kg/m3. A clear correlation between the optical emission intensity and the density fluctuation was not observed in our experimental results, which were obtained in a regime deviated from the critical point. Bubblelike hollows were observed by shadowgraph imaging in both supercritical H2O and CO2. The dynamics of the bubblelike hollows were different from the dynamics of a cavitation bubble induced by laser ablation in a liquid medium but relatively similar to the dynamics of ambient gas in gas-phase laser ablation.
Export citation and abstract BibTeX RIS
1. Introduction
The primary medium of laser ablation for material synthesis is vacuum. A solid-state target installed in vacuum is vaporized by the irradiation of intense laser pulses, and the species ejected from the target are transported to the surface of the substrate to form a thin film of the target material. This technique for thin-film formation is called pulsed laser deposition (PLD).1) Reactive PLD, in which the synthesized thin film is a different material from the target, is also possible by laser ablation in rarefied reactive gases.2) In addition, laser ablation is widely used for the synthesis of nanoparticles. The synthesis of nanoparticles employs a relatively high gas pressure (typically <10 Torr), and the gas-phase condensation of species ejected from the target results in the formation of nanoparticles.3–5)
Recently, laser ablation in liquids has attracted much attention as a new technique for synthesizing nanoparticles.6–20) Liquid-phase laser ablation has a technical advantage of being inexpensive because it requires no vacuum equipment. The easy collection of nanoparticles after the synthesis is also an advantage of liquid-phase laser ablation. The latter advantage is due to the fact that nanoparticles are stored in the liquid as a colloidal solution in liquid-phase laser ablation. In addition to these technical advantages, the reaction field induced by liquid-phase laser ablation is believed to be unique in terms of its high pressure (∼1 GPa)18) and high temperature (∼104 K).21) Many authors have reported the synthesis of metastable-phase and/or high-pressure-phase materials of nanoparticles by liquid-phase laser ablation.14,22,23) It is believed that the high pressure and high temperature of the reaction field induced by liquid-phase laser ablation contribute to the synthesis of unique nanoparticles.
This paper focuses on laser ablation in supercritical fluids. A fluid is defined to be in the supercritical state when the system temperature and pressure exceed the corresponding critical point values. In the supercritical fluid state, the distinction between a liquid and a gas disappears, and physical and thermal properties such as density, conductivity, and viscosity can be tuned from being gaslike to being liquidlike by manipulating the temperature and pressure. For instance, since the solvent power of a supercritical fluid is directly related to its density, a wide variation in the solubility can be achieved by simply changing the pressure and temperature. In addition, the phase change is obtained by reducing the pressure, and the supercritical fluid is transformed to a gas without leaving any residue. These adjustable properties have been widely applied in a variety of processes including extraction, separation,24) polymerization,25) and coating.26) In the vicinity of the critical point, large fluctuations are seen in its properties, and the fluid behaves inhomogeneously owing to the clustering of molecules. By using supercritical fluid media, the behaviors of laser ablation observed in the gas and liquid phases can be connected continuously because of the tunability of the density. Also, the unique fluid properties near the critical point may make the ablation phenomena different from those in gas or liquid media. To date, the synthesis of nanoparticles with unique properties by laser ablation techniques in supercritical fluids has been reported.27–29) In particular, Saitow and coworkers have reported that silicon nanoclusters and gold nanonecklaces can be synthesized by laser ablation in supercritical CO2.30–32) Nakahara et al. have also reported the formation of higher-order diamondoids in supercritical CO2.33) Since it is considered that atomized species ejected from a target grow into nanoparticles in reaction fields (ablation plasma and cavitation bubbles) induced by laser ablation, the investigation of the characteristics of ablation-induced reaction fields is crucial. Spectroscopic approaches in reaction fields induced by laser ablation in supercritical water and CO2 have been reported by Yui et al.34) and Kato et al.35) However, the understanding of laser ablation phenomena in supercritical fluids remains insufficient. In this paper, laser ablation phenomena in supercritical H2O and CO2 are investigated and discussed.
2. Experimental procedure
We prepared two vessels for laser ablation experiments in H2O and CO2 in their supercritical states. The vessel used for laser ablation in supercritical H2O was made of Hastelloy36) and was suitable for a pressure of up to 35 MPa and a temperature of 500 °C. The inner surfaces of the vessel as well as the other components that were placed in the vessel were plated with gold to minimize contamination. The vessel was filled with distilled water, and a mechanical pump was used to pressurize water inside the vessel. The water pressure was also controlled by increasing the temperature using four heater rods. A back-pressure regulator was used to maintain constant pressure. The pressure was monitored using a Bourdon pressure gauge with a measurement error of approximately 0.8 MPa. Each temperature indicated in this paper, which was measured using a thermocouple, was the temperature of the vessel at a position near the inner surface, and hence the real water temperature was considered to be lower than the vessel temperature by approximately 10%. We employed a titanium target in the experiment in H2O. The titanium target was rotated in the vessel to disperse the ablation point. The vessel had five sapphire windows, one of which was used for injecting Nd-doped yttrium aluminium garnet (YAG) laser (Spectra Physics INDI) pulses at a wavelength of 1064 nm for laser ablation, while the other four windows were used for observation. The duration of each YAG laser pulse was 10 ns, and the pathway of the YAG laser beam was horizontal. The YAG laser beam was focused using a lens and irradiated onto the target surface from the normal direction. As described below, the distance between the lens and the target as well as the laser energy were adjusted to obtain the same laser fluence on the target surface.
The vessel for laser ablation in supercritical CO2 was suitable for a pressure of up to 30 MPa and a temperature of 100 °C.29) A mechanical pump was used to pressurize the CO2 supplied from a gas cylinder. A Bourdon pressure gauge with an error of approximately 0.5 MPa was used to measure the pressure. The vessel was heated using heater rods. The temperature was measured using a thermocouple that was placed inside the vessel. The error in the temperature measurement was less than 1.5 °C. We employed a gold target in the experiment in CO2. The vessel had three sapphire windows. The gold target was irradiated with Nd:YAG laser (Spectra Physics INDI) pulses at 1064 nm at 60° with respect to the target surface via one of the windows. The duration of each YAG laser pulse was 10 ns. We did not use a focusing lens in the experiment using optical emission imaging in CO2, but we used a lens in the shadowgraph imaging experiment. We placed an aperture with a diameter of 1 mm in the optical path of the YAG laser beam to obtain a narrow ablation spot in the optical emission imaging experiment.
The diagnostics we applied in this work were optical emission imaging and shadowgraph imaging. In optical emission imaging, we captured the spatial distribution of the optical emission intensity from the plasma using a charge-coupled device camera with a gated image intensifier (ICCD camera). The gate width of the ICCD camera was 2 ns. No optical filters were used in this experiment. The scattering of the laser beam on the target surface did not affect the optical emission imaging, since the ICCD camera had no sensitivity at the laser wavelength. In shadowgraph imaging, we used a xenon flash lamp or a halogen continuum lamp as a backlight to illuminate the ablation space. The image of the lamp light transmitted through the ablation space was captured using the ICCD camera or a high-speed camera. The temporal variations in the optical emission and the shadowgraph images were obtained by varying the delay time between the irradiation of the laser pulse for ablation and the trigger for the ICCD and high-speed cameras.
3. Results and discussion
3.1. Optical emission intensity of laser ablation plasma produced in supercritical H2O
In previous works, we examined the characteristics of laser ablation in liquid H2O.36) In this paper, we report the characteristics of laser ablation in supercritical H2O in comparison with those in liquid H2O at the same pressure. The experimental results in liquid H2O were not the data shown in previous papers but were obtained in this study at a water temperature of 230 °C. The critical point of H2O is at a pressure of 22.1 MPa and a temperature of 374 °C. For the irradiation of the YAG laser pulses in supercritical and subcritical H2O, it was difficult to determine the trajectory of the laser beam and to focus it. We adjusted the position of the focusing lens to form a circular ablation crater with a diameter of 1 mm on the target surface when the pressure and temperature of water were 0.1 MPa and 20 °C, respectively. However, we observed the distortion of the shape of the ablation crater when the water was heated to above 300 °C. The defocusing of the laser beam was more serious in the vertical direction (namely, the ablation crater became an ellipse). The vertical size of the ablation crater formed in supercritical H2O at a pressure of 30 MPa and a temperature of 430 °C was approximately 4.5 mm. In addition, we observed a shift in the ablation point in the vertical direction when we heated the water to a temperature above 300 °C, indicating a bend in the trajectory of the laser beam. The problems in the trajectory and focusing of the laser beam were considered to be caused by the spatial variation in the refractive index of water in the vertical direction. The spatial variation of the water temperature may be the mechanism of the spatial variation in the refractive index. Although we stirred the water inside the vessel, we could not obtain a straight trajectory and the uniform focusing of the ablation laser beam. Accordingly, considering the fact that the physics and chemistry of laser ablation are essentially determined by the laser fluence,37) we adjusted the energy of the laser pulse to keep the same laser fluence of 14 J/cm2 on the target surface at all water temperatures.
Figure 1 shows the temporal variation of the optical emission intensity of the plasma produced in supercritical H2O at a pressure of 30 MPa and a temperature of 430 °C. The maximum intensities of the optical emission images, which were captured at various delay times after the irradiation of the YAG laser pulse, are plotted in Fig. 1. An optical emission image at a given delay time was obtained by averaging 30 results to compensate for the shot-to-shot fluctuation. The temporal variation of the optical emission intensity observed in liquid H2O at a temperature of 230 °C and the same pressure (30 MPa) is also shown in Fig. 1 for comparison. The amplitudes of the two waveforms were normalized by their maxima. As was reported previously,21) the waveform of the optical emission intensity observed in liquid H2O roughly corresponded to the waveform of the YAG laser pulse. The waveform of the optical emission intensity observed in supercritical H2O was similar to that observed in liquid H2O especially in the spike part, as shown in Fig. 1(a) (linear plots). However, we observed that the optical emission intensity observed in supercritical H2O was stronger in the tail part. The difference between the optical emission intensities in the tail parts of the waveforms is clearly shown in Fig. 1(b) (semilogarithmic plots). We observed exponential decreases in the optical emission intensities in both liquid and supercritical H2O, but the decay time constant of 29.0 ns observed in supercritical H2O was much longer than that in liquid H2O (8.6 ns).

Download figure:
Standard image High-resolution image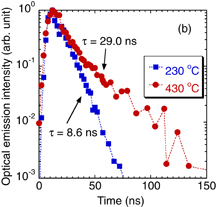
Fig. 1. Temporal variations of the optical emission intensities from laser-ablation plasmas produced in liquid (230 °C) and supercritical (430 °C) H2O. The pressure in both cases was 30 MPa. The same experimental results are plotted in (a) linear and (b) semilogarithmic scales.
Download figure:
Standard image High-resolution imageFigure 2 shows the spatial distributions of the optical emission intensities observed in supercritical (430 °C) and liquid (230 °C) H2O. The water pressure was 30 MPa in both cases. The spatial distributions in the normal direction to the target surface are plotted. These distributions were observed at the maxima in the temporal variations of the optical emission intensities (corresponding to a delay time of 12 ns). As shown in Fig. 2, the plasma with optical emission was transported more efficiently when it was produced in supercritical H2O. The size (FWHM) of the plasma produced in liquid H2O was less than 0.1 mm, while that of the plasma produced in supercritical H2O was greater than 0.2 mm. In addition, in the tail part, the plasma produced in supercritical H2O reached a distance of up to 1.2 mm from the target at a delay time of ∼10 ns after laser ablation.

Fig. 2. Spatial distributions of the optical emission intensities from laser-ablation plasmas produced in liquid (230 °C) and supercritical (430 °C) H2O. The pressure in both cases was 30 MPa. These distributions were observed at delay times corresponding to the maximum optical emission intensities in their temporal variations.
Download figure:
Standard image High-resolution imageThe laser ablation plasma produced in liquid H2O is so dense that the lifetime of the optical emission is determined not by the radiative lifetimes of excited states but by collisional quenching. This is the reason for the experimental result that the waveform of the optical emission intensity follows the waveform of the laser pulse in liquid-phase laser ablation. The longer decay time constant of the optical emission intensity observed in supercritical H2O shown in Fig. 1 indicates less significant collisional quenching. The longer lifetime of the optical emission intensity is related to the easier expansion of the ablation plume in supercritical H2O. This is confirmed experimentally as shown in Fig. 2. The transport length of 1 mm within a delay time of 10 ns indicates an expansion speed of 108 mm/s, which is much higher than the expansion speed of the plume in liquid-phase laser ablation (on the order of 106 mm/s)21,38) and is similar to the expansion speed of the plume in gas-phase laser ablation.39,40) Consequently, it can be concluded from the present experimental results that the confinement of the plume in supercritical H2O is much weaker than that in liquid H2O at the same pressure. Note here that the less significant quenching and weaker confinement of the plume in supercritical H2O may not be closely related to the higher laser energy (the laser fluence was adjusted to be the same by changing the laser energy in this experiment), since the quenching and confinement are phenomena determined by the collision rate, where the density of the collision partner in the medium is the most important quantity. However, the rate coefficients of collisions are affected by particle energies, and more investigations are necessary to determine the effects of laser energy on the quenching and confinement phenomena.
3.2. Optical emission intensity of laser ablation plasma produced in supercritical CO2
In the laser ablation experiment in supercritical CO2, we examined the effects of the pressure and temperature on the optical emission intensity in detail. We employed a weak YAG laser fluence of 0.6 J/cm2 in this experiment by not using focusing lenses. This fluence was below the threshold for achieving the laser ablation of the gold target in gaseous CO2. However, we observed the production of a laser ablation plasma when the YAG laser pulse with the same fluence irradiated the gold target in supercritical CO2.
Figure 3(a) shows the optical emission intensities of laser ablation plasmas observed at various temperatures and pressures of CO2. The optical emission intensities plotted in Fig. 3(a) are obtained by the spatiotemporal integration of the optical emission images. An optical emission image was obtained by averaging 10 results to compensate for the shot-to-shot fluctuation. The critical point of CO2 is at a pressure of 7.4 MPa and a temperature of 31.1 °C, and hence all the experiments shown in Fig. 3 were carried out in supercritical CO2. As shown in Fig. 3(a), the optical emission intensity of the laser ablation plasma produced in supercritical CO2 was significantly dependent on the pressure and temperature. In addition, as shown in Fig. 3(b), the diameter of the laser ablation plasma (FWHM in the spatial distribution) had a similar dependence on the optical emission intensity. Note here that, as shown in Fig. 3(c), the variations of the optical emission intensity and plasma size were not related to the variation of the laser fluence on the target surface. The transmission of the laser beam in supercritical CO2 was weakly dependent on the pressure and temperature, as shown in Fig. 3(c), and the variations of the optical emission intensity and plasma size were not related to the transmission. In addition, the distortion of the beam shape, which was observed in supercritical H2O, was negligible in supercritical CO2.

Fig. 3. Characteristics of laser ablation in supercritical CO2. (a) Optical emission intensities and (b) plasma sizes observed at various pressures and temperatures. The transmission of the laser beam for laser ablation is plotted in (c).
Download figure:
Standard image High-resolution imageFigure 4 shows a phase diagram of CO2. We superposed the contour plot of the optical emission intensity in the corresponding region of the pressure–temperature plane. The experimental data are the same as those shown in Fig. 3(a). The dashed curves show the relationships between the pressure and temperature corresponding to the mass densities of 200, 300, and 400 kg/m3. As shown in Fig. 4, the ridge line of the contour plot is roughly along the dashed curve corresponding to a density of ∼300 kg/m3. Therefore, Fig. 4 suggests that the experimental conditions that result in bright optical emissions of the plasmas are concentrated in the region corresponding to a density of ∼300 kg/m3.

Fig. 4. Phase diagram of CO2. The experimental result shown in Fig. 3(a) is superposed on the phase diagram in the form of a contour plot. The solid curves show the boundaries among gaseous, liquid, and supercritical CO2, and the dashed curves show the relationship corresponding to the constant densities of 200, 300, and 400 kg/m3.
Download figure:
Standard image High-resolution imageThe effect of the pressure of CO2 on the optical emission intensity of a laser ablation plasma at a temperature of 304.5 K35) has been discussed by Kato et al., who observed a bright optical emission intensity around the critical point. They pointed out the importance of the density fluctuation on the optical emission intensity on the basis of their experimental observations. Our experimental results shown in Figs. 3 and 4 partly support the argument of Kato et al., since we observed the optical emission of a laser ablation plasma only in supercritical CO2, suggesting the importance of the density fluctuation. In the following, we discuss the quantitative correlation between the optical emission intensity and the density fluctuation according to our experimental results. Figure 5 shows the magnitudes of the density fluctuations under the experimental conditions employed in Fig. 3(a). The relative values of the density fluctuations were evaluated from the product of the density, isothermal compressibility, and temperature.41) By comparing Fig. 5 with Fig. 3(a), it is understood that the variation of the optical emission intensity observed at a pressure of 8 MPa is roughly similar to the variation of the density fluctuation. However, at pressures of 10 and 12 MPa, the correlation between the optical emission intensity and the density fluctuation was rather weak. Therefore, according to our experimental results, which were observed in a regime deviated from the critical point, it is suggested that the density of CO2 is a more important parameter than the density fluctuation for obtaining a bright optical emission intensity of a laser ablation plasma produced in supercritical CO2. The paper published by Kato et al.35) suggests the singularity of the critical point where the density fluctuation is significantly large.

Fig. 5. Density fluctuations evaluated under the experimental conditions employed in Fig. 3(a).
Download figure:
Standard image High-resolution imageThe bright optical emission can be explained by the less significant collisional quenching of excited states. We observed similar trends in the optical emission intensity and plasma size, as shown in Figs. 3(a) and 3(b), respectively, which can be explained by the easier expansion of the plasma under a condition with less significant collisional quenching. However, we need a quantitative understanding of the relationship among the medium density, density fluctuation, and rate of quenching collisions to explain the experimental results shown in Figs. 3 and 4.
Even if it is possible to attribute the bright optical emission intensity to the less significant collisional quenching, it is still difficult to understand the mechanism of the reduced threshold of the laser fluence for laser ablation. This is because laser ablation is basically a phenomenon of light-matter interaction. The fundamental process of laser ablation is the thermal melting of the target. The thermal melting or the increase in the target temperature is caused by the electron–phonon interaction on the target surface. A possible explanation for the higher threshold fluence for laser ablation in high-pressure gaseous CO2 is the deexcitation of the electronic excited state on the target surface due to collision with CO2 molecules. However, the decay time constant of the electronic excited state on the gold surface due to the electron–phonon interaction is ∼1 ps,42,43) while the frequency of collision between CO2 molecules and Au atoms on the gold surface is expected to be 2 × 10¹⁰ s−1 at a pressure of 10 MPa. Hence, we could not expect the collisional deexcitation of the electronic excited state under our experimental conditions. Another possible explanation is related to the particular thermodynamic parameters of supercritical CO2. The threshold laser fluence becomes lower if the target is irradiated in a medium with a smaller thermal conductivity. However, it is known that the thermal conductivity of supercritical CO2 is greater than that of gaseous CO2, especially at a density corresponding to significant fluctuation.44) Note that the reduced threshold fluence for laser ablation has also been observed by Kato et al. in supercritical CO2.35) Further investigation is necessary to understand the fundamentals of laser ablation phenomena in supercritical fluids.
3.3. Shadowgraph imaging
Figure 6 shows shadowgraph images observed by laser ablation in supercritical H2O at a pressure of 30 MPa and a temperature of 430 °C. The shock front was captured as shown in Figs. 6(a) and 6(b) at delay times of 0.9 and 4 µs after laser ablation, respectively. The propagation speed of the shock front was approximately 530 m/s. The region inside the shock front was dark at a delay time of 0.9 µs, as shown in Fig. 6(a). Another small dark region was formed around the ablation point at a delay time of 4 µs, as shown in Fig. 6(b). The latter dark region expanded with time, as shown in Figs. 6(c) and 6(d). The maximum size of the dark region was observed at a delay time of 14 µs. The shape of the dark region was roughly hemispherical up to the maximum size. We observed the distortion of the edge of the dark region after the maximum size, as shown in Fig. 6(e). At a long delay time of 70 µs, the dark region was extinguished into the surrounding supercritical H2O, as shown in Fig. 6(f).

Fig. 6. Shadowgraph images observed by laser ablation in supercritical H2O at a pressure of 30 MPa and a temperature of 430 °C. The delay times after laser ablation are (a) 0.9, (b) 4, (c) 5, (d) 18, (e) 21, and (f) 70 µs.
Download figure:
Standard image High-resolution imageThe dark region shown in Fig. 6(a), which was observed inside the shock front at a delay time of 0.9 µs, may be attributed to the high densities of species ejected from the target. The size of the dark region was approximately 0.4 mm, which was similar to the size of the main body of the plasma with optical emission shown in Fig. 2. The shadowgraph image shown in Fig. 6(a) indicates the rapid expansion of the laser ablation plume into supercritical H2O.
The dark region in the shadowgraph images shown in Figs. 6(b)–6(d) indicates that the refractive index of this region is different from that of the surrounding supercritical H2O. The different refractive index may be caused by the rarefied medium density. The shadowgraph images of the dark region are similar to those of a cavitation bubble observed in liquid-phase laser ablation. The cavitation bubble in liquid-phase laser ablation is induced by the rapid vaporization of the liquid medium. The inside of the cavitation bubble is in the gas phase at a pressure on the order of 1 kPa.45) In this paper, we call the dark region shown in Figs. 6(b)–6(d) "a bubblelike hollow", since we are not sure whether the inside of the dark region is in the gas phase at a reduced pressure.
A markedly different feature of the dynamics of the bubblelike hollow from the cavitation bubble was that the bubblelike hollow never collapsed. It is well known that a cavitation bubble induced in liquid-phase laser ablation shrinks after it reaches its maximum size and collapses at a certain delay time after laser ablation.17,46,47) In contrast, the bubblelike hollow shown in Fig. 6 never shrank or collapsed. Another difference of the bubblelike hollow from the cavitation bubble was in its maximum size. Figure 7 shows a comparison of the maximum sizes of the bubblelike hollow and a cavitation bubble induced by laser ablation in liquid H2O at the same pressure of 30 MPa and a temperature of 20 °C. The maximum size of the cavitation bubble was 0.06 mm, which was observed at a delay time of 0.6 µs. After that, we observed the shrinkage and collapse of the cavitation bubble. On the other hand, the maximum size of the bubblelike hollow observed in supercritical H2O at the same pressure was 0.25 mm. The delay time corresponding to the maximum size was 14 µs. This indicates much easier expansion of the bubblelike hollow in supercritical H2O than the cavitation bubble in liquid H2O at the same pressure.

Download figure:
Standard image High-resolution image
Fig. 7. Comparison between the maximum sizes of a cavitation bubble induced by laser ablation in liquid H2O and a bubblelike hollow induced by laser ablation in supercritical H2O. The H2O temperatures are (a) 20 and (b) 430 °C. The pressure in both cases is 30 MPa.
Download figure:
Standard image High-resolution imageA comparison between the bubblelike hollows observed in supercritical and gaseous CO2 is shown in Fig. 8 . The laser fluence in this experiment was 10 J/cm2, achieved by focusing the YAG laser beam using a lens. We observed the formation of a bubblelike hollow by shadowgraph imaging even in gaseous CO2 at a pressure of 5 MPa and a temperature of 40 °C, as shown in Figs. 8(a)–8(c). The shadowgraph images of bubblelike hollows observed in supercritical CO2 (at a pressure of 8 MPa and a temperature of 40 °C) were similar to those observed in gaseous CO2, as shown in Figs. 8(d)–8(f), except for the smaller size. A smaller bubblelike hollow was observed in supercritical CO2 at a higher pressure. Kato et al. observed similar shadowgraph images in supercritical CO2 at different temperatures and pressures.35) The experimental results shown in Fig. 8 suggest that the dynamics of supercritical fluids as the medium of laser ablation are rather similar to the dynamics of ambient gas in gas-phase laser ablation. Sasaki and Watarai investigated the dynamics of ambient gas in gas-phase laser ablation by laser-induced fluorescence.48) They clearly observed the formation of a region with a rarefied ambient gas density around the ablation point. The dark regions observed by shadowgraph imaging in supercritical fluids may be similar to the region with a rarefied ambient gas density in gas-phase laser ablation, and are different from the cavitation bubble in liquid-phase laser ablation. However, the experimental results shown in Figs. 6 and 8 were observed in "gas-like" supercritical fluids. The comparison with bubblelike phenomena in "liquid-like" supercritical fluids is an interesting future work.

Fig. 8. Shadowgraph images observed by laser ablation in gaseous and supercritical CO2. (a)–(c) were observed at delay times of 5, 100, and 500 µs in gaseous CO2 at a pressure of 5 MPa, respectively. (d)–(f) were observed at the same delay times in supercritical CO2 at a pressure of 8 MPa. The temperature in all cases is 40 °C.
Download figure:
Standard image High-resolution image
4. Summary
In summary, we have shown the following.
(1) The optical emission of a laser-ablation plasma produced in supercritical H2O has a longer lifetime and a larger transport length than that produced in liquid H2O at the same pressure. This indicates less significant collisional quenching of excited states in supercritical H2O.
(2) The threshold fluence for laser ablation was lower in supercritical CO2 than in gaseous CO2. Bright optical emission intensities of laser ablation plasmas produced in supercritical CO2 were observed at pressures and temperatures corresponding to a density of ∼300 kg/m3. According to the present experimental results that were observed in a regime deviated from the critical point, the density itself is a more important parameter than the density fluctuation to obtain a bright optical emission intensity of a laser ablation plasma produced in supercritical CO2.
(3) Bubblelike hollows were formed at the densities of ambient supercritical fluids by laser ablation. The dynamics of the bubblelike hollow were different from the dynamics of a cavitation bubble induced by laser ablation in a liquid medium but relatively similar to the dynamics of ambient gas in gas-phase laser ablation.
Laser ablation in supercritical fluids is a new technique and shows unexpected experimental results such as the reduced threshold of the laser fluence for obtaining laser ablation. Further investigations are necessary to obtain a fundamental understanding of laser ablation phenomena in supercritical fluids.
Acknowledgment
This work was supported by Grants-in-Aid for Scientific Research on Innovative Areas "Frontier Science of Interactions between Plasmas and Nano-Interfaces" (Nos. 21110004 and 21110009) from the Ministry of Education, Culture, Sports, Science and Technology, Japan.
Biographies

Noriharu Takada received his Ph. D. in Engineering from Nagoya University, Nagoya, Japan, in 2005. He is currently working as an Engineer in Technical Center of Nagoya University. His current research interests include productions of nanoparticles and films using laser ablation and discharge plasma.

Siti Machmudah completed the doctoral course at Graduate School of Science and Technology, Kumamoto University in 2008. She was a postdoctoral researcher from 2008 to 2009, and a JSPS postdoctoral fellow from 2009 to 2011 in Kumamoto University. She continued her research in Kumamoto University and moved to Nagoya University as a researcher from 2012. Currently she is a senior lecturer in Chemical Engineering, Sepuluh Nopember Institute of Technology. She is interested in material processing with laser under supercritical fluids, material synthesis and extraction with supercritical fluids.
Hiroshi Goto received the M.S. degree from Nagoya University in 2012. From 2010 to 2012, he studied as a graduate student in Department of Electrical Engineering and Computer Science of Nagoya University on laser ablation process in supercritical water.

Wahyudiono received Ph. D. degree in the field of Material and Life Science from Kumamoto University in 2007. He was a Research Associate of Global COE from 2008 to 2009, and a JSPS postdoctoral fellow from 2009 to 2011 in Kumamoto University. He continued his research in Kumamoto University, and moved to Nagoya University as a researcher from 2012. His current research fields cover material synthesis, extraction and reaction under supercritical fluids with plasma and laser processing combination.

Motonobu Goto received B.S., M.S., and Dr. Eng. from Nagoya University in 1979, 1981, and 1984, respectively, in Chemical Engineering. After working as a research associate at Nagoya University, he moved to Kumamoto University as an associate professor in 1988. He became an associate professor in 1993, and then a professor in 2001. He moved to Nagoya University in 2012. His current research interests are supercritical fluid technology and plasma technology. Especially, he is working on the reaction and material synthesis processes induced by plasma in supercritical fluids.

Koichi Sasaki received B.S., M.S., and Ph. D. from Nagoya University in 1987, 1989, and 1991, respectively, in electrical engineering and electronics. In 1991 he became an assistant professor at Nagoya University, and since 2010 he is a professor at the Division of Quantum Science and Engineering, Hokkaido University. His research field is applications of low-temperature plasmas.