
Denitrifying metabolism of the methylotrophic marine bacterium Methylophaga nitratireducenticrescens strain JAM1
- Published
- Accepted
- Received
- Academic Editor
- Ludmila Chistoserdova
- Subject Areas
- Environmental Sciences, Microbiology, Molecular Biology, Biogeochemistry
- Keywords
- Denitrification, Marine bacterium, Methylophaga, Nitrous oxide, Nitrate
- Copyright
- © 2017 Mauffrey et al.
- Licence
- This is an open access article distributed under the terms of the Creative Commons Attribution License, which permits unrestricted use, distribution, reproduction and adaptation in any medium and for any purpose provided that it is properly attributed. For attribution, the original author(s), title, publication source (PeerJ) and either DOI or URL of the article must be cited.
- Cite this article
- 2017. Denitrifying metabolism of the methylotrophic marine bacterium Methylophaga nitratireducenticrescens strain JAM1. PeerJ 5:e4098 https://doi.org/10.7717/peerj.4098
Abstract
Background
Methylophaga nitratireducenticrescens strain JAM1 is a methylotrophic, marine bacterium that was isolated from a denitrification reactor treating a closed-circuit seawater aquarium. It can sustain growth under anoxic conditions by reducing nitrate () to nitrite (). These physiological traits are attributed to gene clusters that encode two dissimilatory nitrate reductases (Nar). Strain JAM1 also contains gene clusters encoding two nitric oxide (NO) reductases and one nitrous oxide (N2O) reductase, suggesting that NO and N2O can be reduced by strain JAM1. Here we characterized further the denitrifying activities of M. nitratireducenticrescens JAM1.
Methods
Series of oxic and anoxic cultures of strain JAM1 were performed with N2O, or sodium nitroprusside, and growth and N2O, , and N2 concentrations were measured. Ammonium ()-free cultures were also tested to assess the dynamics of N2O, and . Isotopic labeling of N2O was performed in 15NH4+-amended cultures. Cultures with the JAM1ΔnarG1narG2 double mutant were performed to assess the involvement of the Nar systems on N2O production. Finally, RT-qPCR was used to measure the gene expression levels of the denitrification genes cytochrome bc-type nitric oxide reductase (cnorB1 and cnorB2) and nitrous oxide reductase (nosZ), and also nnrS and norR that encode NO-sensitive regulators.
Results
Strain JAM1 can reduce NO to N2O and N2O to N2 and can sustain growth under anoxic conditions by reducing N2O as the sole electron acceptor. Although strain JAM1 lacks a gene encoding a dissimilatory reductase, -amended cultures produce N2O, representing up to 6% of the N-input. was shown to be the key intermediate of this production process. Upregulation in the expression of cnorB1, cnorB2, nnrS and norR during the growth and the N2O accumulation phases suggests NO production in strain JAM1 cultures.
Discussion
By showing that all the three denitrification reductases are active, this demonstrates that M. nitratireducenticrescens JAM1 is one of many bacteria species that maintain genes associated primarily with denitrification, but not necessarily related to the maintenance of the entire pathway. The reason to maintain such an incomplete pathway could be related to the specific role of strain JAM1 in the denitrifying biofilm of the denitrification reactor from which it originates. The production of N2O in strain JAM1 did not involve Nar, contrary to what was demonstrated in Escherichia coli. M. nitratireducenticrescens JAM1 is the only reported Methylophaga species that has the capacity to grow under anoxic conditions by using and N2O as sole electron acceptors for its growth. It is also one of a few marine methylotrophs that is studied at the physiological and genetic levels in relation to its capacity to perform denitrifying activities.
Introduction
The complete denitrification pathway describes the successive reduction of nitrate () to nitrite (), nitric oxide (NO), nitrous oxide (N2O), and nitrogen (N2) (Van Spanning, Delgado & Richardson, 2005). This process is used by bacteria for respiration in environments with low oxygen concentrations and with as an electron acceptor. The process is driven by metalloenzymes reductase, reductase, NO reductase, and N2O reductase (Einsle & Kroneck, 2004). As a facultative trait, denitrification occurs frequently across environments and is performed by bacteria of diverse origins (Zumft, 1997). However, numerous bacterial strains have been isolated with incomplete denitrification pathway, meaning that at least one reductase-encoding gene cluster is missing. As proposed by Zumft (Zumft, 1997), the four steps of reduction from to N2 could be seen as a modular assemblage of four partly independent respiratory processes that respond to combinations of different external and internal signals. This could explain the vast diversity of bacteria with incomplete denitrification pathway that can sustain growth with one of the four nitrogen oxides as electron acceptor. Another purpose of the incomplete pathway is related to detoxification, as and NO are deleterious molecules (Kaspar, 1982; Poole, 2005; Schreiber et al., 2012; Simon & Klotz, 2013).
Methylophaga nitratireducenticrescens JAM1 is a marine methylotrophic gammaproteobacterium that was isolated from a naturally occurring multispecies biofilm that has developed in a methanol-fed, fluidized denitrification system that treated recirculating water of the marine aquarium in the Montreal Biodome (Auclair et al., 2010; Villeneuve et al., 2013). This biofilm is composed of at least 15 bacterial species and of numerous protozoans (Labbé et al., 2003; Laurin et al., 2008), among which Methylophaga spp. and Hyphomicrobium spp. compose more than 50% of the biofilm (Labbé et al., 2007). Along with the denitrifying bacterium Hyphomicrobium nitrativorans NL23, M. nitratireducenticrescens JAM1 was shown to be the representative of the Methylophaga population in the biofilm (Auclair et al., 2010).
M. nitratireducenticrescens JAM1 is considered as a nitrate respirer as it can grow under anoxic conditions through the reduction of to , which accumulates in the culture medium (Auclair et al., 2010). This trait is correlated with the presence of two gene clusters encoding dissimilatory nitrate reductases (narGHJI, referred as Nar1 and Nar2) in the genome of M. nitratireducenticrescens JAM1, which we showed that both contribute to reduction during strain JAM1 growth (Mauffrey, Martineau & Villemur, 2015). Anaerobic growth by strain JAM1 is a unique among Methylophaga spp. that were described as strictly aerobic bacteria (Boden, 2012). Genome annotation revealed that strain JAM1 seems to maintain an incomplete denitrification pathway with the presence of gene clusters encoding two putative cytochrome bc-type complex NO reductase (cNor) (cnor1 and cnor2) and one putative dissimilatory N2O reductase, but lacks gene encoding a dissimilatory copper- (NirK) or cytochrome cd1-type (NirS) reductase. These gene clusters have been shown to be transcribed. However, the capacity of M. nitratireducenticrescens JAM1 to consume NO and N2O has not been fully determined. In addition to these gene clusters, genes involved in the NO response such as nnrS and norR are present (Mauffrey, Martineau & Villemur, 2015) suggesting tight regulation of denitrification genes such as cnorB and nosZ. Finally, the genome has a gene cluster encoding assimilatory nitrate and NADH-dependent nitrite reductases.
In this study, we assessed further the denitrification activities of strain JAM1 in pure cultures by demonstrating the consumption of NO and N2O by strain JAM1 in cultures amended with N2O or sodium nitroprusside as NO provider. Through our investigation, we found that strain JAM1 cultured with generates a small amount of N2O. We assessed whether nitrate and the nitrate reductases, nitrite and ammonium are directly involved in this N2O production, and found that is a key intermediate of this production process. Finally, we showed that the N2O accumulation/consumption cycle in -amended cultures affects the expression of denitrification genes cnorB (cnorB1 and cnorB2) and nosZ, and also nnrS and norR, which encode NO-sensitive regulators. These results suggest that NO is also generated in -amended cultures.
Materials and Methods
Bacterial growth conditions
M. nitratireducenticrescens JAM1 and the JAM1ΔnarG1narG2 double mutant were cultured in the American Type Culture Collection (ATCC, Manassas, VA, USA) Methylophaga medium 1403 (Villeneuve et al., 2013; Mauffrey, Martineau & Villemur, 2015). When required, (NaNO3) or (NaNO2) (Fisher Scientific Canada, Ottawa, ON, Canada) were added to the medium. Medium (40 or 60 mL) was dispensed into 720-mL bottles (680- or 660-mL head space) that were sealed with caps equipped with septum and which were then autoclaved. After autoclaving, the following filter-sterilized solutions were added to the bottles (40 mL volume): 120 µL methanol (final concentration 0.3% [vol/vol]; 74.3 mM), 800 µL solution T (per 100 mL: 0.7 g KH2PO4, 10 g NH4Cl, 10 g Bis-Tris, 0.3 g ferric ammonium citrate (pH 8)), 400 µL Wolf’s mineral solution (pH 8) (ATCC), and 40 µL vitamin B12 (stock solution 0.1 mg/mL). The Wolf mineral solution is composed of (per liter) 0.5 g EDTA, 3.0 g MgSO4.7H2O, 0.5 g MnSO4.H2O, 1.0 g NaCl, 0.1 g FeSO4.7H2O, 0.1 g Co(NO3)2.6H2O, 0.1 g CaCl2 (anhydrous), 0.1 g ZnSO4.7H2O, 0.010 g CuSO4.5H2O, 0.010 g AlK(SO4)2 (anhydrous), 0.010 g H3BO3, 0.010 g Na2MoO4.2H2O, 0.001 g Na2SeO3 (anhydrous), 0.010 g Na2WO4.2H2O, and 0.020 g NiCl2.6H2O. The final concentration of ammonium () in the Methylophaga 1403 medium was measured as 21 mg-N vial−1 (20.9 mg-N vial−1 from NH4Cl and 0.1 mg-N vial−1 from ferric ammonium citrate). The amount of NO carried by the Wolf mineral solution (0.0038 mg-N vial−1) was deemed negligible. For the anoxic cultures, bottles were flushed with nitrogen gas (N2, purity >99.9%; Praxair, Mississauga, ON, Canada) or argon (purity 99.9%, Praxair) for 20 min prior to autoclaving. When necessary, N2O (purity 99.9%, Praxair) and acetylene (10% [vol/vol] of headspace; Praxair) were injected into the headspace before autoclaving. Acetylene is an inhibitor of nitrous oxide reductase and has been extensively used in N2O studies to observe N2O production in cells (Klemedtsson et al., 1977). Inoculums were made from fresh culture cultivated under oxic conditions without to reach an optical density (OD600) of 0.025. Culture bottles were incubated at 30 °C in the dark. For oxic cultures, bottles were shaken at 150 rpm.
The capacity for strain JAM1 to reduce NO was tested with sodium nitroprusside (sodium nitroprusside hypochloride ([SNP]; purity ≥99.0%, Sigma-Aldrich, St. Louis, MO, USA) as the NO source. To avoid SNP toxicity, strain JAM1 was first cultured in Methylophaga 1403 medium under oxic conditions without for 24 h. The cells were then centrifuged (8,000 g 5 min) and dispersed into fresh medium supplemented with 2 mM, 5 mM, or no SNP. Culture medium with 5 mM SNP and no biomass was also used as a control. Cells were incubated under oxic conditions at 30 °C in the dark, and N2O production was monitored. To investigate the potential role of in N2O production, NH4Cl-free cultures were employed under oxic and anoxic conditions using solution T containing no NH4Cl. Prior to inoculation, cells from start-up cultures were centrifuged and rinsed three times with saline solution to remove any residual traces of .
Bacterial growth was monitored by spectrophotometry (OD600). Bacterial flocs were dispersed with a Potter-Elvehjem homogenizer prior to measurement. Oxygen concentrations in the headspace were monitored in cultures under oxic conditions by gas chromatography using a temperature conductivity detector (7890B series GC Custom, SP1 option 7890-0504/0537; Agilent Technologies, Mississauga, ON, Canada). Although vials were capped in the oxic cultures, O2 concentrations in the headspace (680 ml) did not significantly decrease (T0 h = 20.4 ± 0.3%; T100 h = 19.7 ± 0.9%).
15N-labeling of N2O
Strain JAM1 cultures were made with 22 mg-N vial−1 Na15NO3 (Sigma-Aldrich) in NH4Cl-free medium or with 22 mg-N vial−1 Na14NO3 and 20.7 mg-N vial−1 15NH4Cl (Sigma-Aldrich). Both cultures were used under anoxic conditions, and 10% (vol/vol) acetylene was added to allow N2O to accumulate. Cultures were made in triplicate. After 14 days of incubation, the headspace of each replicate was pooled, and 100 mL of the gaseous phase was sampled in Tedlar bags. N2O-isotope measurements were performed at the Environmental Isotope Laboratory (Earth & Environmental Sciences; University of Waterloo, ON, Canada) via Trace Gas-GVI IsoPrime-Isotope Ratio Mass Spectrometry (TG-IRMS). 45[N2O]/44[N2O] and 46[N2O]/44[N2O] ratios were calculated according to the peak intensity measured for 46[N2O], 45[N2O] and 44[N2O]. The 15N/14N isotopic ratio was derived from the previous results from Eq. (1). (1) where Rs is the sample isotopic ratio. Calculated from the 45[N2O]/44[N2O] and 46[N2O]/44[N2O] isotopic ratios, 14N45 is the quantity of 14N in 45[N2O], 15N45 is the quantity of 15N in 45[N2O], 14N44 is the quantity of 14N in 44[N2O] and 15N46 is the quantity of 15N in 46[N2O]. We considered the isotope fractionation by denitrification enzymes as negligible in our calculations (delta values ranging from −10‰ to −40‰) (Snider, Schiff & Spoelstra, 2009).
Measurements of nitrogenous compounds
and concentrations were determined by ion chromatography using the 850 Professional IC (Metrohm, Herisau, Switzerland) with a Metrosep A Supp 5 analytical column (250 mm × 4.0 mm).
N2O and N2 concentrations were determined by gas chromatography. Headspace samples (10 mL) were collected using a Pressure Lok gastight glass syringe (VICI Precision Sampling Inc., Baton Rouge, LA, USA) and were injected through the injection port of a gas chromatograph equipped with a thermal conductivity detector and electron-capture detector (7890B series GC Custom, SP1 option 7890-0504/0537; Agilent Technologies). The reproducibility of the N2O was assessed before each set of measurements via the repeated analysis of certified N2O standard gas with standard deviations <5%. N2O standards (500 ppmv and 250 ppmv) were created based on dilutions from the 10,000 ppmv N2O stock standard. The 10,000 ppmv stock standard was obtained by injecting 1% pure N2O (Praxair) into a 720 mL gastight bottle. The detection limit of the N2O was set to <10 ppbv, corresponding to the 0.3 nmol/vial composition of our bioassays. No significant N2O production patterns were observed through our blank experiments involving sterile media and empty glass bottles. The total quantity of N2O in the culture bottle (aqueous phase and headspace) (XN2O in µmole vial−1) was calculated according to Eq. (2). (2) where AN2O: the N2O mixing ratio measured in the headspace (µmoleN2O mole−1); P: 1 atm; V1 and Vg: volume of the aqueous (0.04 or 0.06 L vial−1) and gaseous phases (0.68 or 0.66 L vial−1), respectively; and Vn: molar volume (RT (gas constant): 0.08206 L atm K−1 mol−1 * 303 K = 24.864 L mol−1). KH30sw is the corrected Henry’s constant for seawater at 30 °C (0.01809 mol L−1 atm−1) according to Weiss and Price (1980). XN2O was then converted (Eq. (3)) into mg-N vial−1 for an easier calculation of mass balances using the other nitrogenous compounds: (3) The reproducibility of the N2 was assessed before each set of measurements via a repeated analysis of N2 (purity >99.99%, Praxair) diluted in a 720 mL gastight bottle (0 and 500 ppmv) flushed with argon (purity >99.99%, Praxair). The total quantity of N2 in the culture bottles was only considered for the headspace, as the quantity of dissolved N2 in the aqueous phase was considered to be negligible in our experimental design based on Henry’s constant (0.0005 mol L−1 atm−1) and was thus calculated according to Eq. (4). (4)
RNA extraction
Anoxic cultures of strain JAM1 were created in an NH4Cl-free 1403 medium supplemented with 22 mg-N vial−1 . Cells were harvested at specific times, and RNA was immediately extracted using the PureLink RNA mini kit (Ambion Thermo Fisher Scientific, Burlington, ON, Canada). RNA extracts were treated twice with TurboDNase (Ambion), and RNA quality was verified by agarose gel electrophoresis. The absence of remaining DNA was checked via the end-point polymerase chain reaction (PCR) amplification of the 16S rRNA gene using RNA extracts as the template.
Gene expression
cDNAs samples were generated from the RNA using hexameric primers and the Reverse Transcription System developed by Promega (Madison, WI, USA) with 1 µg of RNA and quantified by spectrophotometry. Real-time quantitative PCR (qPCR) assays were performed using the Faststart SYBR Green Master (Roche Diagnostics, Laval, QC, Canada) according to the manufacturer’s instructions. All reactions were performed in a Rotor-Gene 6000 real-time PCR thermocycler (Qiagen Inc. Toronto, ON, Canada), and each reaction contained 25 ng of cDNA and 300 nM of primers (Table 1). Genes tested included cnorB1, cnorB2, nnrS, nosZ, norR and nr, and the reference genes dnaG, rpoD and rpoB (Mauffrey, Martineau & Villemur, 2015) and the PCR began with an initial denaturation step of 10 min at 95 °C followed by 40 cycles of 10 s at 95 °C, 15 s at 60 °C, and 20 s at 72 °C. To confirm the purity of the amplified products, a melting curve analysis was performed by increasing the temperature from 65 °C to 95 °C at increments of 1 °C per step with a pause of 5 s included between each step. All genes for each sample and standard were tested in a single run. The amplification efficiency level was tested for each set of primer pairs by qPCR using a dilution of strain JAM1 genomic DNA as the template. The amplification efficiencies for all primer pairs varied between 0.9 and 1.1. The copy number of each gene was calculated according to standard curves using dilutions of strain JAM1 genomic DNA. The gene expression levels of the targeted genes were standardized with the three reference genes. The RNA extraction and qPCR were performed with three to four independent biological replicates. The significance of differential expression levels was tested for each phase against the pre-culture phase using One-way ANOVA tests with Tukey post hoc tests.
| Primers | Target gene | Locus tag* | Sequence (5′–3′) |
|---|---|---|---|
| cytochrome bc-type complex NO reductases | |||
| cnorB1-510f | cnorB1 | Q7A_0433 | CCTGATCGGTTTGGCTCTC |
| cnorB1-635r | CCCATGATCAATTCCCAGAC | ||
| cnorB2-334f | cnorB2 | Q7A_0487 | GGCAACAAGCTATTGGAGCA |
| cnorB2-449r | GTGGTGGTAAAGCGACCAGA | ||
| N2O reductase | |||
| nosZ-826f | nosZ | Q7A_0459 | GAGCGTGACTGGGTAGTCGT |
| nosZ-952r | GTGTCAACTCGCTCCCTTTG | ||
| NO-sensitive regulators | |||
| nnrs-749f | nnrS | Q7A_1801 | TGTTCGCCATTTCAGCAATA |
| nnrs-848r | TAACCGATGTGCAAAGACCA | ||
| norR-265f | norR | Q7A_0435 | CGGTTTGCTGCAGATAGTGA |
| norR-386r | CCCCAGGGCCTGTTATTTAT | ||
| Assimilatory nitrate reductase | |||
| nr-1350f | nr | Q7A_2619 | ATTCGGTACAGTCGGTTTGC |
| nr-1474r | TGTCTGGATTATTGCCACCA | ||
| Reference genes | |||
| dnaG-774f | dnaG | Q7A_342 | CATCCTGATCGTGGAAGGTT |
| dnaG-894r | GCTGCGAATCAACTGACGTA | ||
| rpob (3861F) | rpoB | Q7A_2329 | TGAGATGGAGGTTTGGGCAC |
| rpob (4006R) | GCATACCTGCATCCATCCGA | ||
| rpoD (10F) | rpoD | Q7A_343 | CAGCAATCACGCGTTAAAGA |
| rpoD(153R) | ACCCAGGTCGCTGAACATAC | ||
Notes:
Results
M. nitratireducenticrescens JAM1 grows on N2O under anoxic conditions
Strain JAM1 was cultured under anoxic conditions with either in the medium or with N2O injected in the headspace as the sole electron acceptor. Both types of culture received the same electron equivalent of or N2O (1.3 mmole vial−1 or 18.2 and 36.4 mg-N vial−1, respectively) according to: (5) (6) In N2O-amended cultures, N2O decrease was apparent from the start and consumption continued for 48 h (Fig. 1A). The N2O decrease paralleled strain JAM1 growth with almost complete N2O consumption. The -amended cultures showed complete consumption and equivalent accumulation after 24 h (Fig. 1B). However, slower growth than that recorded for the N2O cultures was observed. Such growth kinetics could be related to the toxicity of that accumulated in the medium. Both types of culture reached equivalent biomass concentration (t test on the last 4-time points, P > 0.05).
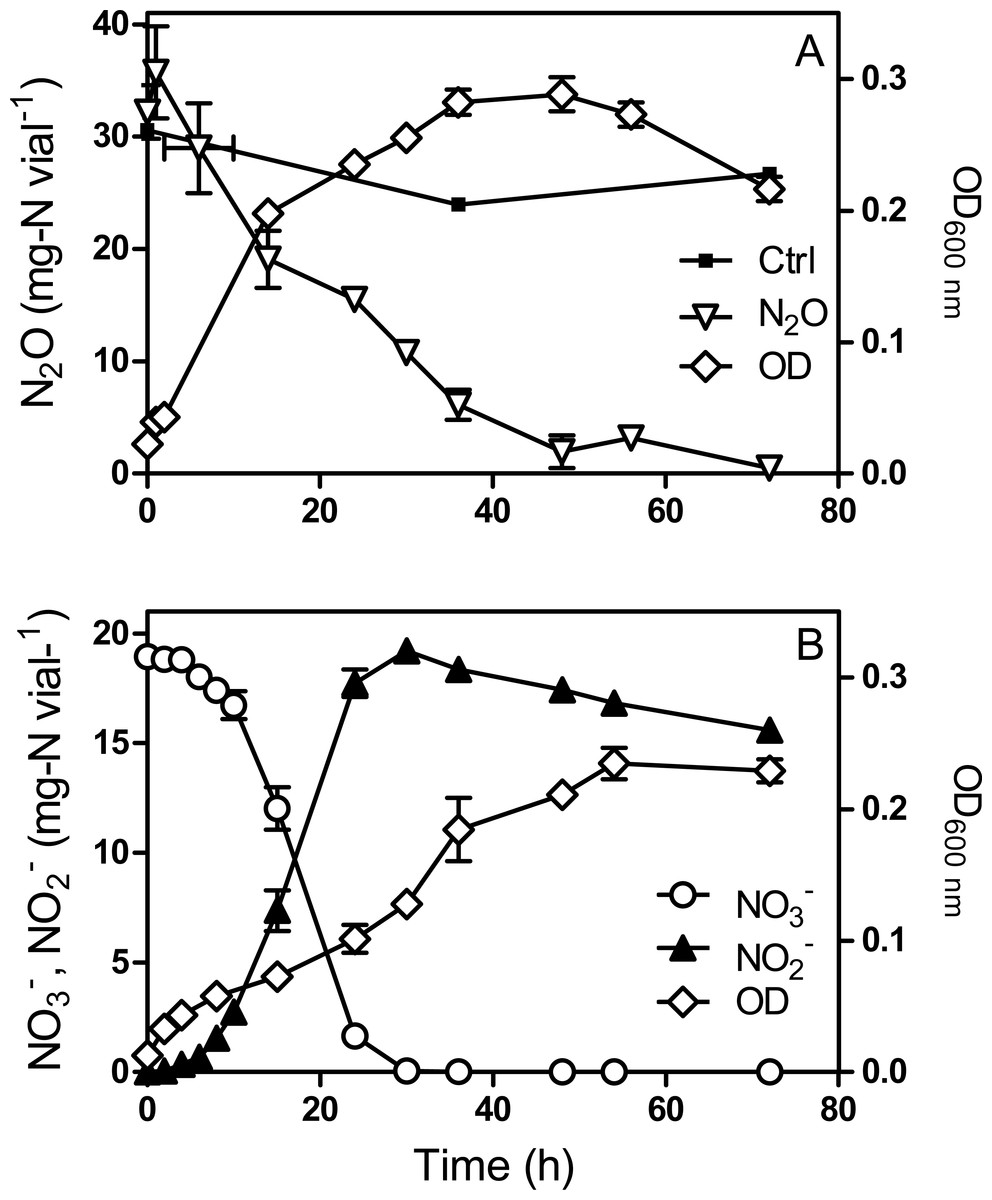
Figure 1: Methylophaga nitratireducenticrescens JAM1 growth with N2O or as an electron acceptor.
Strain JAM1 was cultured with 36.4 mg-N vial−1 N2O (A) or 18.2 mg-N vial−1 (B) under anoxic conditions. N2O, and concentrations and growth were measured over different time intervals. Control (A): N2O injected in non-inoculated vials. To minimize oxygen contamination, sampling was performed using a glove bag inflated with nitrogen gas. Data represent mean values ± standard deviation (SD; n = 3).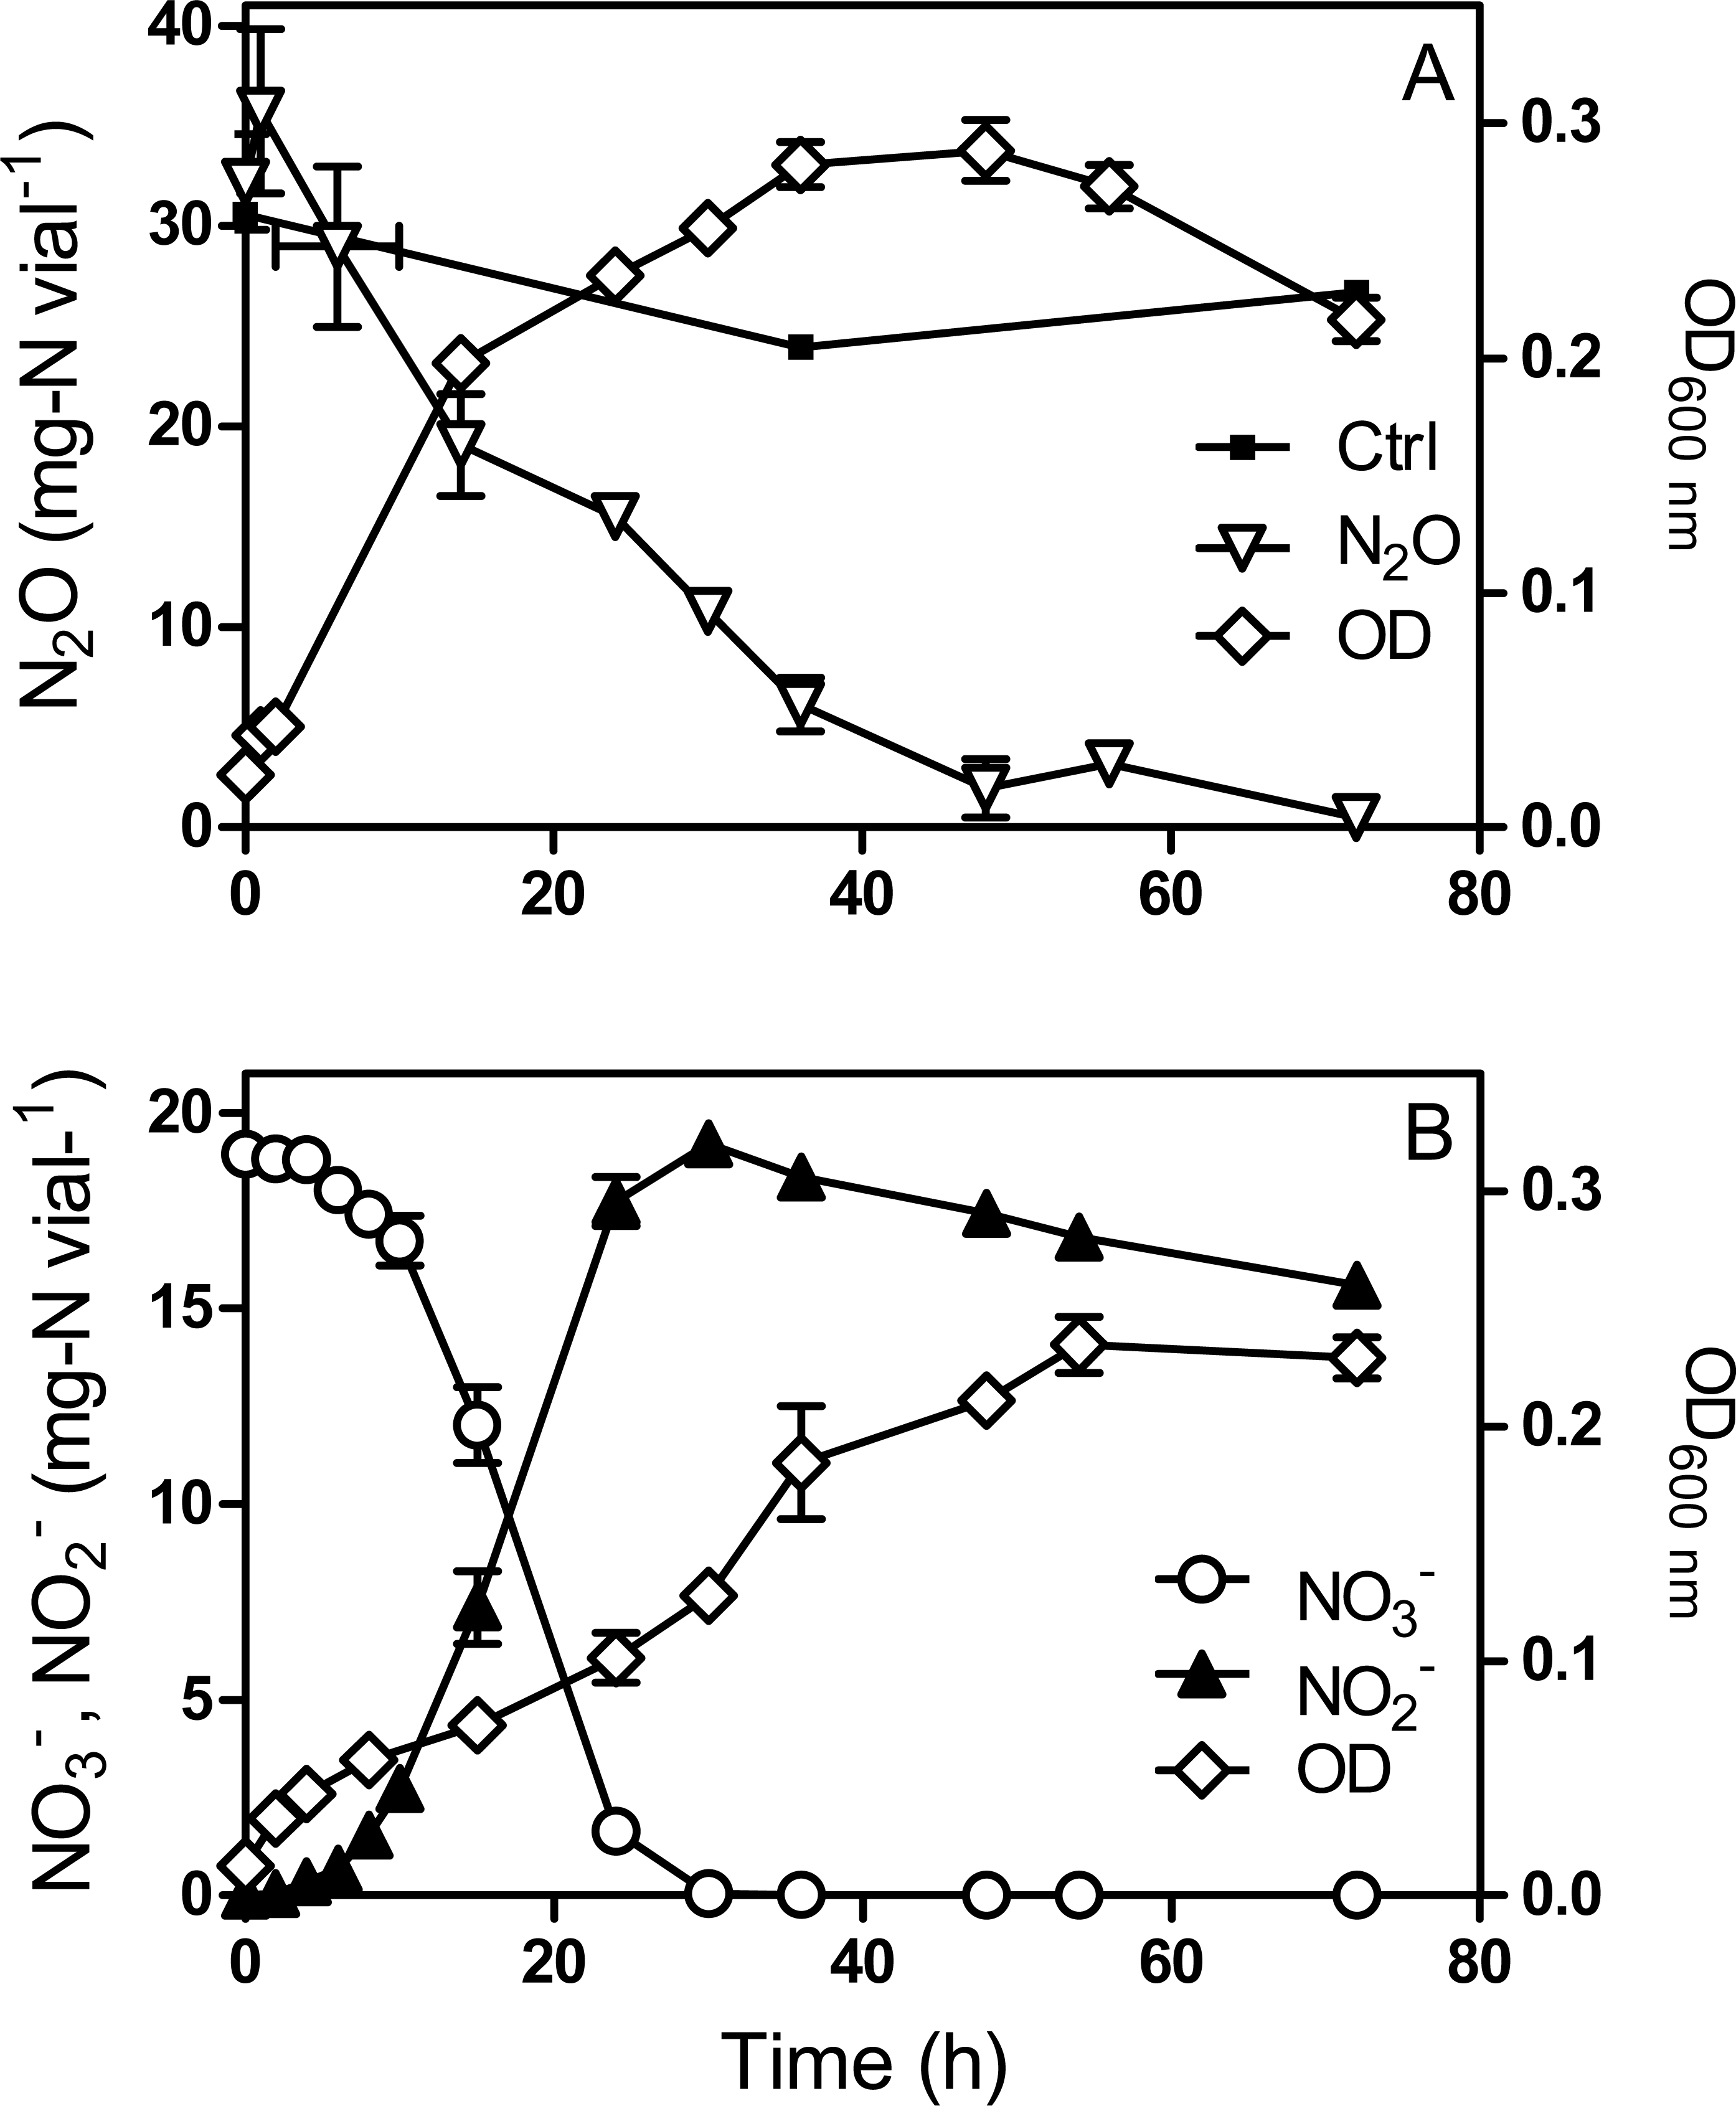
M. nitratireducenticrescens JAM1 consumes N2O under oxic conditions
In a previous study, Mauffrey, Martineau & Villemur (2015) demonstrated that strain JAM1 can consume under oxic growth conditions with equivalent accumulation of . We tested if this was also the case with N2O. Culturing strain JAM1 under oxic conditions with N2O (3.5 mg-N vial−1) showed a complete N2O consumption within 24 h (Fig. 2). Growth patterns illustrated in Fig. 2 were similar between oxic cultures amended with or without either N2O or . In the presence of O2, cultures reached higher (4–5 times) biomass concentration than the anoxic cultures.
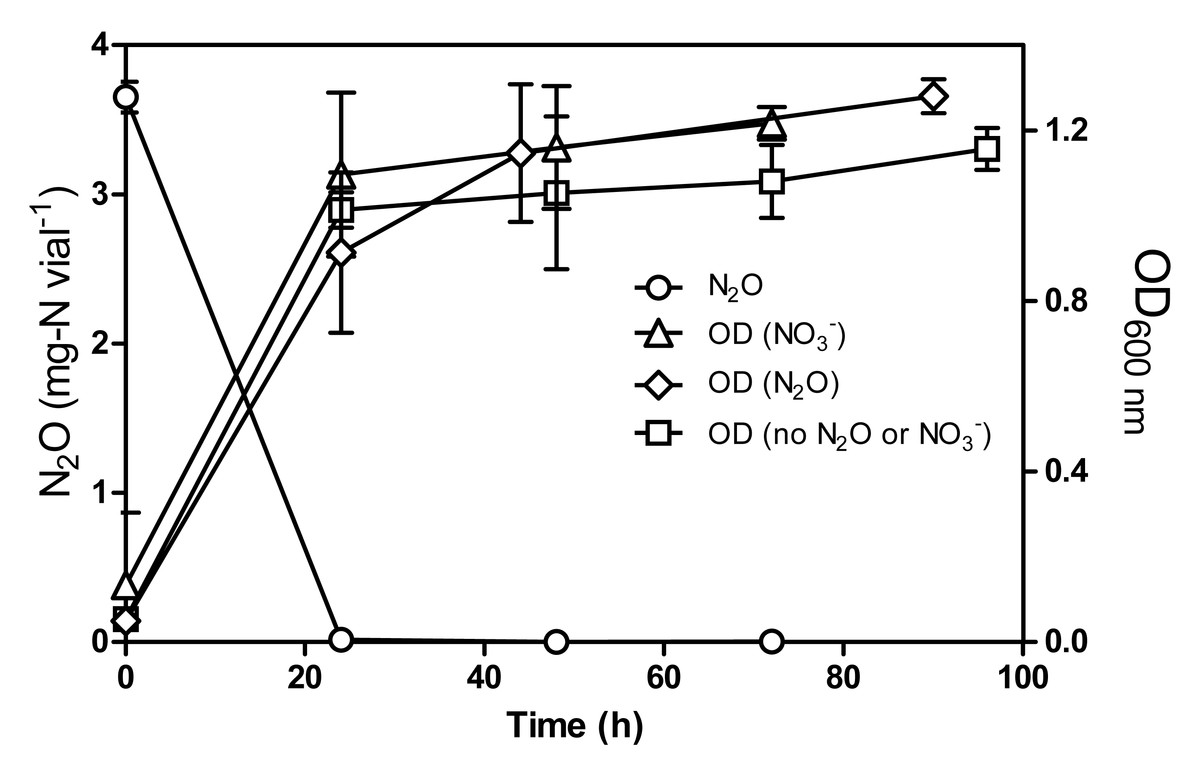
Figure 2: N2O consumption by Methylophaga nitratireducenticrescens JAM1 under oxic conditions.
Strain JAM1 was cultured with 3.5 mg-N vial−1 N2O, with 22 mg-N vial−1 or without N2O and , and under oxic conditions. N2O concentration was measured in N2O-amended cultures only. Growth were measured over different time intervals. Data represent mean values ± SD (n = 3).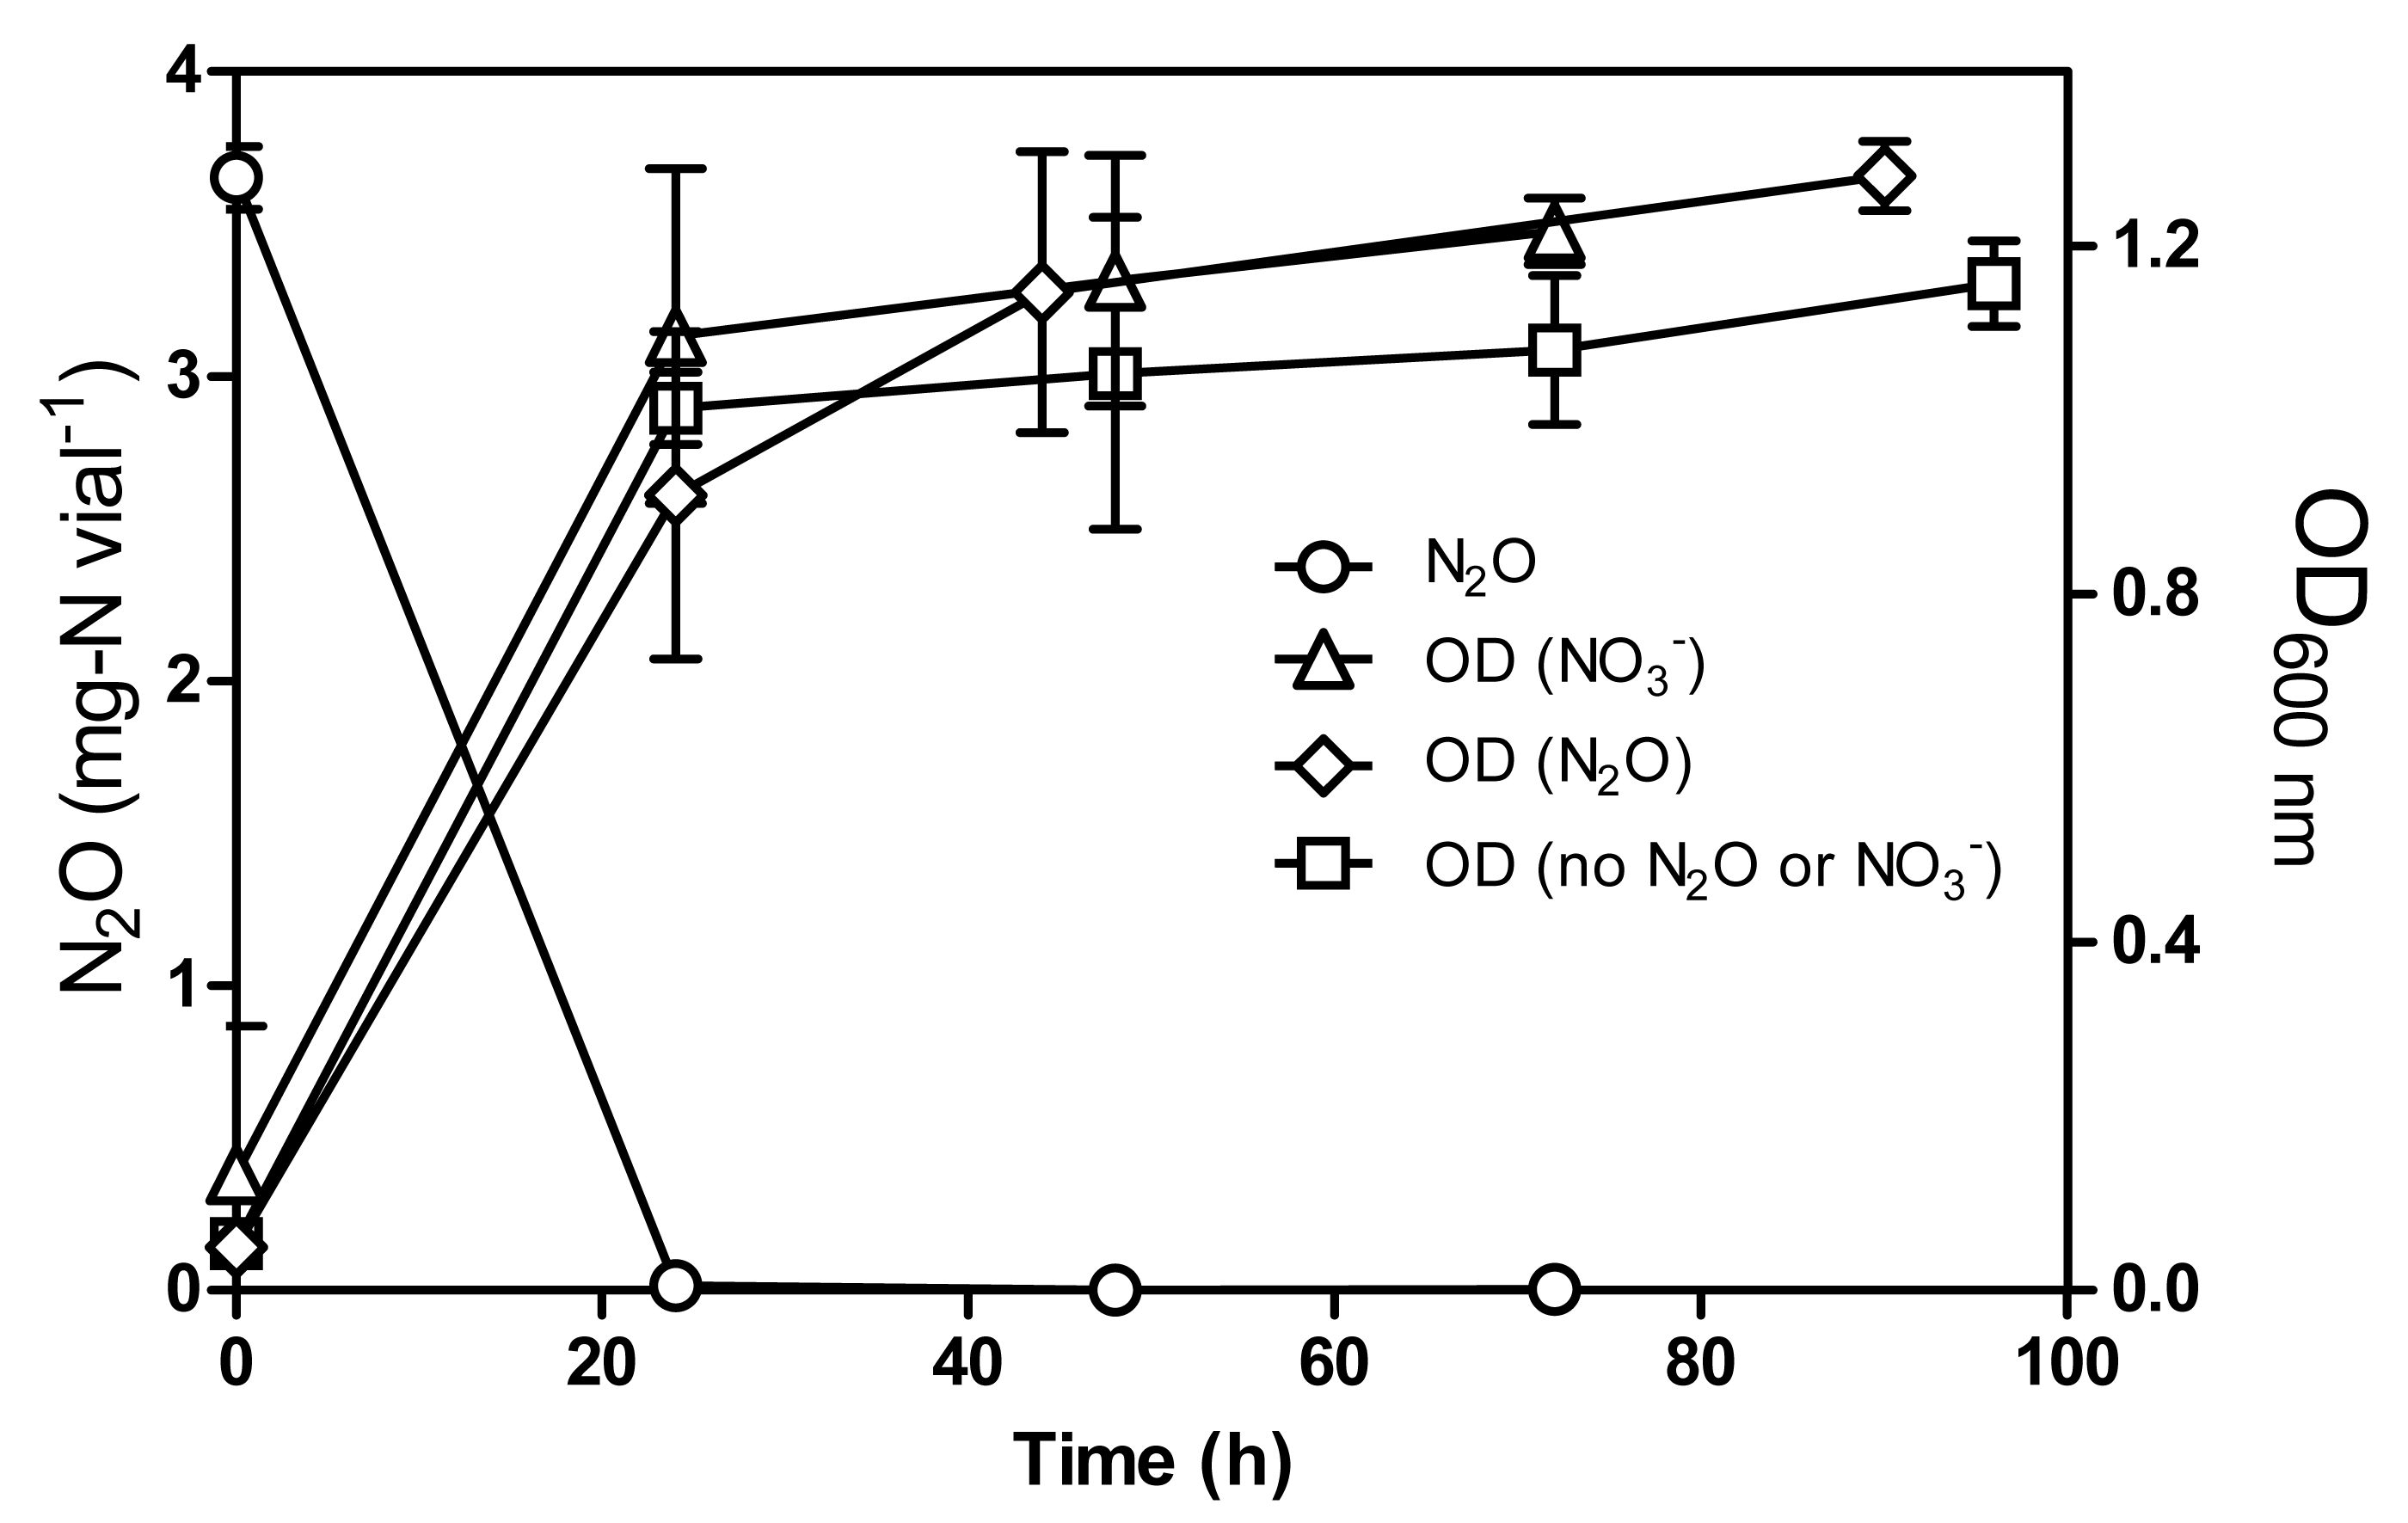
N2O production in -amended cultures
During the first assays to test the capacity of strain JAM1 to reduce N2O under anoxic conditions, cultures were performed with N2O (3.5 mg-N vial−1) but with the addition of (20 mg-N vial−1) to make sure that growth would occur. Although N2O was completely consumed within 24 h, a net production of N2O was observed after 48 h. To further investigate this observation, strain JAM1 was cultured under anoxic conditions with , and , and N2O were measured (Fig. 3A). Complete reduction (19.3 ± 0.3 mg-N vial−1) was performed within 55 h. The level reached 17.5 ± 0.2 mg-N vial−1 over this period and decreased slowly to 15.9 ± 0.5 mg-N vial−1. N2O production initiated when was nearly reduced and reached 0.70 ± 0.21 mg-N vial−1 after 55 h of incubation (Fig. 3A). N2O was completely reduced after 127 h. In parallel, for cultures in which the headspace was flushed with argon, N2 production was also measured. The corresponding results show an increase of N2 in the headspace (Fig. 3A) by 1.14 ± 0.54 mg-N vial−1 after 127 h, which represent 6.0 ± 2.9% of the N input. As the Methylophaga 1403 medium contains ferrous chloride (216 µmole vial−1), N2O production could originate from the abiotic reaction between that accumulated in the cultures and the ferrous ion (Klueglein et al., 2014). An abiotic control was performed with 18.2 mg-N vial−1 . N2O was detected in the abiotic control after 20 h and reached 0.00172 ± 0.00012 mg-N vial−1 after 114 h, which is 407 times lower than the N2O concentration measured in the anoxic cultures. This results showed that the abiotic reaction generated negligible amount of N2O.
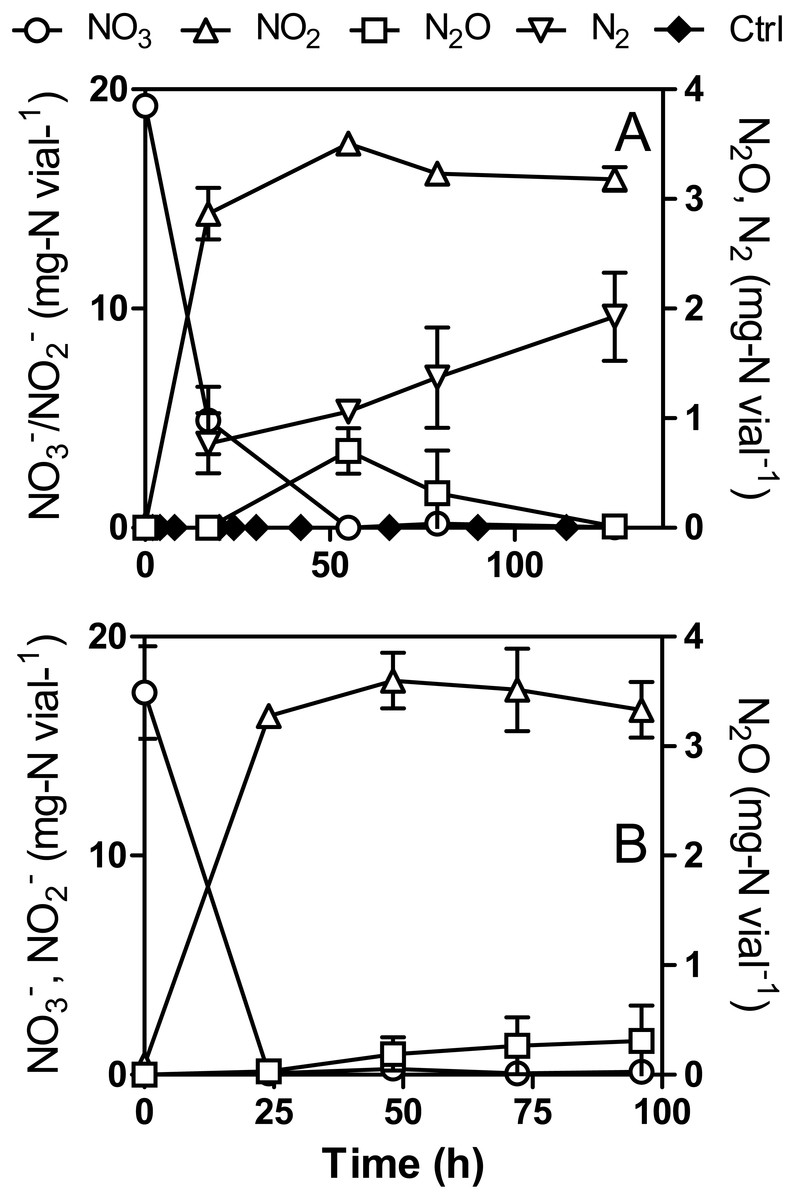
Figure 3: N2O production by Methylophaga nitratireducenticrescens JAM1.
Strain JAM1 was cultured under anoxic (A) or oxic (B) conditions with (22 mg-N vial−1). , and N2O concentrations were measured over different time intervals. N2 concentration was measured in anoxic cultures that were flushed with argon. Ctrl: Abiotic control with 18.2 mg-N vial−1 . Data represent mean values ± SD (n = 3).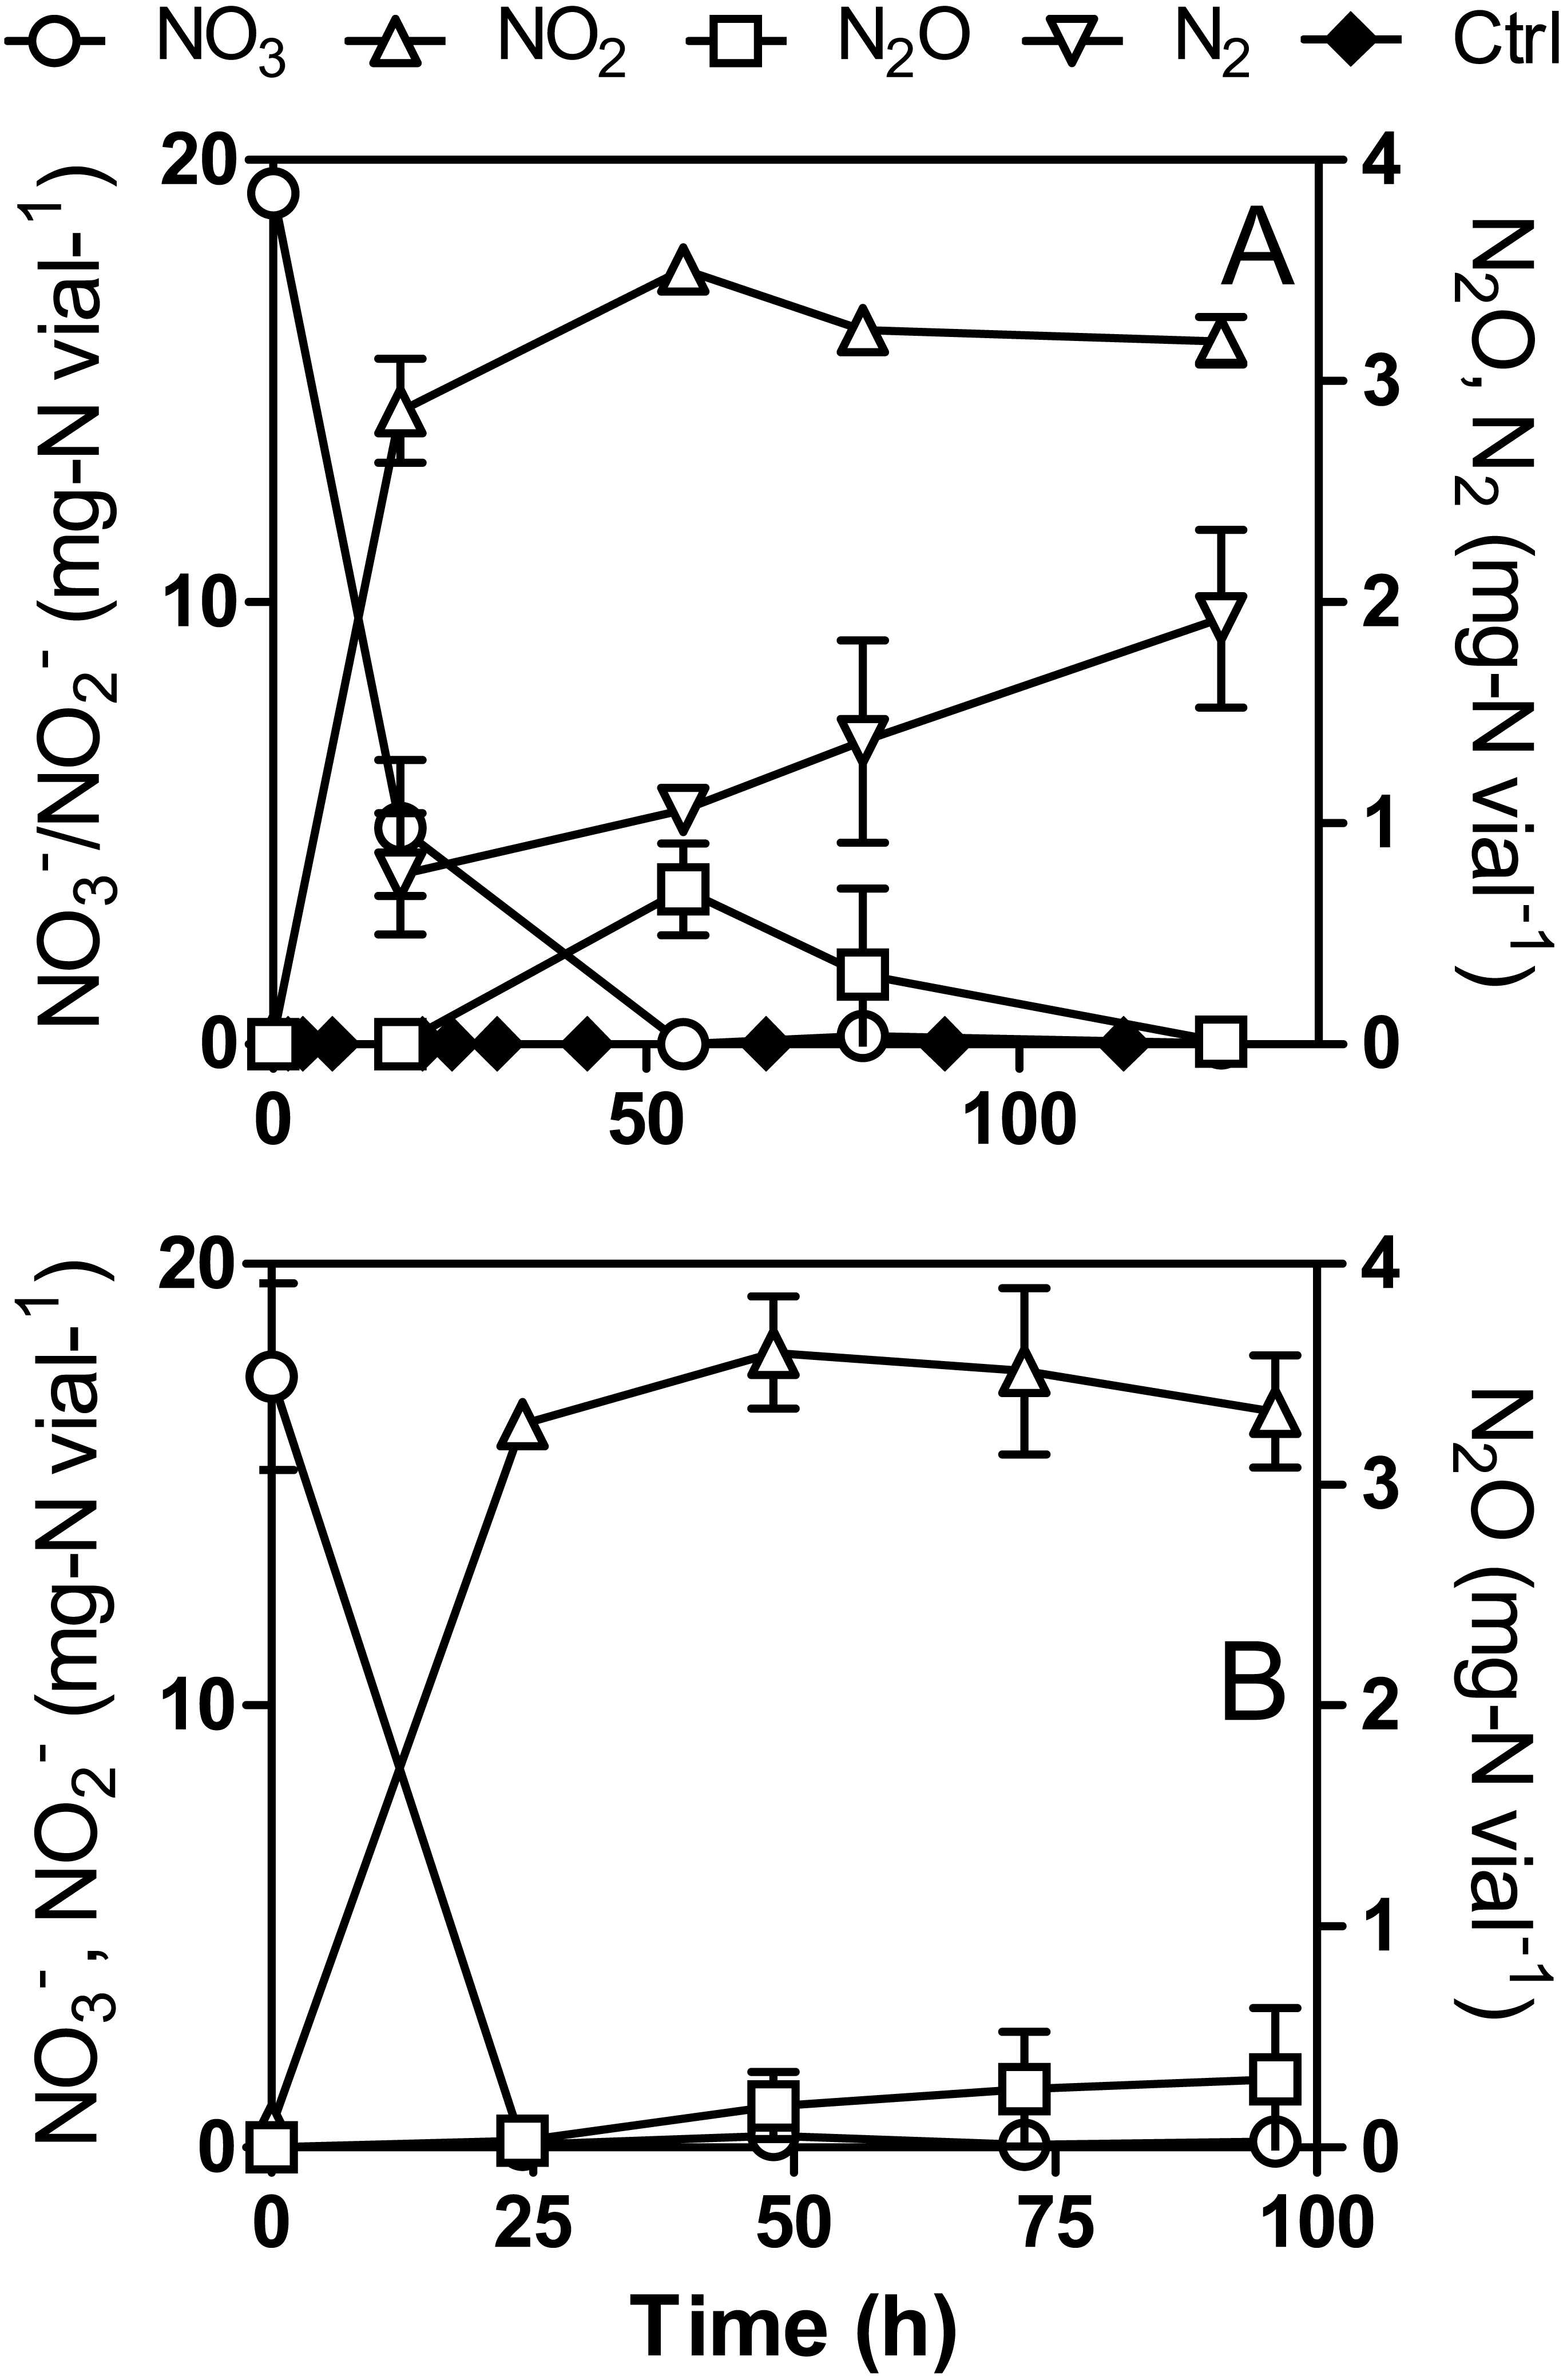
Under oxic conditions, reduction (17.4 ± 2.1 mg-N vial−1) was complete after 24 h with equivalent accumulation (17.1 ± 1.3 mg-N vial−1). N2O production started after complete reduction (Fig. 3B) and increased to reach 0.31 ± 0.32 mg-N vial−1 after 96 h of incubation (1.7% of N input). Unlike trends observed for the anoxic cultures, N2O concentration did not decrease in the oxic cultures. N2O production and consumption could have reached an equilibrium and loss of nitrogen would occur by N2 production.
, and N2O dynamics in NH4Cl-free cultures
The original 1403 medium recommended by the ATCC for culturing Methylophaga spp. contains 20.9 mg-N vial−1 NH4Cl and 0.1 mg-N vial−1 ferric ammonium citrate (see ‘Material and Methods’). Based on the deduced nitrogen metabolic pathways from strain JAM1 genome (Fig. S1), N-assimilation into the biomass should proceed directly from and minimal reduction to would be occurring. For the next set of experiments, we aimed to determine the effect of removing NH4Cl, which provides most of the (99.5%), on the dynamics of , and N2O. We hypothesized that forcing strain JAM1 to reroute some for N assimilation would affect denitrification and thus growth rates. Strain JAM1 was cultured with ca. 20 mg-N vial−1 under anoxic or oxic conditions in NH4Cl-free medium (Fig. 4). Growth pattern observed under anoxic conditions was similar between the regular and NH4Cl-free cultures, as also the growth pattern under oxic conditions between the regular and NH4Cl-free cultures.
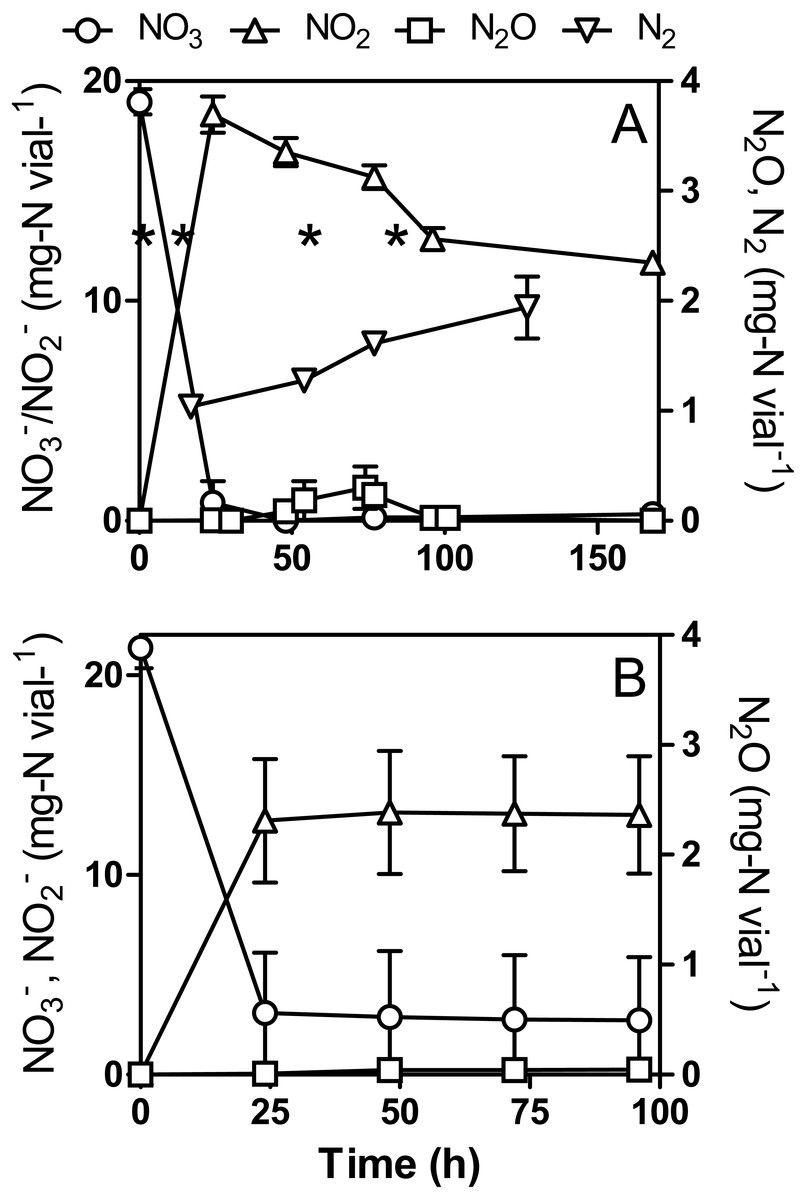
Figure 4: , and N2O dynamics by Methylophaga nitratireducenticrescens JAM1 in NH4Cl-free cultures.
Strain JAM1 was cultured under anoxic (A) or oxic (B) conditions with (22 mg-N vial−1) in NH4Cl-free 1403 medium. , and N2O concentrations were measured over different time intervals. N2 concentration was measured in anoxic cultures that were flushed with argon. The results are derived from triplicate cultures. In (A) asterisks denote the sampling times used for RNA extraction (see Fig. 6). Data represent mean values ± SD (n = 3).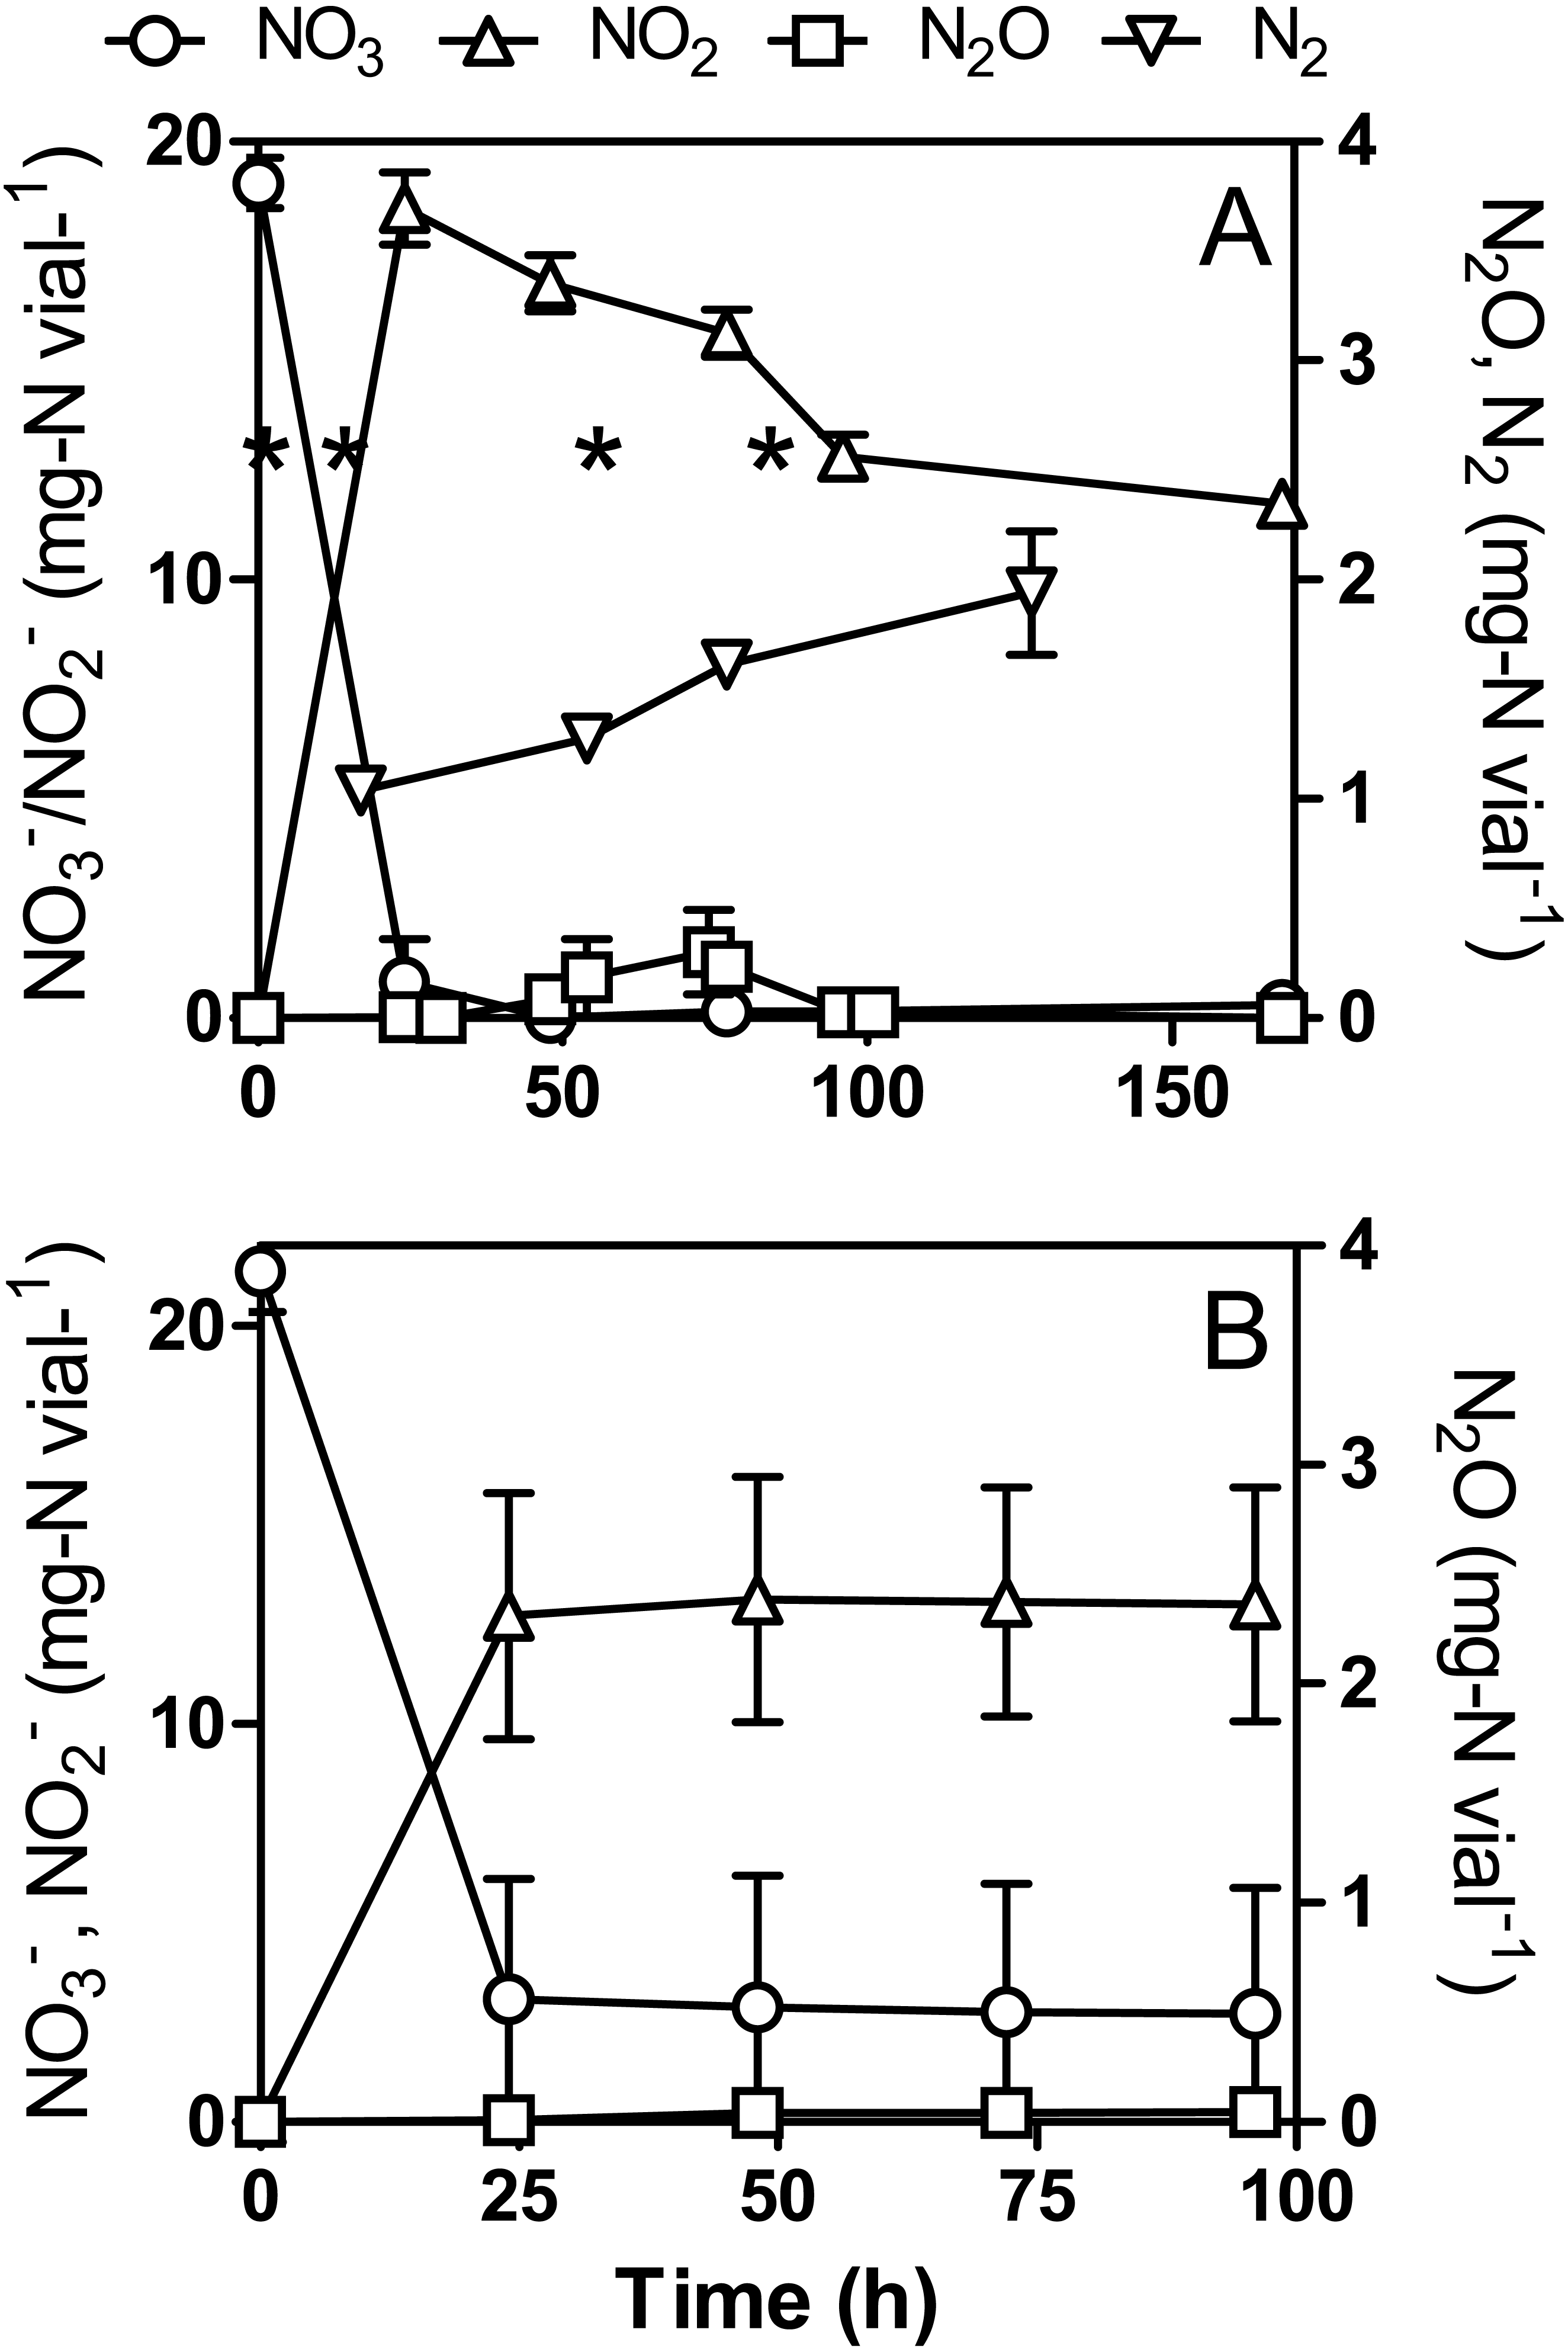
Under anoxic NH4Cl-free conditions, full reduction (19.1 ± 0.6 mg-N vial−1) occurred within 48 h (Fig. 4A). The N2O profile found was similar to that observed in regular cultures (Fig. 3A), though lower N2O concentrations were detected during the accumulating phase. The level reached 18.5 ± 0.8 mg-N vial−1 after 24 h and then slowly decreased to 12.8 ± 0.5 mg-N vial−1 after 96 h. Cultures flushed with argon showed an increase of N2 in the headspace (Fig. 4A) by 0.90 ± 0.28 mg-N vial−1 after 127 h, which is similar to N2 production in the regular culture medium. Nitrogen assimilation by the biomass could account for the difference in nitrogen mass balance (28.3%).
Unlike the cultures in regular medium (Fig. 3B), NO (21.3 ± 1.0 mg-N vial−1) was not completely reduced under oxic NH4Cl-free conditions, and it stopped after 24 h at 2.9 ± 2.7 mg-N vial−1 (Fig. 4B). In conjunction with reduction, levels stopped accumulating at 13.0 ± 2.6 mg-N vial−1 after 24 h. N2O was observed after 48 h of incubation (Fig. 4B), after which it slowly accumulated and reached a concentration of 0.043 ± 0.048 mg-N vial−1. This level is seven times lower than that of the regular culture medium (Fig. 3B).
To assess whether N2O could have been generated through , strain JAM1 was cultured under anoxic conditions with 22 mg-N vial−1 , 20.7 mg-N vial−1 15, and acetylene to prevent the reduction of N2O to N2. If is involved in N2O production, high proportion of labelled N2O is expected. If is not involved in N2O production, we expected the production of labeled N2O to be derived from 15 naturally present in Na at a natural 15N/14N isotopic ratio of 0.0036765. In the 15-amended cultures, the 45[N2O]/44[N2O] and 46[N2O]/44[N2O] ratios measured were 0.008 and 0.0165, respectively, with an 15N/14N isotopic ratio of 0.020418. As a control, strain JAM1 cultured under anoxic conditions with 15 in NH4Cl-free medium with acetylene showed, as was expected, all N2O recovered in 46[N2O]. Because low 15N/14N isotopic ratio were found in the 15-amended cultures, our results suggest that N2O do not proceed through .
NO reduction by M. nitratireducenticrescens JAM1
To verify NO reduction by strain JAM1, N2O generation was monitored in cultures without and supplemented with sodium nitroprusside hypochloride (SNP) used as an NO donor (Moore et al., 2004). Because N2O is quickly reduced under anoxic conditions but accumulates under oxic conditions, these assays were performed under oxic conditions (Fig. 5). N2O started to accumulate in both 2 mM and 5 mM SNP-supplemented media after 24 h of incubation, reaching 7.9 ± 0.5 µg-N vial−1 and 14.5 ± 0.4 µg-N vial−1, respectively, after 168 h. No N2O production was observed in strain JAM1 cultures without SNP or in the controls with non-inoculated culture medium supplemented with SNP or inoculated with autoclaved biomass.
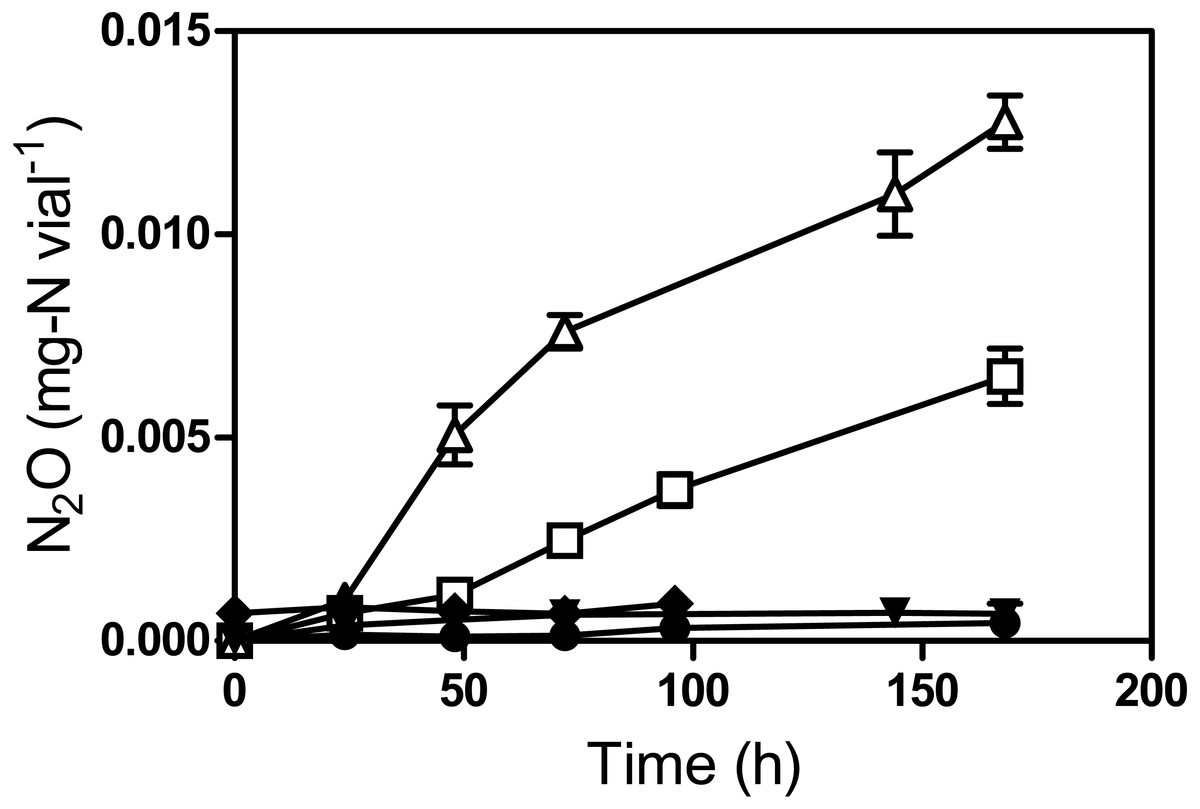
Figure 5: Reduction of NO to N2O by Methylophaga nitratireducenticrescens JAM1.
Strain JAM1 was cultured under oxic conditions without and with 2 mM (square), with 5 mM (triangle), or with no (circle) sodium nitroprusside (SNP). N2O concentrations were measured over different time intervals. Controls with 5 mM SNP in non-inoculated culture medium (reverse triangle) and in culture medium inoculated with autoclaved biomass (diamond) were also performed. Data represent mean values ± SD (n = 3).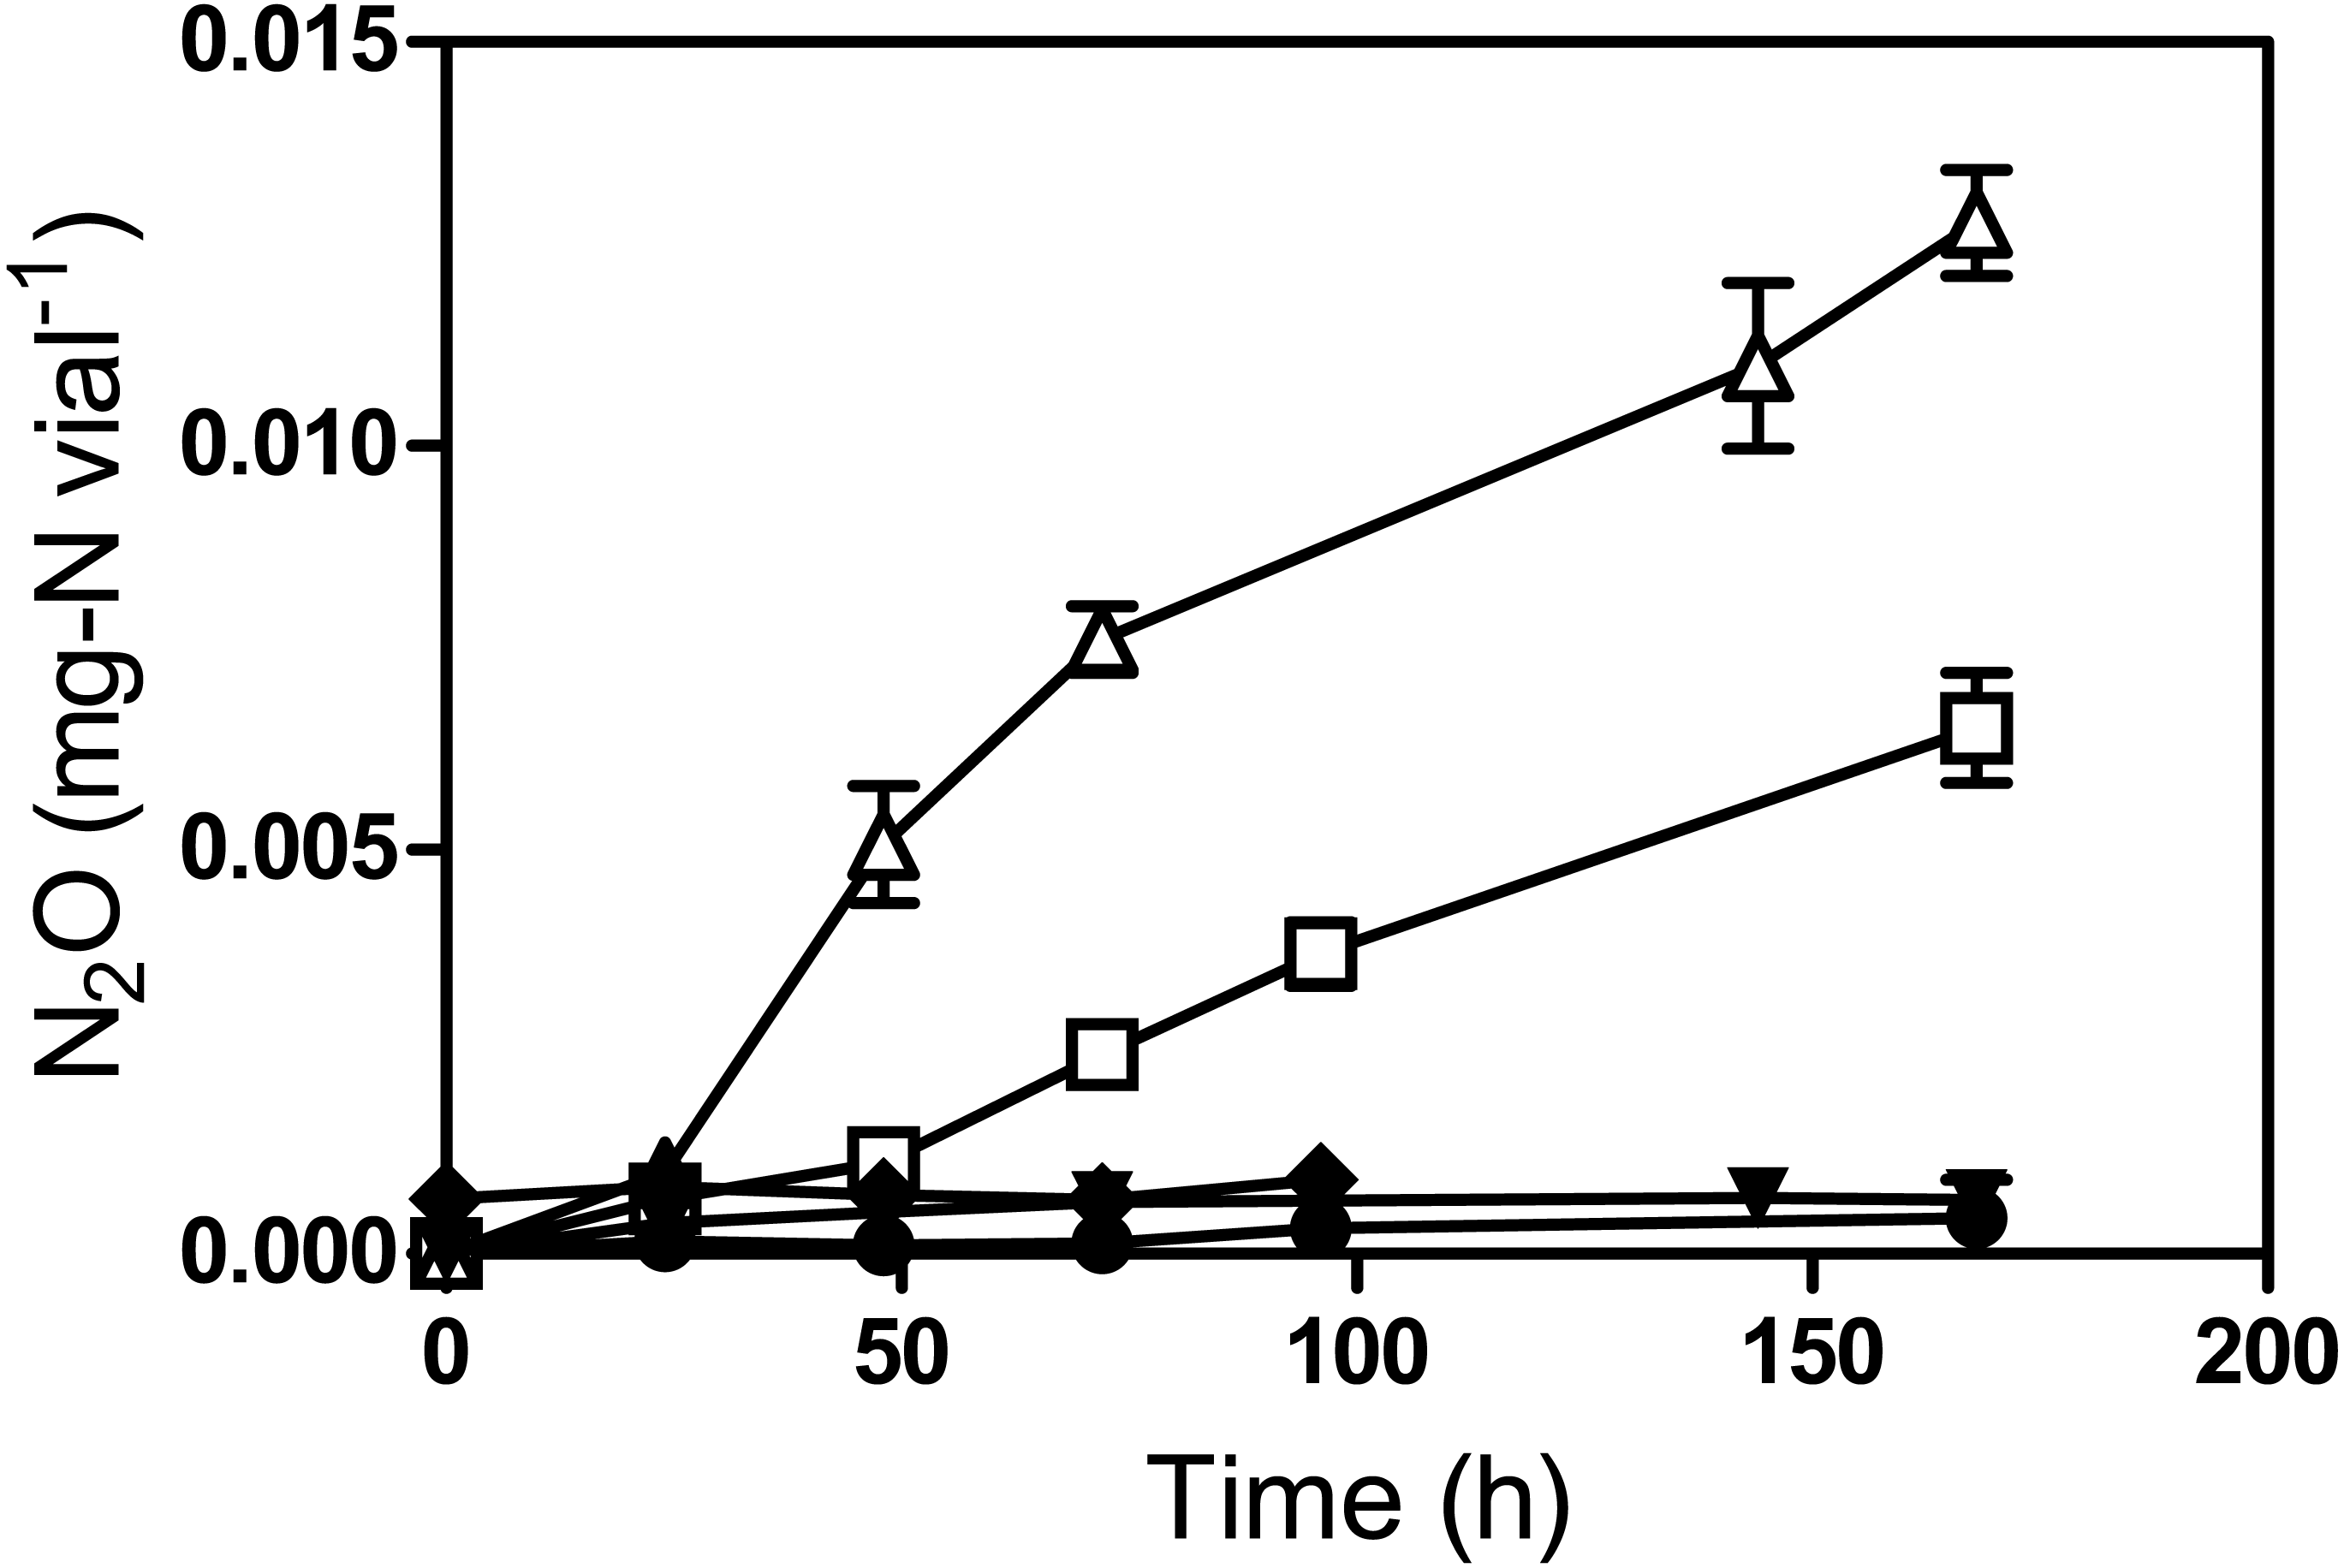

Figure 6: Relative transcript levels of cnorB1, cnorB2, nnrS, nosZ, norR and the assimilatory nitrate reductase (nr).
Strain JAM1 was cultured under anoxic conditions in NH4Cl-free 1403 medium with 22 mg-N vial. Growth patterns were similar to those shown in Fig. 1B under the same conditions with regular 1403 medium. Samples were drawn from the pre-cultures (2–3 day old oxic cultures with no ) and during the growth phase ( reduction), N2O accumulation phase, and N2O consumption phase (see Fig. 4A), from which total RNA was extracted for RT-qPCR assays. Changes in the levels of cnorB1, cnorB2, nnrS, nosZ, norR and nr transcripts were calculated relative to their expression during the pre-culture phase (set to one, black column). One-way ANOVA tests with Tukey post hoc tests were performed within each phase. Columns represented by different letters are significantly different (P < 0.05). Data represent mean values ± SD.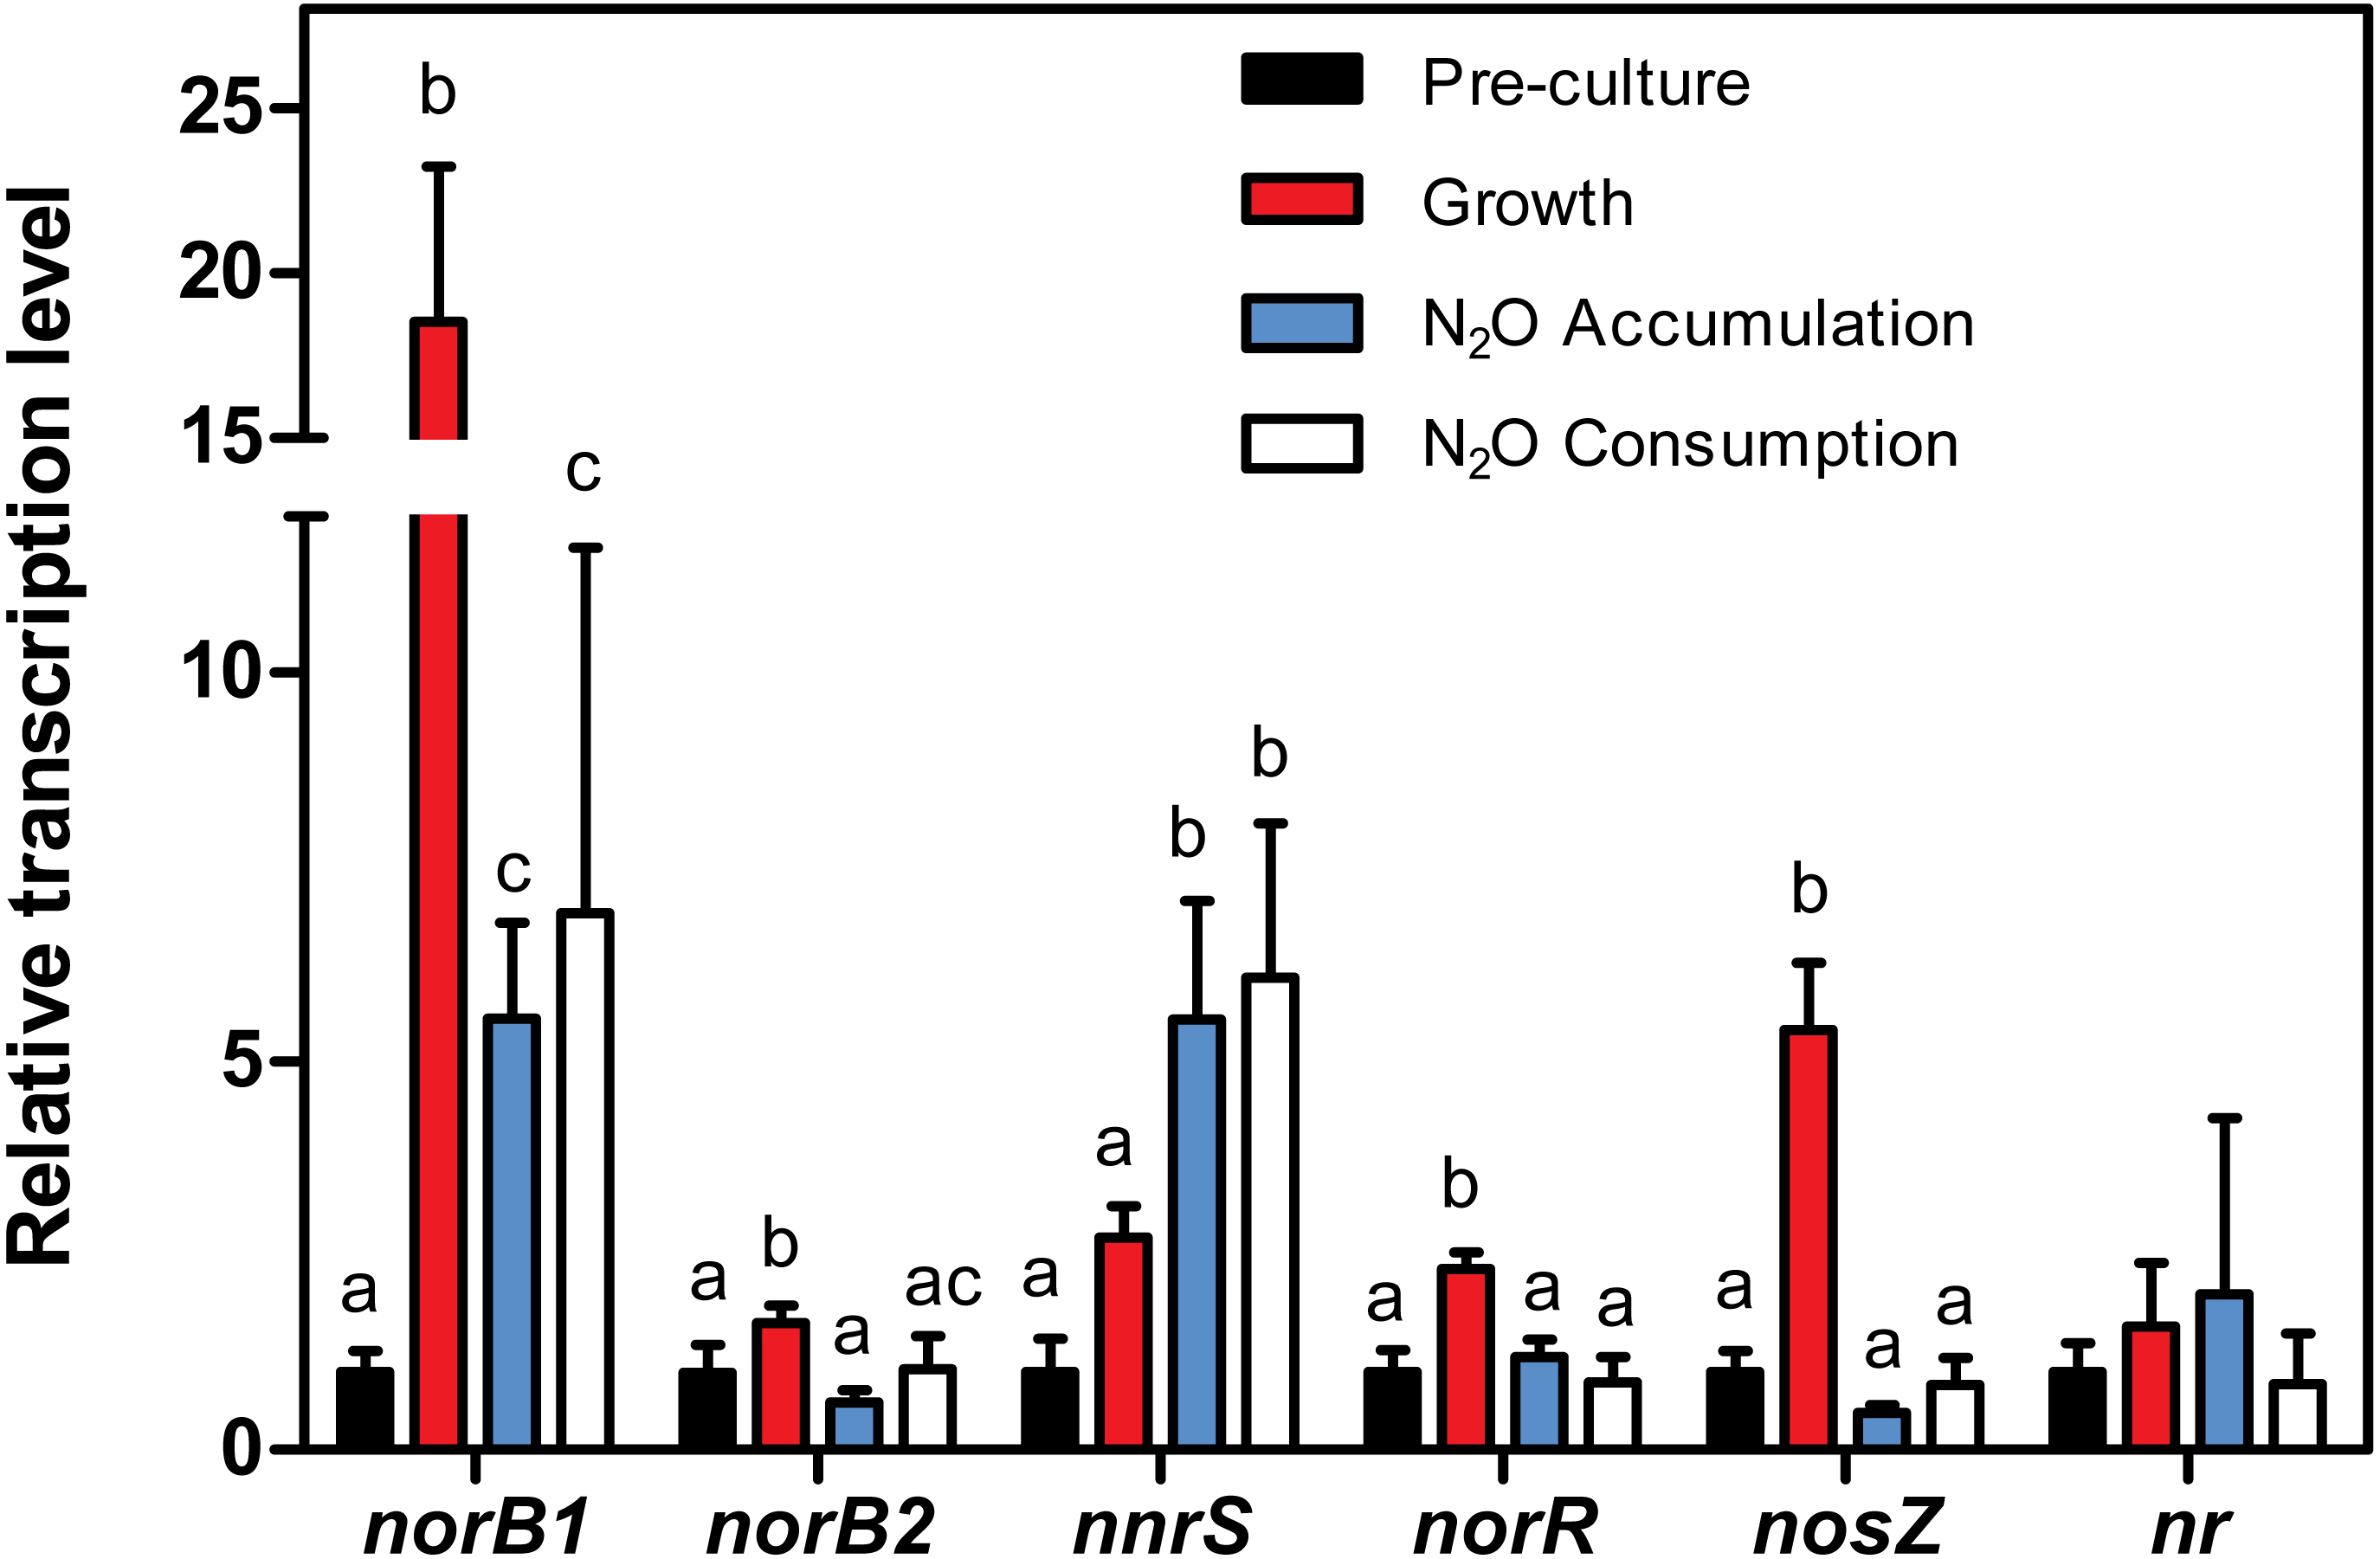
Role of Nar systems in NO/N2O production
In the absence of NirK or NirS, N2O could have been generated via NO by the Nar system (see ‘Discussion’). We used the JAM1ΔnarG1narG2 double mutant, which lacks functional Nar-type nitrate reductases and which cannot grow under anoxic conditions (Mauffrey, Martineau & Villemur, 2015). Strain JAM1 and the JAM1ΔnarG1narG2 were cultured with 16.8 mg-N vial−1 under oxic conditions. The growth of strain JAM1 and the mutant was similar (Mauffrey, Martineau & Villemur, 2015). After 96 h of incubation, strain JAM1 completely reduced to and produced 0.14 mg-N vial−1 of N2O (Table 2). As was expected, was not reduced, and was not produced by JAM1ΔnarG1narG2. Contrary to the wild type strain, the mutant did not produce N2O.
| Strain | Conditions | (mg-N vial−1) | (mg-N vial−1) | N2O (mg-N vial-1) |
|---|---|---|---|---|
| JAM1 | A | 0.17 ± 0.06 | 16.6 ± 0.7 | 0.14 ± 0.01 |
| JAM1ΔnarG1narG2 | A | 17.1 ± 0.1 | 0.22 ± 0.22 | 0.004 ± 0.002 |
| JAM1 | B | 0 | 4.25 ± 0.09 | 0.11 ± 0.03 |
| JAM1ΔnarG1narG2 | B | 0 | 4.87 ± 0.39 | 0.18 ± 0.02 |
The influence of was also tested. As the toxicity of has been attested from 0.36 mM (0.2 mg-N vial−1) (Auclair et al., 2010), strain JAM1 and the mutant were cultured without under oxic conditions to allow for biomass growth. After 24 h, 4.7 mg-N vial−1 NO was added to the cultures and was incubated for another 72 h. Strain JAM1 and the mutant produced 0.11 mg-N vial−1 and 0.18 mg-N vial−1 of N2O, respectively, reflecting N2O concentrations produced by strain JAM1 under oxic conditions with (Table 2). Our results show that and not is directly involved in N2O production, and the Nar systems are not involved in N2O production via NO.
Relative expression levels of denitrification genes in M. nitratireducenticrescens JAM1
We assessed whether variations in the expression levels of denitrification genes correlate with the N2O accumulation and consumption cycles of strain JAM1 cultures. Strain JAM1 was cultured in NH4Cl-free medium with 22 mg-N vial−1 under anoxic conditions. RNA was extracted from cells harvested over four different phases (Fig. 4): (1) at T0 for the pre-cultures (oxic cultures with no ), (2) during the growth phase with reduction and no N2O accumulation, (3) during the N2O accumulation phase, and (4) during the N2O consumption phase. The transcript levels of cnorB1, cnorB2 and nosZ, which encode the catalytic subunits of the corresponding NO and N2O reductases, and nnrS and norR, were measured by RT-qPCR. nnrS and norR encode NO-sensitive regulators and were used as an indicator of the presence of NO in the cultures. Because the assimilatory nitrate reductase is involved in the re-routing of to the biomass, RT-qPCR assays were also performed on the gene encoding this reductase (named here nr). The expression levels were calculated relative to the transcript levels measured during the preculture phase (set to one) (Fig. 6).
The relative cnorB1 transcript levels showed an 18.5-fold increase during the growth phase. cnorB1 expression was still upregulated during the N2O accumulation and consumption phases (5.5 and 6.9-fold increases, respectively). The relative cnorB2 transcript levels had a 1.6-fold increase during the growth phase. These levels returned nearly to the same levels of those in the preculture phase. Significant increases (5.5- and 6.0-fold) of the relative expression levels of nnrS were observed in the N2O accumulation and consumption phases. norR was upregulated (2.3-fold increase) during the growth phase. The nosZ expression levels had a 5.4-fold increase during the growth phase relative to the preculture phase, and decreased to the preculture levels during the N2O accumulation phase. No significant difference was observed in the relative transcript levels of the nr gene between all phases.
Discussion
Our results show that M. nitratireducenticrescens JAM1 can consume NO and N2O via the mechanism of reduction of NO to N2O and then to N2 as predicted by the genome sequence (Fig. S1) (Villeneuve et al., 2013; Mauffrey, Martineau & Villemur, 2015). The N2O-amended cultures yielded equivalent biomass results to those of the NO-amended cultures as predicted by the respiratory electron transport chains of the denitrification pathway (Simon, 2011). Therefore, in addition of reducing , strain JAM1 has another respiratory capacity under anoxic conditions by reducing N2O for its growth.
Although denitrification is generally an anaerobic process, there are cases where it occurs under oxic conditions (Otani, Hasegawa & Hanaki, 2004). As observed with reduction, NO and N2O reduction can occur under oxic conditions, reinforcing the lack of a functional oxygen regulation response in strain JAM1 (Mauffrey, Martineau & Villemur, 2015). However, there is little benefit to this consumption, as N2O or amended cultures have a similar growth pattern than the cultures with only oxygen as terminal electron acceptor. The methylamine-utilizing bacterium Methylotenera mobilis strain JLW8 also showed denitrifying activities under oxic conditions (Kalyuhznaya et al., 2009). This freshwater bacterium has an incomplete denitrification pathway with gene clusters encoding a periplasmic NapA-type nitrate reductase, NirK and cNor. Although no growth were recorded in methylamine-amended culture supplemented with under oxic conditions, growth occurred in methanol-amended cultures with reduction of to N2O. Contrary to M. nitratireducenticrescens JAM1, Methylotenera mobilis JLW8 cannot grow under anoxic conditions with (Kalyuzhnaya et al., 2006; Mustakhimov et al., 2013). Denitrification enzymes were showed to be active under anoxic conditions but oxygen is required for strain JLW8 growth (Kalyuhznaya et al., 2009).
N2O production was observed in NO-amended cultures either under oxic or anoxic conditions when was accumulating. This production represented up to 6% of N-input in the anoxic cultures, and was shown to be the key element of this production process. Because we showed that the NO reductase activities were carried out in strain JAM1 cultures, the N2O could originate from NO production despite the absence of gene encoding NirS or NirK. Intermediate NO creates problems as this molecule is highly toxic to microorganisms, inducing nitrosative stress in cells (Poole, 2005). Reducing NO is a key step in denitrification and is closely regulated by various sensors and regulators. NnrS and NorR are involved in cell defense against nitrosative stress and are positively regulated by the presence of NO (Stern et al., 2013; Stern et al., 2012; Bartnikas et al., 2002). Therefore, the expression of nnrS and norR reflects NO concentrations in a medium and was used as a marker of NO presence. The upregulation of the expression of norR during the growth phase strongly suggest that NO is produced during this phase. This correlates with higher expressions of both cnorB, and nosZ during the growth phase, which can be regulated by NO-sensitive regulators such as NorR (Spiro, 2012). nnrS is upregulated during the N2O accumulation and consumption phases, which suggests that NO is still generated during these phases. This upregulation can be linked to the decrease of the relative transcript levels of both cnorB, and of nosZ and norR, but also to the highest level of concentrations in the culture medium. It is therefore possible that NO is not reduced quickly enough in the cells by cNorB and strain JAM1 must rely on another mechanism, such as NnrS, to protect itself from NO toxicity. Stern et al. (2013) suggest that NnrS does not remove NO directly, but protects cells against the formation of iron-NO complexes, which are inhibitory to iron-sulfur cluster proteins. Moreover, Vaccaro et al. (2016) proposed that NnrS senses NO and signals to cytoplasmic transcription factors or Fe-S cluster repair proteins.
Other respiring bacteria that lack NirK or NirS have been shown to be N2O producers (Bleakley & Tiedje, 1982; Smith & Zimmerman, 1981; Sun, Vos & Heylen, 2016). For instance, Bacillus vireti contains three denitrification reductases (Nar, qCuANor, N2OR) and lacks, like M. nitratireducenticrescens JAM1, gene encoding NirK or NirS (Mania et al., 2014). This bacterium also produces NO and N2O in anaerobic, -amended TSB cultures during accumulation. NO was shown to originate from chemical decomposition of (Schreiber et al., 2012) and from an unknown biotic reaction. In our study, the abiotic control of the Methylophaga 1403 medium amended with did not show significant N2O production. Also, the abiotic reaction between the ferrous ion in the medium and generated negligible amount of N2O. Furthermore, no N2O was detected in this medium inoculated with autoclaved biomass (Fig. 5). These results rule out abiotic reactions as the source of the total amount of N2O produced in strain JAM1 cultures. The possible biotic source of NO in absence of NirS or NirK has been studied in Escherichia coli (see review by Vine & Cole, 2011). There are supporting evidence that NO is generated in E. coli as a side product during reduction (i) by the cytoplasmic, NADH-dependent nitrite reductase (NirBD), (ii) by the nitrite reductase NrfAB, and (iii) by NarGHI. Vine, Purewal & Cole (2011) showed, with mutants defective in these reductases, that NarGHI is the major enzyme responsible of NO production. However, a small production of NO was still occurring in narG mutant, suggesting the involvement of another molybdoprotein. In M. nitratireducenticrescens JAM1, the double-knockout mutant JAM1ΔnarG1narG2, which lacks the two dissimilatory reductases, was still able to produce N2O under oxic conditions at the same level of the wild type when was added to the cultures. These results suggest the two Nar systems are not involved in NO production. The genome of strain JAM1 did not reveal gene encoding NrfAB, but contain a gene cluster encoding a cytoplasmic, NADH-dependent nitrite reductase (CP003390.3; Q7A_2620 and Q7A_2621), which may be the source of NO (Fig. S1). In the latter case, this could be verified by generating a knockout mutant of this gene.
The significance of maintaining an incomplete pathway by M. nitratireducenticrescens JAM1 is unclear and may depend upon the original habitat and environment, here the denitrifying biofilm. While M. nitratireducenticrescens JAM1 serves as an important actor among the microbial community of the marine biofilm in performing optimal denitrifying activities (Labbé et al., 2003; Labbé, Parent & Villemur, 2003), it was thought to participate uniquely in the reduction of to . It was previously proposed that reduction to N2 is carried out by Hyphomicrobium nitrativorans NL23, the second most represented bacterium in the biofilm (Labbé et al., 2007; Auclair, Parent & Villemur, 2012). Its capacity to reduce NO and N2O and to grow on N2O suggests that M. nitratireducenticrescens JAM1 may participate in the reduction of NO and N2O during denitrification in the biofilm. Although our culture assays were performed with high levels of (37 mM), which rarely exceeds a value of 0.7 mM in natural environments (Yeats, 1990), similar levels can be reached in closed-circuit systems like the seawater aquarium tank located in the Montreal Biodome, where levels reached up to 14 mM (Parent & Morin, 2000). Rissanen et al. (2016) also observed the combination of Methylophaga spp. and Hyphomicrobium spp. in the fluidized-bed type denitrification reactors treating the recirculating seawater of the public fish aquarium SEA LIFE at Helsinki, Finland. Although this study provided no indication of the denitrification pathway in these Methylophaga and Hyphomicrobium, it reinforces the importance of the natural combination of these two genera in marine denitrification environment.
Conclusions
M. nitratireducenticrescens JAM1 is one of few isolated marine methylotrophic bacterial strains to exhibit anaerobic respiratory capacities by reducing to and, as reported here, by reducing N2O to N2. It can also generate N2O via NO by an unknown biotic system. Very few marine denitrifying bacteria have been isolated from recirculating marine systems (Borges et al., 2008; Foesel, Drake & Schramm, 2011; Zheng et al., 2012; Zheng et al., 2011). No previous studies have generated genetic information related gene arrangement or expression on these bacteria. Based on substantial data accumulated on the genome, gene arrangement and gene expression of denitrification and on methylotrophy, M. nitratireducenticrescens JAM1 can serve as a model for studying such activities in marine environments. Finally, our results enable a better understanding of the ecophysiological role of M. nitratireducenticrescens JAM1 in the original biofilm developed in the denitrification reactor of a closed-circuit marine aquarium.
Supplemental Information
Schematic of the denitrification pathway and the ammonium pathways in Methylophaga nitratireducenticrescens JAM1
Functions are based on the annotations of strain JAM1 genome (CP003390.3). Numbers are locus tag of the corresponding gene preceding by Q7A_. TCA, tricarboxylic acid cycle; GS, glutamine synthase; GlnA, Glutamine synthetase; GOGAT, Glutamate dehydrogenase; trp, transporter; deh, dehydrogenase; MDH, methanol dehydrogenase; Fdh, formate dehydrogenase; Cyt, cytochrome; Q, quinolone; Fae, formaldehyde-activating enzyme, HPS, 3-hexulose-6-phosphate synthase; red and red, assimilatory nitrate reductase (NR) and NADH-dependent nitrite reductase; NarK1, nitrate/H+ symporter; NarK2, Nitrate/nitrite antiporter; NarK12f, fused NarK1-NarK2 transporter; NarXL, two-component nitrate/nitrite sensor system; NO diox, dioxygenase. Dash lines represent the putative origin of NO from the NADH-dependent nitrite reductase or from an unknown (?) molybdoprotein (Vine & Cole, 2011), and the putative role of NnrS (Vaccaro et al., 2016).