

Adaptive and degenerative evolution of the S-Phase Kinase-Associated Protein 1-Like family in Arabidopsis thaliana
- Published
- Accepted
- Received
- Academic Editor
- Vladimir Uversky
- Subject Areas
- Biochemistry, Bioinformatics, Evolutionary Studies, Genomics, Plant Science
- Keywords
- Arabidopsis Skp1-Like, Evolution, Adaptive, Degenerative, F-box, Protein–protein interaction, Selection, Polymorphism, Phylogenetics
- Copyright
- © 2019 Hua and Gao
- Licence
- This is an open access article distributed under the terms of the Creative Commons Attribution License, which permits unrestricted use, distribution, reproduction and adaptation in any medium and for any purpose provided that it is properly attributed. For attribution, the original author(s), title, publication source (PeerJ) and either DOI or URL of the article must be cited.
- Cite this article
- 2019. Adaptive and degenerative evolution of the S-Phase Kinase-Associated Protein 1-Like family in Arabidopsis thaliana. PeerJ 7:e6740 https://doi.org/10.7717/peerj.6740
Abstract
Genome sequencing has uncovered tremendous sequence variation within and between species. In plants, in addition to large variations in genome size, a great deal of sequence polymorphism is also evident in several large multi-gene families, including those involved in the ubiquitin-26S proteasome protein degradation system. However, the biological function of this sequence variation is yet not clear. In this work, we explicitly demonstrated a single origin of retroposed Arabidopsis Skp1-Like (ASK) genes using an improved phylogenetic analysis. Taking advantage of the 1,001 genomes project, we here provide several lines of polymorphism evidence showing both adaptive and degenerative evolutionary processes in ASK genes. Yeast two-hybrid quantitative interaction assays further suggested that recent neutral changes in the ASK2 coding sequence weakened its interactions with some F-box proteins. The trend that highly polymorphic upstream regions of ASK1 yield high levels of expression implied negative expression regulation of ASK1 by an as-yet-unknown transcriptional suppression mechanism, which may contribute to the polymorphic roles of Skp1-CUL1-F-box complexes. Taken together, this study provides new evolutionary evidence to guide future functional genomic studies of SCF-mediated protein ubiquitylation.
Introduction
Proteins play fundamental roles in driving life processes by sensing diverse environmental cues, catalyzing biochemical reactions, monitoring the stability of genetic materials, and combating abiotic and biotic stresses. In addition, they are believed to be the only molecules capable of mechanical movement in any organism. To accomplish these diverse roles, not only is protein synthesis precisely controlled, but the structure, activity, and turnover of each protein is also sophisticatedly regulated in a temporal and spatial manner. The ubiquitin-26S proteasome system (UPS) is the primary degradative machinery for rapidly modulating protein content in eukaryotic cells. Given the power of its selective turnover of numerous intracellular proteins, the UPS plays an essential regulatory role in controlling cell cycle progression, signal transduction, gene expression regulation, genome stability, and many other cellular processes (Finley et al., 2012; Vierstra, 2009; Yau & Rape, 2016). This function has been demonstrated to be particularly important in plants, as evidenced by the extremely large expansion of several gene superfamilies that encode plant UPS members (Vierstra, 2009).
Among these members, S-Phase Kinase-Associated Protein 1 (Skp1), F-box proteins, Cullin 1, and RING box protein 1 compose the largest group of ubiquitin-ligase complexes in plants, termed SCF complexes, which target protein substrates for ubiquitylation and subsequent turnover by the 26S proteasome (GO:0019005) (Hua & Vierstra, 2011). Genetic, genomic, evolutionary, and biochemical analyses have shown that the F-box multi-gene superfamily encodes a substrate receptor that determines the specificity of the SCF complex, while the Skp1 protein family functions as an adaptor to bridge the variable F-box proteins to the N-terminus of Cullin 1 to assemble a holo-ubiquitin ligating enzyme (Gagne et al., 2002; Hua & Vierstra, 2011; Yang et al., 1999; Zheng et al., 2002). Although a handful of F-box proteins have been functionally shown to target the degradation of proteins involved in the cell cycle, circadian rhythms, photomorphogenesis, pathogen defense, hormone signaling, and plant reproduction, many recently duplicated and species- or lineage-specific members remain uncharacterized (Hua et al., 2011). Given that the size of the F-box superfamily is species-specific and is often not correlated with the complexity of plant species, a genomic drift evolutionary mechanism has been postulated to explain the random size drift of the F-box gene superfamily in plants (Hua et al., 2011; Nozawa, Kawahara & Nei, 2007; Xu et al., 2009). The high sequence polymorphism of lineage specific F-box genes and their enrichment of transcriptional suppression-related epigenetic modifications further support this hypothesis (Hua et al., 2013). However, this does not preclude the existence of some young F-box genes that play a lineage specific role in plant adaptation (Gagne et al., 2002; Shabek & Zheng, 2014; Yang et al., 2008). Unfortunately, it remains difficult to find these members both experimentally and theoretically, in part due to the large size of this group and the low/no expression of most lineage specific F-box genes (Hua et al., 2013).
Similar to the F-box gene superfamily, the Skp1 family has also expanded significantly in land plants. While there is only one single Skp1 protein encoded in yeast and human genomes, the genomes of Arabidopsis thaliana and Oryza sativa contain 21 and 32 annotated Skp1 loci, respectively (Kong et al., 2007). Cross-kingdom evolutionary studies have suggested that the plant Skp1 genes are also rapidly evolving through a birth-and-death evolutionary mechanism (Kong et al., 2004, 2007). However, unlike many inactive F-box genes (Hua et al., 2011; Kuroda et al., 2012), 20 out of 21 A. thaliana Skp1-Like (ASK) genes are transcribed in at least one out of six tissues/organs examined, including seedlings, roots, stems, leaves, inflorescences, and siliques (Kong et al., 2004; Zhao et al., 2003), suggesting that most ASK genes are active. Phylogenetic analysis further implied that all plant Skp1 genes shared one common ancestor, although evolutionary rates of individuals are highly heterogeneous. Therefore, it has been inferred that some moderately and rapidly evolving members might have lost their original functions and/or gained new functions (Kong et al., 2004). Despite the sequence diversity of ASK proteins, a recent biochemical study showed that all ASK proteins retained the biochemical function of their ancestor Skp1 protein for interacting with F-box proteins (Kuroda et al., 2012).
The fact that all ASK proteins interact with an F-box protein implied that their sequences are not sufficiently diverged from their ancestor sequence for their original biochemical function to have been lost. However, this rapid evolution has dramatically diversified the sequences of plant Skp1 genes, making it challenging to uncover the true phylogenetic relationships among distantly related plant species. Indeed, to avoid the effects of long-branch attraction, type II Skp1 genes, which carry multiple introns in various positions, unlike type I Skp1 genes that contain only one or none introns, were excluded in a previous phylogenetic analysis of Skp1 genes (Kong et al., 2007). Improved understanding of the evolutionary mechanisms of the Skp1 gene family may aid further exploration of the functions of many unknown SCF complexes. To date, the genome sequences of three Arabidopsis species, A. thaliana, A. lyrata, and A. halleri, which split 5–10 million years ago (mya) (Hu et al., 2011; Koch & Kiefer, 2005), have been obtained (The Arabidopsis Information Resource (TAIR), V10; Phytozome V12), and >1,000 individual A. thaliana accessions have been sequenced (1001 Genomes Consortium, 2016). These datasets can allow us to further fine-tune the phylogenetic relationships and fixation processes of rapidly-evolving genes in plants, which may help better define their functional constraints. Because the diverse functions of the SCF complexes are primarily determined by the large F-box gene family along with the Skp1 gene family, in this work we analyzed the short evolutionary history of the Skp1 genes within and between Arabidopsis species in order to uncover important evolutionary patterns in SCF regulatory pathways. Our new evidence suggests that the ASK genes are under both adaptive and degenerative evolutionary processes.
Materials and Methods
Identification of Skp1 genes in A. lyrata and A. halleri
The full set of Skp1 seed sequences that encompass a 70–86 amino acid core Skp1 domain were retrieved from Pfam (PF01466, Version 27, http://pfam.xfam.org) and used as query in a BLASTp search (Altschul et al., 1990) against the annotated proteome of each species, which was retrieved from Phytozome (http://phytozome.jgi.doe.gov/; A. lyrata V2 and A. halleri V1.1). The presence of Skp1 and any additional protein–protein interacting domains in each full-length hit sequence were further confirmed by hmmscan (http://hmmer.org) against the Pfam-A database (Pfam 27, http://pfam.xfam.org). To identify a complete list of Skp1 genes in each species, a previously developed sequence similarity-based annotation algorithm, called Closing Target Trimming (Hua & Early, 2018; Hua et al., 2011), was also used to search the genomes for any new Skp1 loci that may not have been annotated.
Sequence alignment and phylogenetic analysis
Instead of manual adjustment and artificial deletion of ambiguous alignment as reported in the previous studies (Kong et al., 2004, 2007; Zhao et al., 2003), two Skp1 protein sequence alignments were obtained by MUSCLE (Edgar, 2004) and MAFFT (Katoh, Rozewicki & Yamada, 2017), and then used to make a consensus alignment by Trimal (-conthreshold 0.5) (Capella-Gutierrez, Silla-Martinez & Gabaldon, 2009). The resulting alignment was used to generate a maximum likelihood (ML) phylogenetic tree by RAxML (Version 8.1; Stamatakis, 2014) with the PROTGAMMAJTT substitution model. The statistical significance was evaluated with 1,000 bootstrap replicates using a rapid bootstrap analysis.
Birth and death of the Skp1 genes in the Arabidopsis genus
Gene duplication and loss events were inferred by reconciling the ML gene tree with the species tree using Notung (version 2.9) (Chen, Durand & Farach-Colton, 2000).
Gene structure analysis and reference sequence retrieval
The number of introns in each Skp1 gene was counted based on the Generic Feature Format (GFF3) file from each genome project. According to the chromosomal coordinates, the upstream and downstream regions of a Skp1 gene, which are 500 nucleotides upstream of the start codon and downstream of the stop codon, respectively, were retrieved from the genomes of A. thaliana (TAIR V10; www.arabidopsis.org) and A. lyrata (V2; Rawat et al., 2015). The coding sequence (CDS) of an ASK gene within the Col-0 reference genome and its A. lyrata ortholog was retrieved from the annotated transcriptomes of A. thaliana (TAIR V10) and A. lyrata (V2; Rawat et al., 2015), respectively.
Sequence assembly for polymorphism analysis
To assemble an ASK allelic sequence, single-nucleotide polymorphic (SNP) alleles (Phred quality score ≥25) within the coding and non-coding flanking sequences were first retrieved from each Arabidopsis accession (http://1001genomes.org). In total, 774 accessions were selected (Cao et al., 2011; 1001 Genomes Consortium, 2016; Long et al., 2013; Schmitz et al., 2013). Based on their co-ordinates, both variant and the Col-0 reference SNP alleles were used to substitute the nucleotides in a reference sequence to assemble two allelic sequences. Only when the new Col-0 allelic sequence was 100% identical to the reference sequence was the variant allele considered to be assembled correctly. To assemble an outgroup sequence, an amino acid sequence alignment of an ASK protein and its A. lyrata ortholog was obtained by MAFFT (Katoh, Rozewicki & Yamada, 2017) and used to guide the assembly of a nucleotide sequence of the outgroup. The sites introducing gaps in the reference ASK sequence were removed.
Determination of tandemly duplicated Skp1 genes
Two Skp1 genes were determined to be tandemly duplicated if they were both separated by ≤5 genes and located within 10 kb.
Clustering analysis
Sequences were clustered using Heatmap.2 (dist method = “manhattan,” hclust method = “word.D”) in R (R Core Team, 2017) to demonstrate similar evolutionary constrains of mutations as described previously (Hua, Doroodian & Vu, 2018).
Expression data resources
The RNA-Seq data for leaf or seedling transcriptomes from 144 to 19 different A. thaliana accessions were retrieved from the projects published by Schmitz et al. (2013) and Gan et al. (2011), respectively. Microarray expression data of 79 samples collected from eight different tissues/organs throughout the A. thaliana Col-0 life cycle were downloaded from http://jsp.weigelworld.org/expviz/expviz.jsp.
Cross species test of neutral evolution
The orthologous pairing of a Skp1 gene between A. thaliana and A. lyrata was determined by OrthoMCL (Li, Stoeckert & Roos, 2003) and used to examine its neutral evolutionary process as previously described (Nekrutenko, Makova & Li, 2002), with minor modifications. The nucleotide sequences of each pair were aligned based on the protein sequence alignment obtained by T-Coffee (Taly et al., 2011) and used as an input file to run the codeml program from the PAML4 package (Yang, 2007) twice, with the Ka/Ks ratio either fixed at 1 or free. The ML values ML1 and ML2 from the two runs were collected to calculate the likelihood ratio as LR = 2(lnML1 – lnML2). If LR is less than 2.71 (5% significance for χ2 distribution with one degree of freedom) (Yang, 2007), the Ka/Ks ratio is considered not significantly different from 1, that is, the Skp1 gene is under a neutral evolutionary process.
Molecular cloning and yeast two-hybrid analysis
The CDSs of 15 selected known F-box genes and ASK1/2 were PCR amplified from cDNA clones that were obtained from the Arabidopsis Biological Resource Center (https://abrc.osu.edu) and ligated in-frame to the 3′-end of GAL4-BD and GAL4-AD CDSs present in the yeast two-hybrid vectors, pGBK-T7 (bait) and pGAD-T7 (prey), respectively. The resulting bait and prey vectors were separately transformed into the haploid yeast strains, AH109 and Y187, respectively, which were subsequently mated according to the pairwise interaction combinations.
For yeast growth interaction assays, the number of mated diploid yeast cells were normalized and diluted with sterile water in series to an OD600 of 0.8, 0.4, 0.2, and 0.1. 5 μL of yeast cells from each concentration were then spotted on either a quadruple synthetic dropout medium (SD-Leu-Trp-Ade-His) containing X-α-gal (40 μg/mL) for interaction assays, or on a double synthetic dropout medium (SD-Leu-Trp) as a growth control. To quantify the interaction strength, the intensity of yeast growth from the scanned images was calculated using ImageQuant version 5.2 (GE Healthcare, Chicago, IL, USA). Each interaction signal on SD-Leu-Trp-Ade-His+X-α-gal medium was normalized to that detected on SD-Leu-Trp medium.
For the β-galactosidase activity assay, six to 10 mated yeast colonies grown on SD-Leu-Trp medium were freshly harvested and resuspended in 0.5 mL of Z buffer (50 mM sodium phosphate, 10 mM potassium chloride, two mM magnesium sulfate, pH 7.0) in a two mL deep-well plate. 0.1 mL of resuspended yeast cells were further aliquoted into a new two mL deep-well plate and used for β-galactosidase activity according to Miller (1972). Relative β-galactosidase activities were calculated based on the method described previously (Hua & Kao, 2006). In total, two independent replicates were assayed.
Results
Identification of Skp1 genes in three closely related Arabidopsis species
The list of 21 A. thaliana ASK genes, which contain 19 Type I (ASK1-19) and 2 Type II (ASK20 and 21) Skp1 genes, has been well annotated in previous studies (Farras et al., 2001; Kong et al., 2004, 2007; Zhao et al., 2003). However, a full list of Skp1 genes has not been reported in A. lyrata or A. halleri. To identify a comprehensive list of Skp1 genes in these two Arabidopsis genomes, BLASTp (Altschul et al., 1990) and hmmscan (http://hmmer.org) were first applied to search the available genome annotations (A. lyrata V2 (Rawat et al., 2015), A. halleri V1.1 (Phytozome V12)). In total, 17 and 11 loci were identified that encode a Type I Skp1 protein, and four and three loci were discovered to encode a Type II Skp1 protein, in A. lyrata and A. halleri, respectively (File S1). After a subsequent sequence-similarity based Closing Target Trimming search (Hua & Early, 2018; Hua et al., 2011), no additional hits were identified in each genome. The relatively long length of the Skp1 domain, the low number or absence of introns in the Skp1 loci, and the small size of the Skp1 family, may facilitate the annotation of Skp1 genes in genomes. Therefore, in total 21, 21, and 14 Skp1 loci are present in A. thaliana, A. lyrata, and A. halleri, respectively. The size variation among these closely related Arabidopsis species indicates that the Skp1 family is, like the F-box gene superfamily, under a rapid birth-and-death evolutionary process.
Phylogenetic analysis of the Skp1 genes in a short evolutionary history
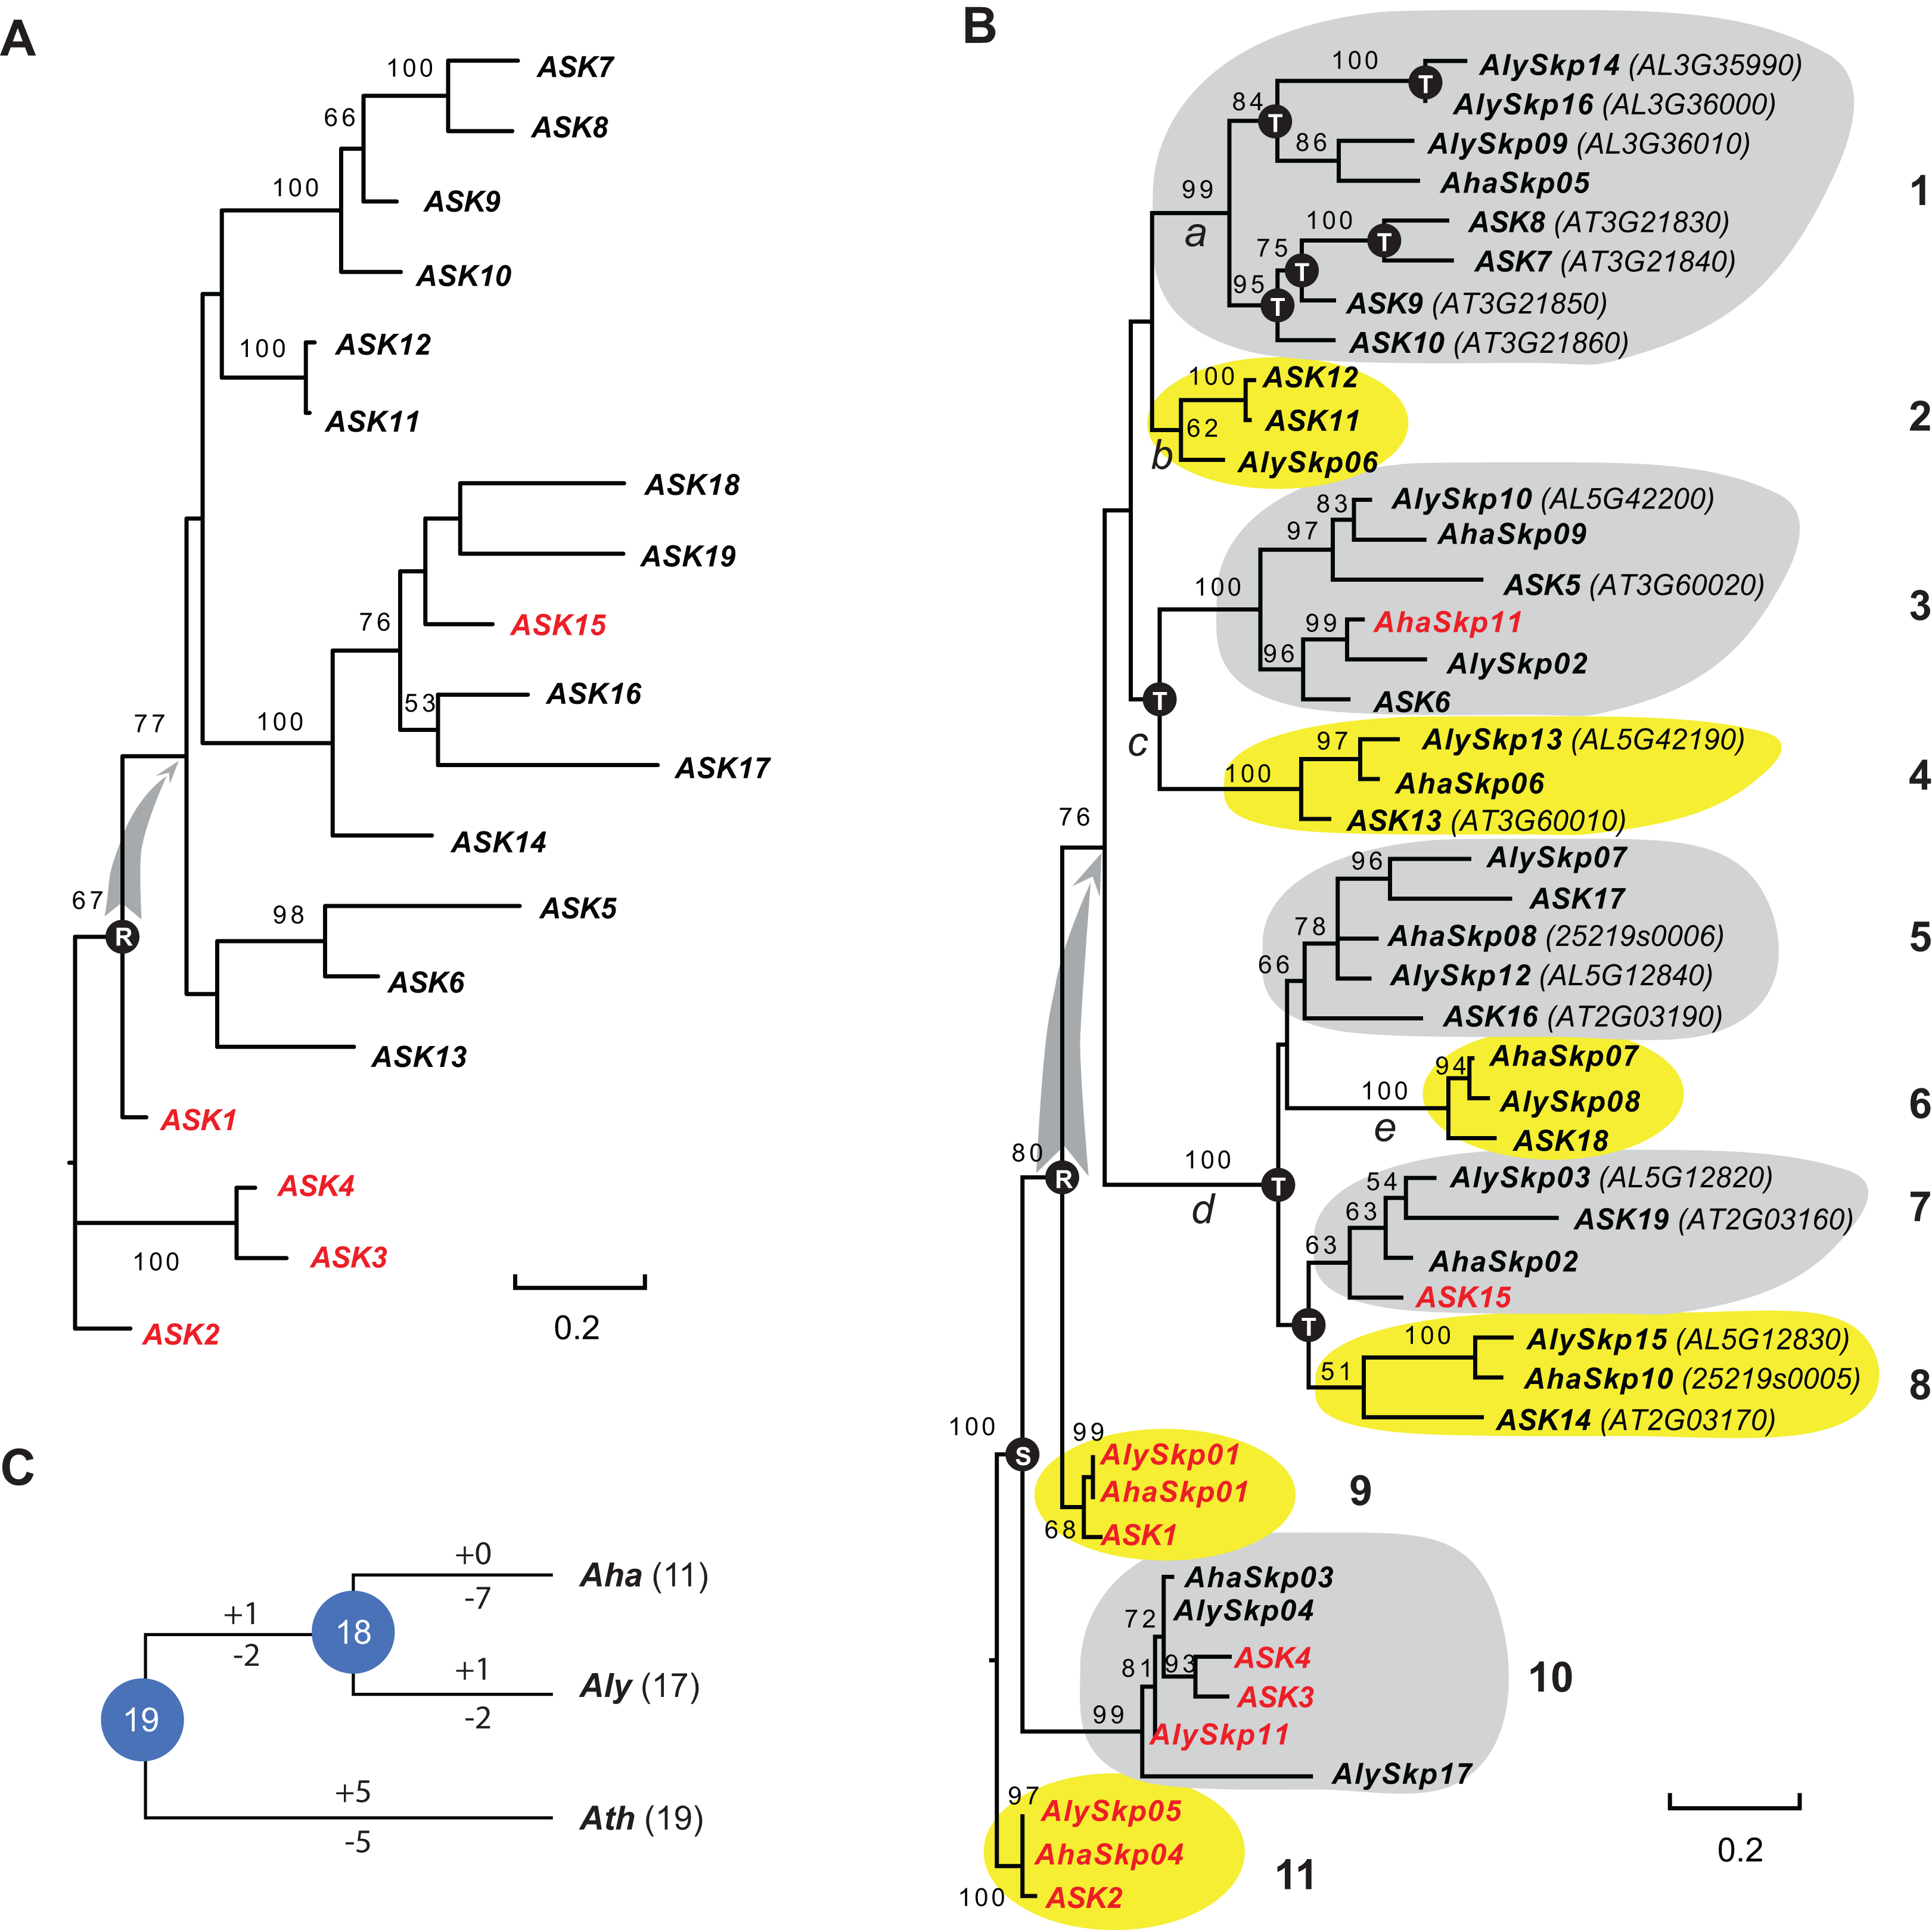
Since the sequences of Type II Skp1 genes are significantly diverged from Type I Skp1 genes, and most Skp1 genes are Type I (Kong et al., 2007), hereafter we focused on the evolutionary study of the Type I group. To understand the birth-and-death process of the Skp1 family in a short evolutionary history, we performed a phylogenetic analysis using an improved sequence alignment approach. Since manual adjustment and artificial deletion of ambiguous alignment sites are not always reproducible, Trimal (Capella-Gutierrez, Silla-Martinez & Gabaldon, 2009) was used to remove poorly aligned regions automatically. In addition, a consensus result was obtained from MUSCLE (Edgar, 2004) and MAFFT (Katoh, Rozewicki & Yamada, 2017) sequence alignments to improve accuracy (see "Materials and Methods"). The resulting alignment not only significantly reduced gaps and mis-matched sites, but also retained a reproducible result with 95 ± 5% of the full length Skp1 protein sequences being aligned (Fig. S1), maximizing the sequence length and variable sites essential for a good phylogenetic analysis (Nei & Kumar, 2000). As a proof of concept, an ASK2-rooted ML tree generated based on the 19 aligned ASK protein sequences showed a compatible topology to the one reported previously (Kong et al., 2007) (Fig. 1A). However, unlike the previous tree where intronless and intronic ASK genes are intermingled (Kong et al., 2007), all intron-containing ASK genes (except for ASK15, whose intron was gained after duplication (Kong et al., 2007)) were clustered at the base of the tree (Fig. 1A). This result better explains a single origin of the intronless ASK genes, which were duplicated through retroposition from a highly expressed ASK gene, most likely the ancestor of ASK1.
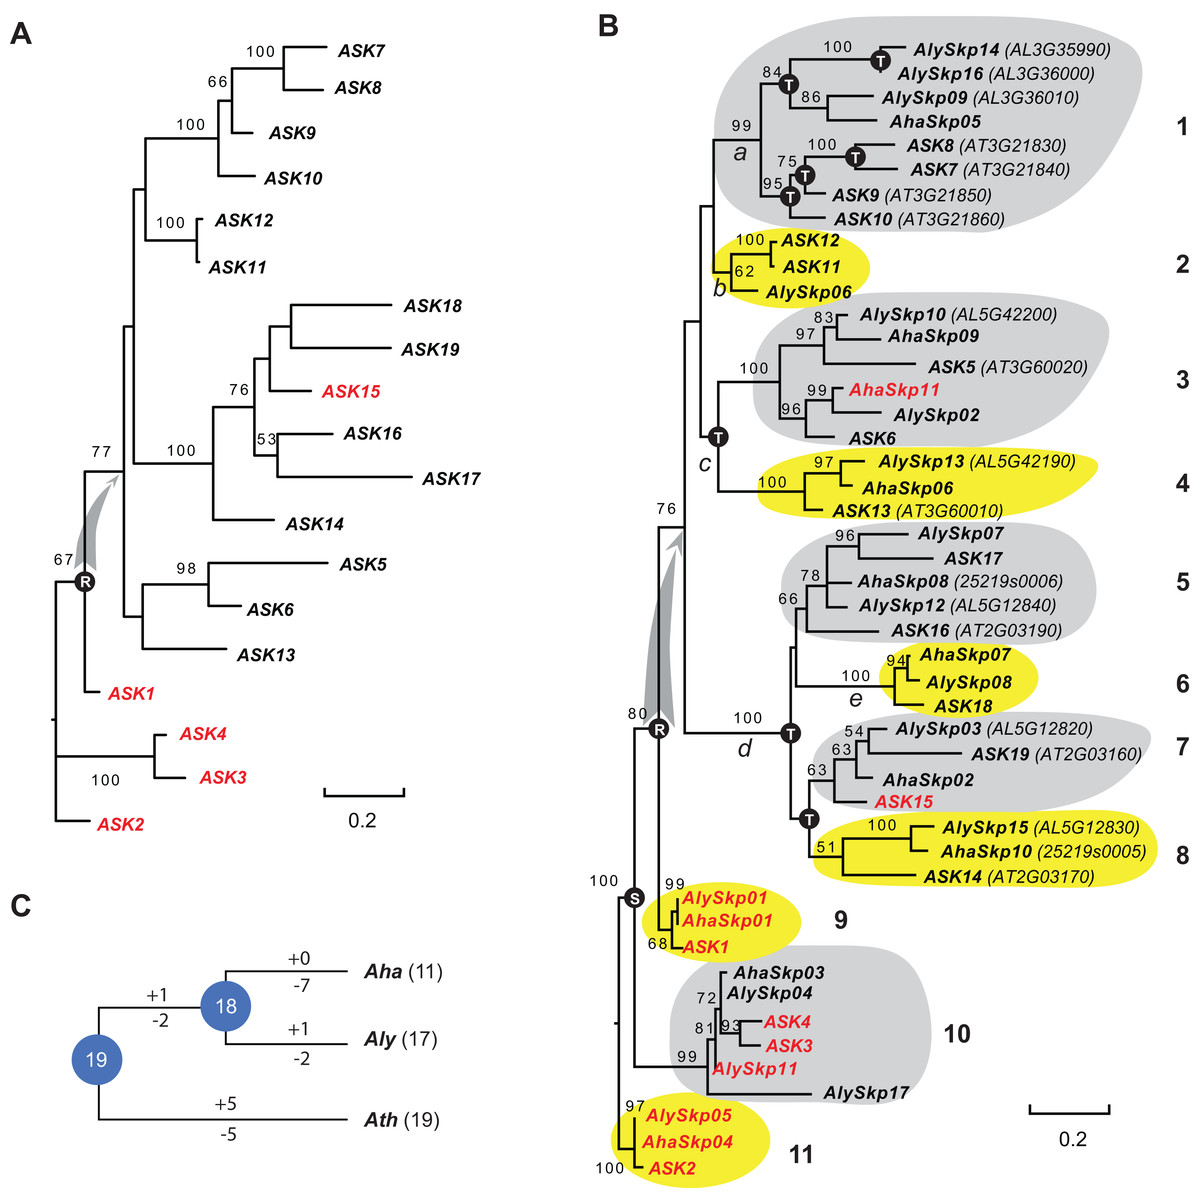
Figure 1: A short evolutionary history of the Arabidopsis Skp1 genes within the Arabidopsis genus.
(A) Phylogenetic relationships of the ASK members. Intronic genes are highlighted in red. Scale bar, average substitutions per site. (B) An improved phylogenetic analysis reveals one single origin of retroposed Skp1 genes in the Arabidopsis genus. a–e, 5 ancient retroposed loci produced by the transcripts of the highly expressed ancestor locus of ASK1. 1–11, 11 clades shaded with dark and gray color showing clear orthologous relationships among the three Arabidopsis species. The tree was generated by a maximum likelihood method. Statistical significance equal to or greater than 50% of 1,000 bootstrap re-samplings is indicated in each node. S, segmental duplication; T, tandem duplication; R, retroposed duplication. The ID number from the original annotation is indicated if a Skp1 gene is duplicated through tandem duplications or described in File S1. Intronic Skp1 genes and scale bar are described as in (A). Species abbreviations: Aha, A. halleri; Aly, A. lyrata; Ath, A. thaliana. (C) Birth-and-death history of Skp1 genes in the Arabidopsis genus. + and − indicate gain and loss of Skp1 members, respectively. Species abbreviations are as in (B).Subsequently, a ML tree rooted to ASK2 was generated based on the consensus protein sequence alignment of the 47 Arabidopsis Skp1 protein sequences by RAxML (Stamatakis, 2014). Encouragingly, the resulting phylogenetic tree showed a similar topology to that obtained for the ASK genes, and the 47 Skp1 genes from the three Arabidopsis species were intermingled in 11 clusters (Fig. 1B). Therefore, most Arabidopsis Skp1 genes were duplicated at least 5–10 mya, at the time when the three Arabidopsis species split (Hu et al., 2011; Koch & Kiefer, 2005). Similarly to the ASK genes, all intronic Arabidopsis Skp1 genes were clustered at the base of the tree, while the remaining intronless Skp1 genes were clustered into one big clade, suggesting a common role of retroposition in the expansion of the Skp1 family in Arabidopsis. Among these, three ancestor loci (Fig. 1B, nodes a, c, and d) were likely duplicated through retroposition, with each likely further undergoing tandem duplication events to yield the current Skp1 members. Two Skp1 clades (Fig. 1B, clades 2 and 6) were likely the direct product of a retroposition event. Therefore, the mRNAs produced by the highly expressed ASK1 ancestor were likely retrotransposed to five ancestor loci in total (Fig. 1B, nodes a–e). This phylogenetic tree also showed a clear duplication event between the ASK1 clade and the ASK4 clade before the split of three Arabidopsis species. Although Kong et al. (2007) first reported the contribution of segmental duplication in duplicating the ASK1 and ASK4 loci, their phylogenetic tree did not reflect the direct connection between these two genes (Kong et al., 2007).
We further reconciled a gene tree based on this ML tree. Along with a species tree, we detected significant variance of birth/death rates between each species (Fig. 1C). While A. halleri lost 7 Skp1 loci after a recent split from A. lyrata, A. thaliana has gained and lost five loci each from the 19 common Arabidopsis Skp1 gene ancestors. The birth/death rate of Skp1 genes in A. lyrata was intermediate among the three species; it gained and lost 2 and 4 Skp1 genes, respectively, following the split from A. thaliana. Such a significant size variation even within a short evolutionary history implied that some ancestral retroposed Skp1 loci resided in a hot spot of tandem duplications, which contributed to the differential sizes of the Skp1 family among the three Arabidopsis species. For example, at the ancestor “a” locus, 4 and 3 Skp1 genes were gained through tandem duplications within the past 5–10 million years in A. thaliana and A. lyrata, respectively (Fig. 1B).
Low evolutionary constraints of intronless ASK genes
The phylogenetic tree revealed a clear orthology relationship between the Skp1 genes of the three Arabidopsis species. To further demonstrate this relationship, we applied OrthoMCL (Li, Stoeckert & Roos, 2003) to identify 14 Skp1 orthologous groups, among which 18 ASK genes have been partnered with one A. lyrata Skp1 orthologous gene (Table S1). This clear orhology relationship allowed us to examine evolutionary constraints on the sequence divergence of ASK genes. We primarily applied the method of Nekrutenko, Makova & Li (2002) to test whether the Ka/Ks ratio (i.e., ω) of an ASK gene is significantly diverged from 1, which indicates between-species neutral nucleotide divergence. Surprisingly, nine out of 14 (64%) intronless ASK genes were detected to be under a neutral evolutionary process, while none of the four intronic ASK genes belongs to this category (Table 1), suggesting that the former group has lower functional constraints than the latter. Interestingly, using GeneWise reannotation (Birney, Clamp & Durbin, 2004), we identified a frame-shift mutation in the ASK6, AlySkp02, and AhaSkp11 loci that is characteristic of pseudogenes (Figs. S2–S4).
| Ath Skps | Aly Skps | dS | dN | dN/dS | lnML1 | lnML2 | 2Δl nML | Selection* |
|---|---|---|---|---|---|---|---|---|
| ASK2 | AlySkp05 | 0.2 | 0.0 | 0.1 | −799.9 | −779.5 | 40.8 | Non-neutral |
| ASK4 | AlySkp04 | 0.3 | 0.0 | 0.1 | −810.3 | −792.4 | 35.8 | Non-neutral |
| ASK3 | AlySkp04 | 0.3 | 0.0 | 0.1 | −793.3 | −778.7 | 29.1 | Non-neutral |
| ASK1 | AlySkp01 | 0.2 | 0.0 | 0.1 | −759.6 | −745.3 | 28.6 | Non-neutral |
| ASK18 | AlySkp08 | 0.2 | 0.1 | 0.3 | −916.5 | −908.8 | 15.5 | Non-neutral |
| ASK6 | AlySkp02 | 0.3 | 0.1 | 0.3 | −463.8 | −460.0 | 7.5 | Non-neutral |
| ASK11 | AlySkp06 | 0.2 | 0.1 | 0.4 | −776.3 | −773.8 | 5.0 | Non-neutral |
| ASK12 | AlySkp06 | 0.2 | 0.1 | 0.5 | −779.2 | −777.2 | 4.0 | Non-neutral |
| ASK13 | AlySkp13 | 0.2 | 0.1 | 0.6 | −831.1 | −829.8 | 2.6 | Neutral |
| ASK14 | AlySkp15 | 0.3 | 0.2 | 0.6 | −836.6 | −835.5 | 2.2 | Neutral |
| ASK8 | AlySkp09 | 0.2 | 0.3 | 1.6 | −909.0 | −908.0 | 2.0 | Neutral |
| ASK10 | AlySkp09 | 0.2 | 0.2 | 1.4 | −880.8 | −880.4 | 0.9 | Neutral |
| ASK19 | AlySkp03 | 0.2 | 0.2 | 0.8 | −1,110.3 | −1,109.9 | 0.8 | Neutral |
| ASK9 | AlySkp09 | 0.2 | 0.2 | 0.8 | −892.6 | −892.5 | 0.3 | Neutral |
| ASK16 | AlySkp12 | 0.1 | 0.1 | 0.9 | −885.8 | −885.8 | 0.1 | Neutral |
| ASK17 | AlySkp07 | 0.1 | 0.1 | 1.1 | −779.6 | −779.6 | 0.1 | Neutral |
| ASK5 | AlySkp10 | 0.1 | 0.1 | 0.9 | −804.5 | −804.4 | 0.1 | Neutral |
| ASK7 | AlySkp09 | 0.2 | 0.2 | 1.1 | −740.1 | −740.1 | 0.1 | Neutral |
Expression variation of the ASK genes
Low functional constraints do not necessarily mean no function (Nei & Kumar, 2000). To understand the functional differences between ASK genes, previous studies examined their expression patterns in different tissues/organs by semi-quantitative reverse transcription-PCR (RT-PCR) and in situ hybridization (Kong et al., 2004; Zhao et al., 2003). The results suggested that all ASK genes could be expressed in at least one of six samples examined (mostly in siliques). However, only the highly-expressed ASK1 and ASK2 genes showed a consistent result in both studies, while other ASK genes with low expression levels were not stably detected by RT-PCR, probably due to technical limitations (Kong et al., 2004; Zhao et al., 2003). Since then, a number of high throughput transcriptomic analyses, including microarray and RNA-Seq experiments, have been performed in A. thaliana, providing good resources to further examine the expression patterns of ASK genes in a more statistical manner.
Microarray experiments from 79 A. thaliana samples collected from different developmental stages confirmed that ASK1 and ASK2 are the two most highly expressed ASK genes, followed by ASK3. Unlike the previous studies (Kong et al., 2004; Zhao et al., 2003), not all ASK genes were detected in these microarray transcriptomic analyses, probably due to the low sensitivity and precision of microarray technologies (Wang, Gerstein & Snyder, 2009) (Fig. 2A). After comparing the expression levels of ASK genes in eight different tissues/organs (79 samples in total), we found that several ASK genes, including ASK1, 2, 3, 7, 8, 9, and 10, were expressed most highly in seeds (Fig. 2B), suggesting an important role for SCF-mediated protein ubiquitylation in seed development.
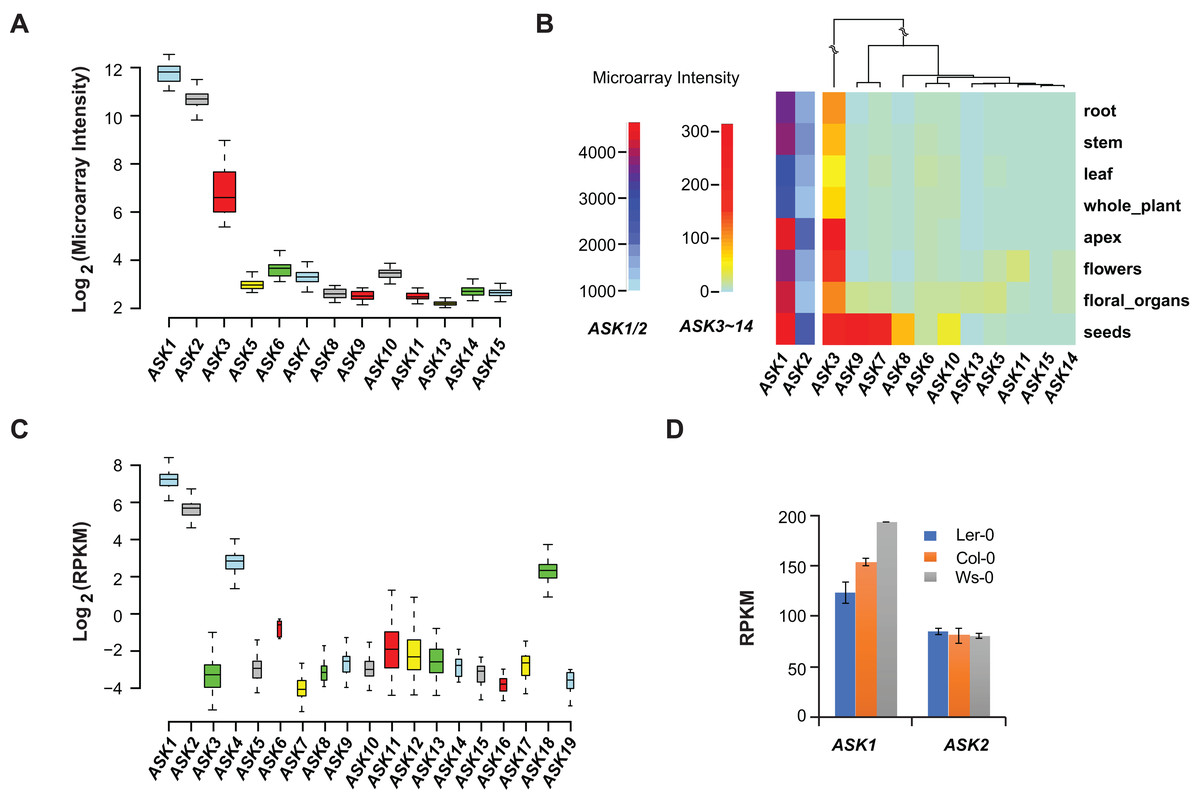
Figure 2: Expression variation of ASK genes.
(A) Variation of absolute expression throughout a developmental time course. (B) A heatmap analysis of mean expression variation of ASK genes across eight tissues/organs. (C) Expression variation of ASK genes in leaves of 144 accessions. The width of each boxplot is proportional to the number of accessions having a non-zero expression data of the corresponding ASK gene. (D) Expression comparison of ASK1 and ASK2 in Col-0, Ler-0, and Ws-0.We further analyzed the expression variance of ASK genes at the population level. Based on one RNA-Seq experiment (Schmitz et al., 2013), which provided a much more precise and sensitive transcriptomic analysis than microarrays (Wang, Gerstein & Snyder, 2009), the transcripts of each ASK gene could be detected in leaf tissues of 144 A. thaliana accessions, but with dramatic variance (Fig. 2C). Consistent with the previous studies and the microarray data, ASK1 has the highest expression level, followed by ASK2. However, the remaining ASK genes were only expressed at an average of 1.3 reads per kilobase of transcript per million mapped reads (RPKM), 121- and 42-fold below the mean expression of ASK1 and ASK2, respectively. Therefore, while ASK1 and ASK2 likely have important function(s), the role(s) of the other ASK genes in leaves appears minor. Interestingly, the four ASK genes (ASK1, 2, 4, and 18) whose mean expression levels are significantly higher than the other ASK genes (Wilcoxon rank-sum test, p < 2.2e-16,) are all under strong evolutionary constraints, and three of them are intronic, further supporting our conclusion regarding the low functional constraints of intronless ASK genes.
In addition to the expression variation among different ASK genes, the expression of ASK1 and ASK2 varied dramatically among different individuals. For example, the highest and the lowest expression levels of ASK1 were detected in the Gr-1 (480 RPKM, Longitude/Latitude/Altitude = 15.5/47/300) and Co-1 (50 RPKM, Longitude/Latitude/Altitude = −8.3/40.1/100) accessions, respectively, varying by 430 RPKM, while the highest and the lowest expression levels for ASK2 were detected in Ven-1 (210 RPKM, Longitude/Latitude/Altitude = 5.6/52/parking lot) and Ann-1 (10 RPKM, Longitude/Latitude/Altitude = 6.1/45.9/garden), respectively, differing by 200 RPKM (Fig. 2C). To confirm this result, we also examined the differential expression of ASK1 and ASK2 in another RNA-Seq experiment (Gan et al., 2011). The expression of ASK1 varied significantly among Col-0, Ler-0, and Ws-0, which are from distinct geographic regions, while ASK2 showed mild changes (Fig. 2D). Therefore, although ASK1 has the highest expression level among all the ASK genes, its expression varies the most among individuals, reflecting a possible adaptation of its expression regulation.
Differential sequence polymorphism of the ASK genes
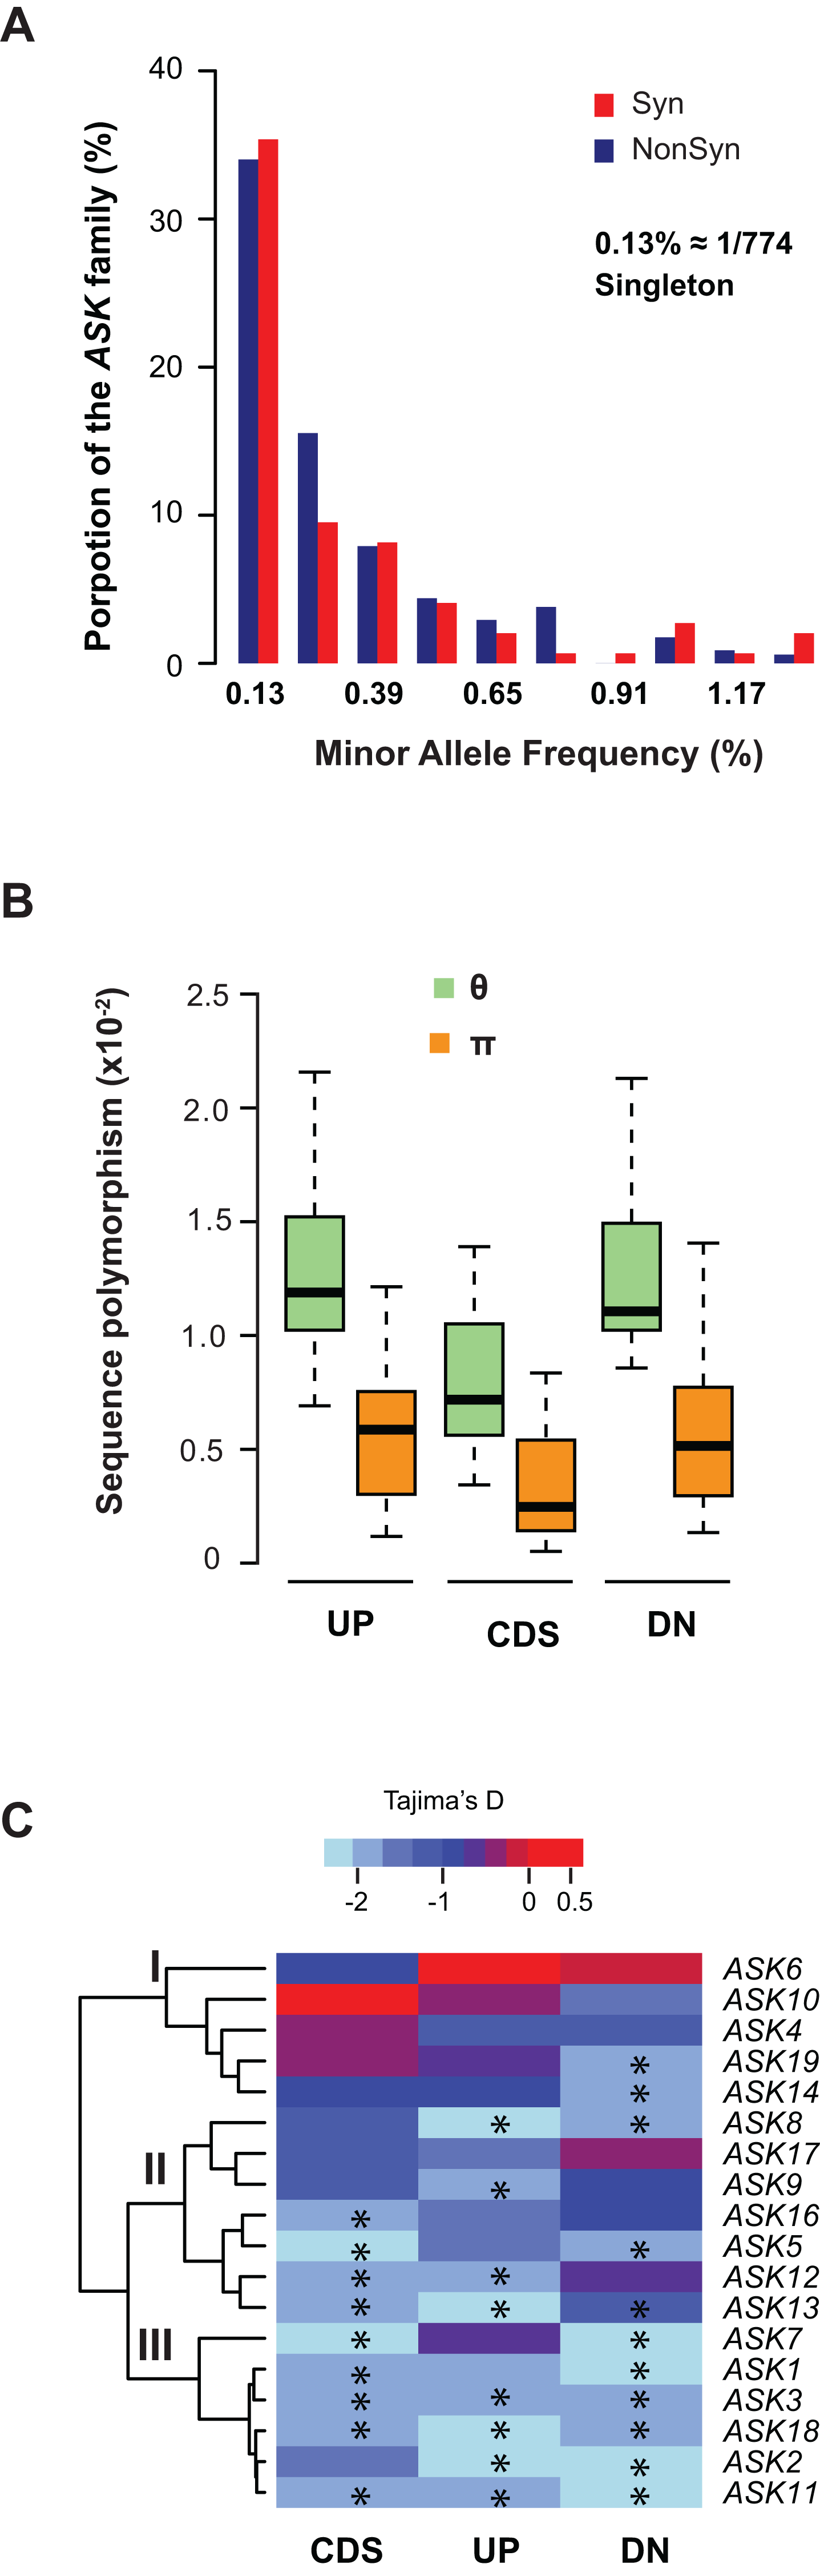
We further examined sequence diversity and polymorphism of the ASK genes within the family by comparing number of segregating sites per nucleotide site (θ) and nucleotide diversity (π) values in the regions 500 bp upstream of the start codon, within the CDS, and 500 bp downstream of the stop codon of an ASK gene among 774 A. thaliana accessions based on their SNP data (1001 Genomes Consortium, 2016). We first calculated the allele frequency distribution and noticed that minor allele frequency (MAF) alleles were significantly enriched. In the total populations analyzed, 34% of non-synonymous alleles and 35% synonymous alleles are only present once (i.e., singleton) in the ASK family (Fig. 3A), suggesting that many mutations are rare.
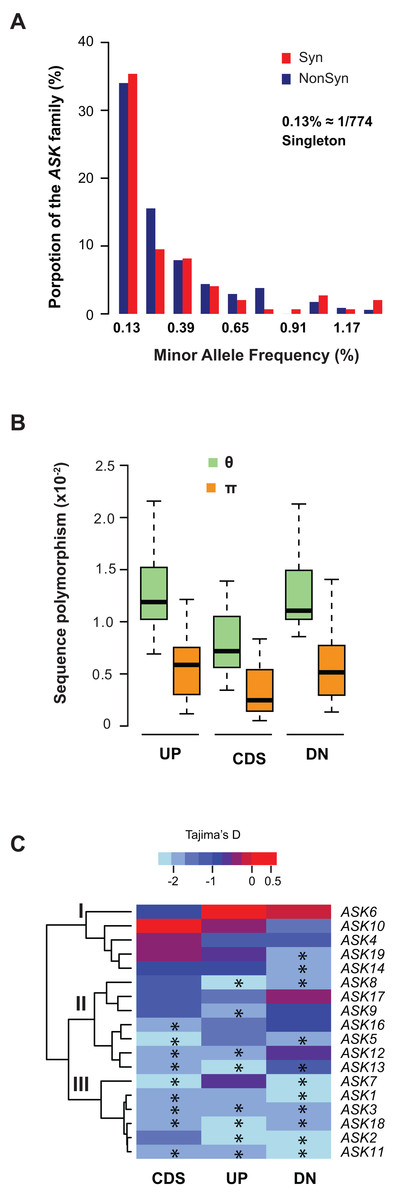
Figure 3: Sequence polymorphic comparison among different ASK genes.
(A) Frequency distribution of rare ASK alleles with non-synonymous and synonymous mutations. (B) Variation of sequence polymorphisms in three regions of an ASK gene. UP, 500 bp upstream of start codon; CDS, coding sequence; DN, 500 bp downstream of the stop codon. (C) A heatmap representation of Tajima’s D values demonstrating the differential evolutionary constraints of polymorphic mutations among ASK genes. Asterisks indicate a significantly low Tajima’s D value that deviates from neutral mutations (p < 0.05).Consistent with the enrichment of low MAF alleles, the π values are significantly lower than the θ values in CDSs (Fig. 3B), because the former is determined by allele frequency and the latter is not (Nei & Kumar, 2000). Similar to the CDSs, the π values are also significantly lower than the θ values in both upstream and downstream regions, indicating that low MAF alleles are also high in these two regions. As expected, these two regions have higher π and θ values than the CDSs due to their low functional constraints.
The variance of π and θ values within and between different regions of the ASK genes indicates different extents of polymorphism. To further examine the evolutionary constraints of polymorphic mutations, a Tajima’s D value (Tajima, 1989) was calculated for the three regions of an ASK gene (upstream, CDS, and downstream). According to the variance of this value, the 18 ASK genes as described in Table 1 were clustered into three groups (Fig. 3C). In Group I, which contains ASK4, 6, 10, 14, and 19, a high Tajima’s D value was observed in the CDSs, suggesting a balancing or neutral evolutionary process. Group II, which includes ASK5, 8, 9, 12, 13, 16, and 17, shows intermediate Tajima’s D values, some of which are significantly smaller than the Tajima’s critical values of neutral mutations (p < 0.05) (Tajima, 1989), suggestive of purifying selection. The remaining six ASK genes (ASK1, 2, 3, 7, 11, and 18) are clustered into Group III where most have a Tajima’s D value below the Tajima’s critical values of neutral mutations in all three regions (p < 0.05). Therefore, mutations in this group are rare, and most sequences are under strong purifying selection. Interestingly, this group enriched five out of eight ASK genes that were detected to be under non-neutral changes by orthology comparison (Table 1), further confirming their high evolutionary constrains. It is worth noting that the Tajima’s D value of the ASK2 CDS is within the range of Tajima’s critical values, suggesting that most SNPs in ASK2 are neutral.
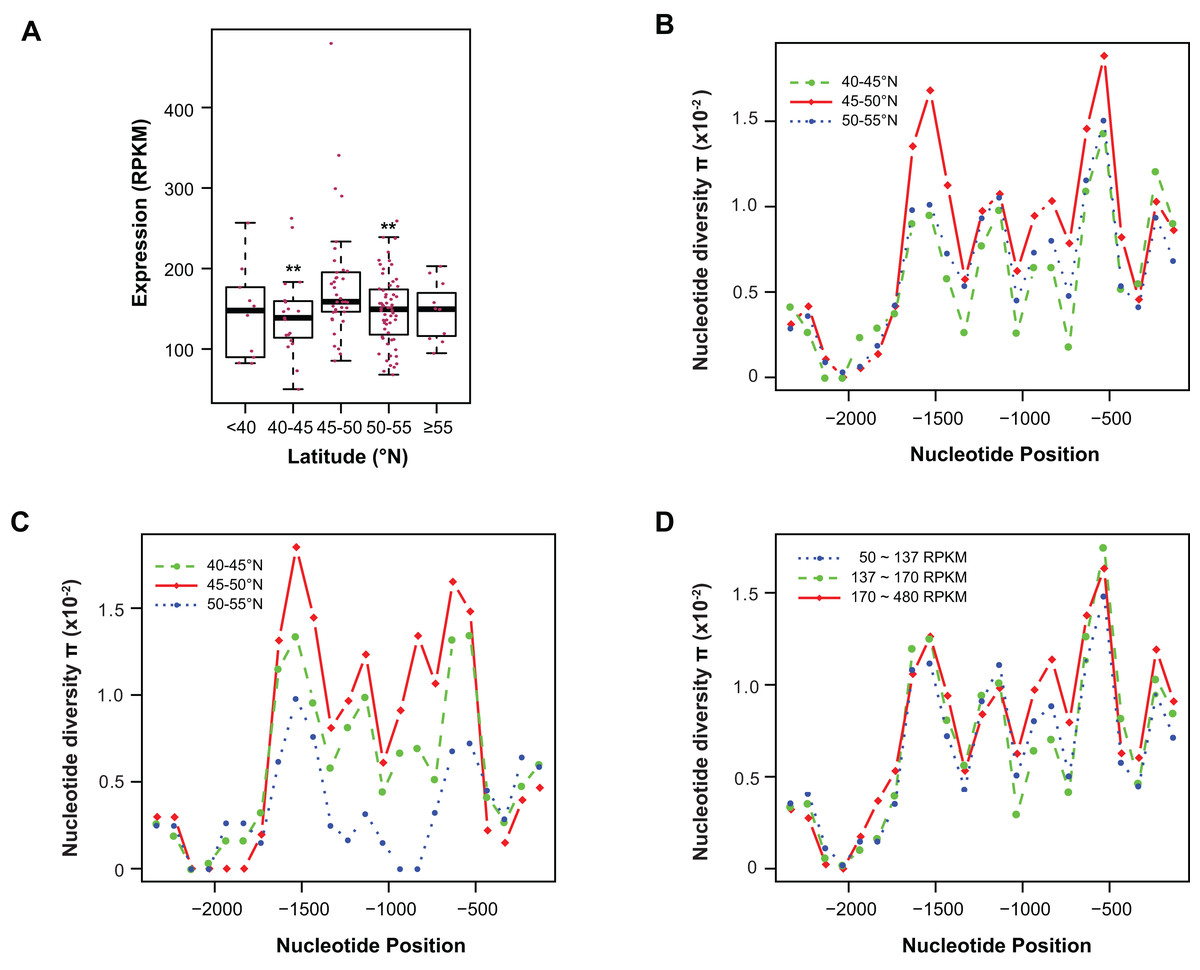
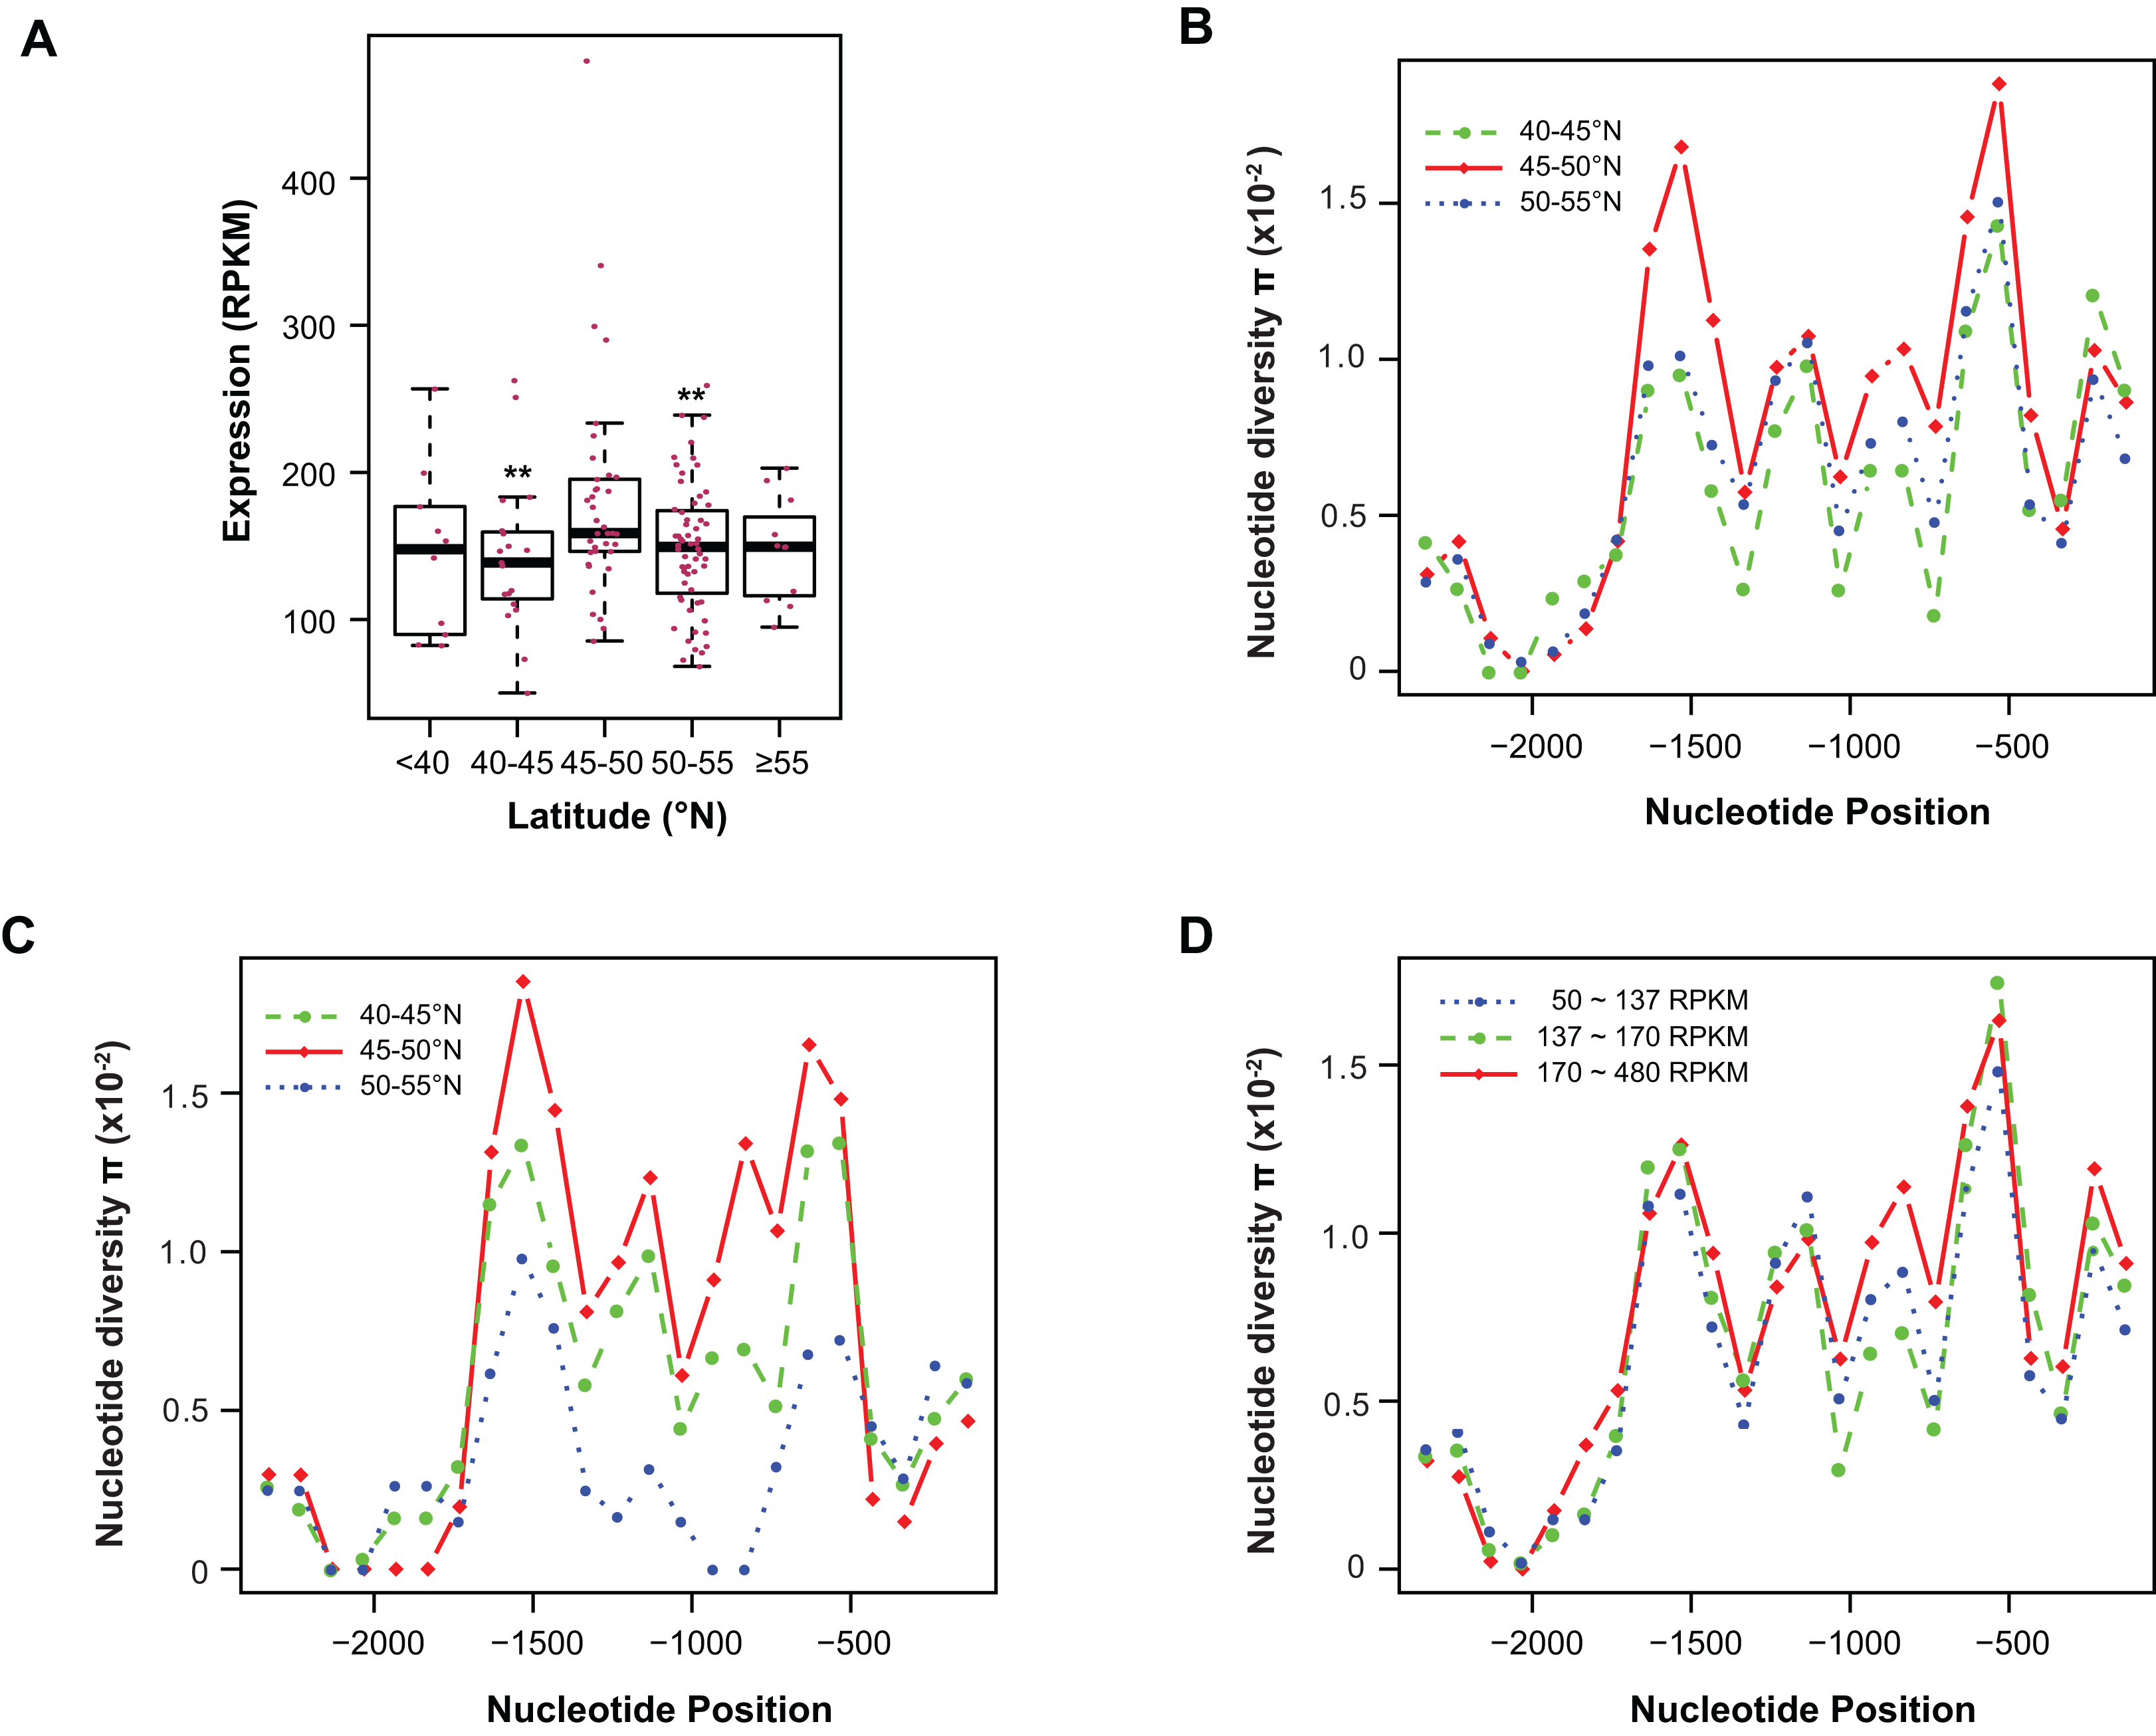
Figure 4: Contribution of sequence polymorphism to gene expression.
(A) Latitudinal variation of ASK1 expression. Asterisks indicate that the mean expression of the indicated group is significantly lower than that of the group within latitudes 45–50°N (Wilcoxon rank-sum test, p < 0.01). (B) A window-slide polymorphic comparison of a 2.5 kb region upstream of the transcriptional start site of ASK1 among populations from three latitudinal regions as in (A). (C) A window-slide polymorphic comparison of a group of test populations from three latitudinal regions, performed as in (B). (D) A window-slide polymorphic comparison of three groups of populations with low, medium, and high expression levels of ASK1 that was performed as in (B).Variation association of ASK1 expression and polymorphism
To associate sequence polymorphism with gene expression variation, we compared the expression patterns and pair-wise nucleotide diversity (π) of 144 A. thaliana accessions from the RNA-Seq experiment done by Schmitz et al. (2013). Based on the wide latitudinal distribution of accessions, five subgroups were separated (Fig. 4A). Although no linear regression is observed between individual expression levels and latitudes, accessions within latitudes 45–50°N have significantly higher levels of ASK1 gene expression than the two flanking regions 5° to the north or south (Wilcoxon rank-sum test, p < 0.01). Since 116 out of 144 accessions (81%) reside in these three sub-regions, the populations in these areas were further analyzed. To better understand the relationship between nucleotide diversity and expression levels of ASK1, the entire 2.5 kb intergenic sequence upstream of the transcription start site of ASK1 was compared. A window-sliding analysis (200 bp window and 100 bp slide) showed that the windowed π values from nucleotide −1,600 to −500 are significantly higher in accessions within latitudes 45–50°N than those in the other two regions (Fig. 4B, Wilcoxon rank-sum test, p < 0.05). Such a relationship between high polymorphism and high expression suggests that nucleotide variance in the promoter may prevent the binding of a putative transcriptional repressor that may suppress the expression of ASK1. To further demonstrate that the accessions within latitudes 45–50°N are highly polymorphic in the promoter region, we also compared accessions from the projects in Cao et al. (2011) and Long et al. (2013). In total, 29, 20, and 12 accessions resided in latitudes 40–45, 45–50, and 50–60°N, respectively. Consistently, the accessions from latitudes 45–50°N also have the highest sequence polymorphism from nucleotide −1,600 to −500 among the three groups compared (Fig. 4C). We also applied a different grouping method by separating the aforementioned 144 accessions into low (49 accessions with ASK1 expression value in the 50–137 RPKM range), medium (50 accessions with ASK1 expression of 137–170 RPKM), and high (45 accessions with ASK1 expression of 170–480 RPKM) expression groups. Among these three groups, high nucleotide polymorphism in the −1,000 to −500 region is also most evident in the group with high ASK1 expression (Fig. 4D).
Variance of biochemical interactions of ASK1 and ASK2 with known F-box proteins
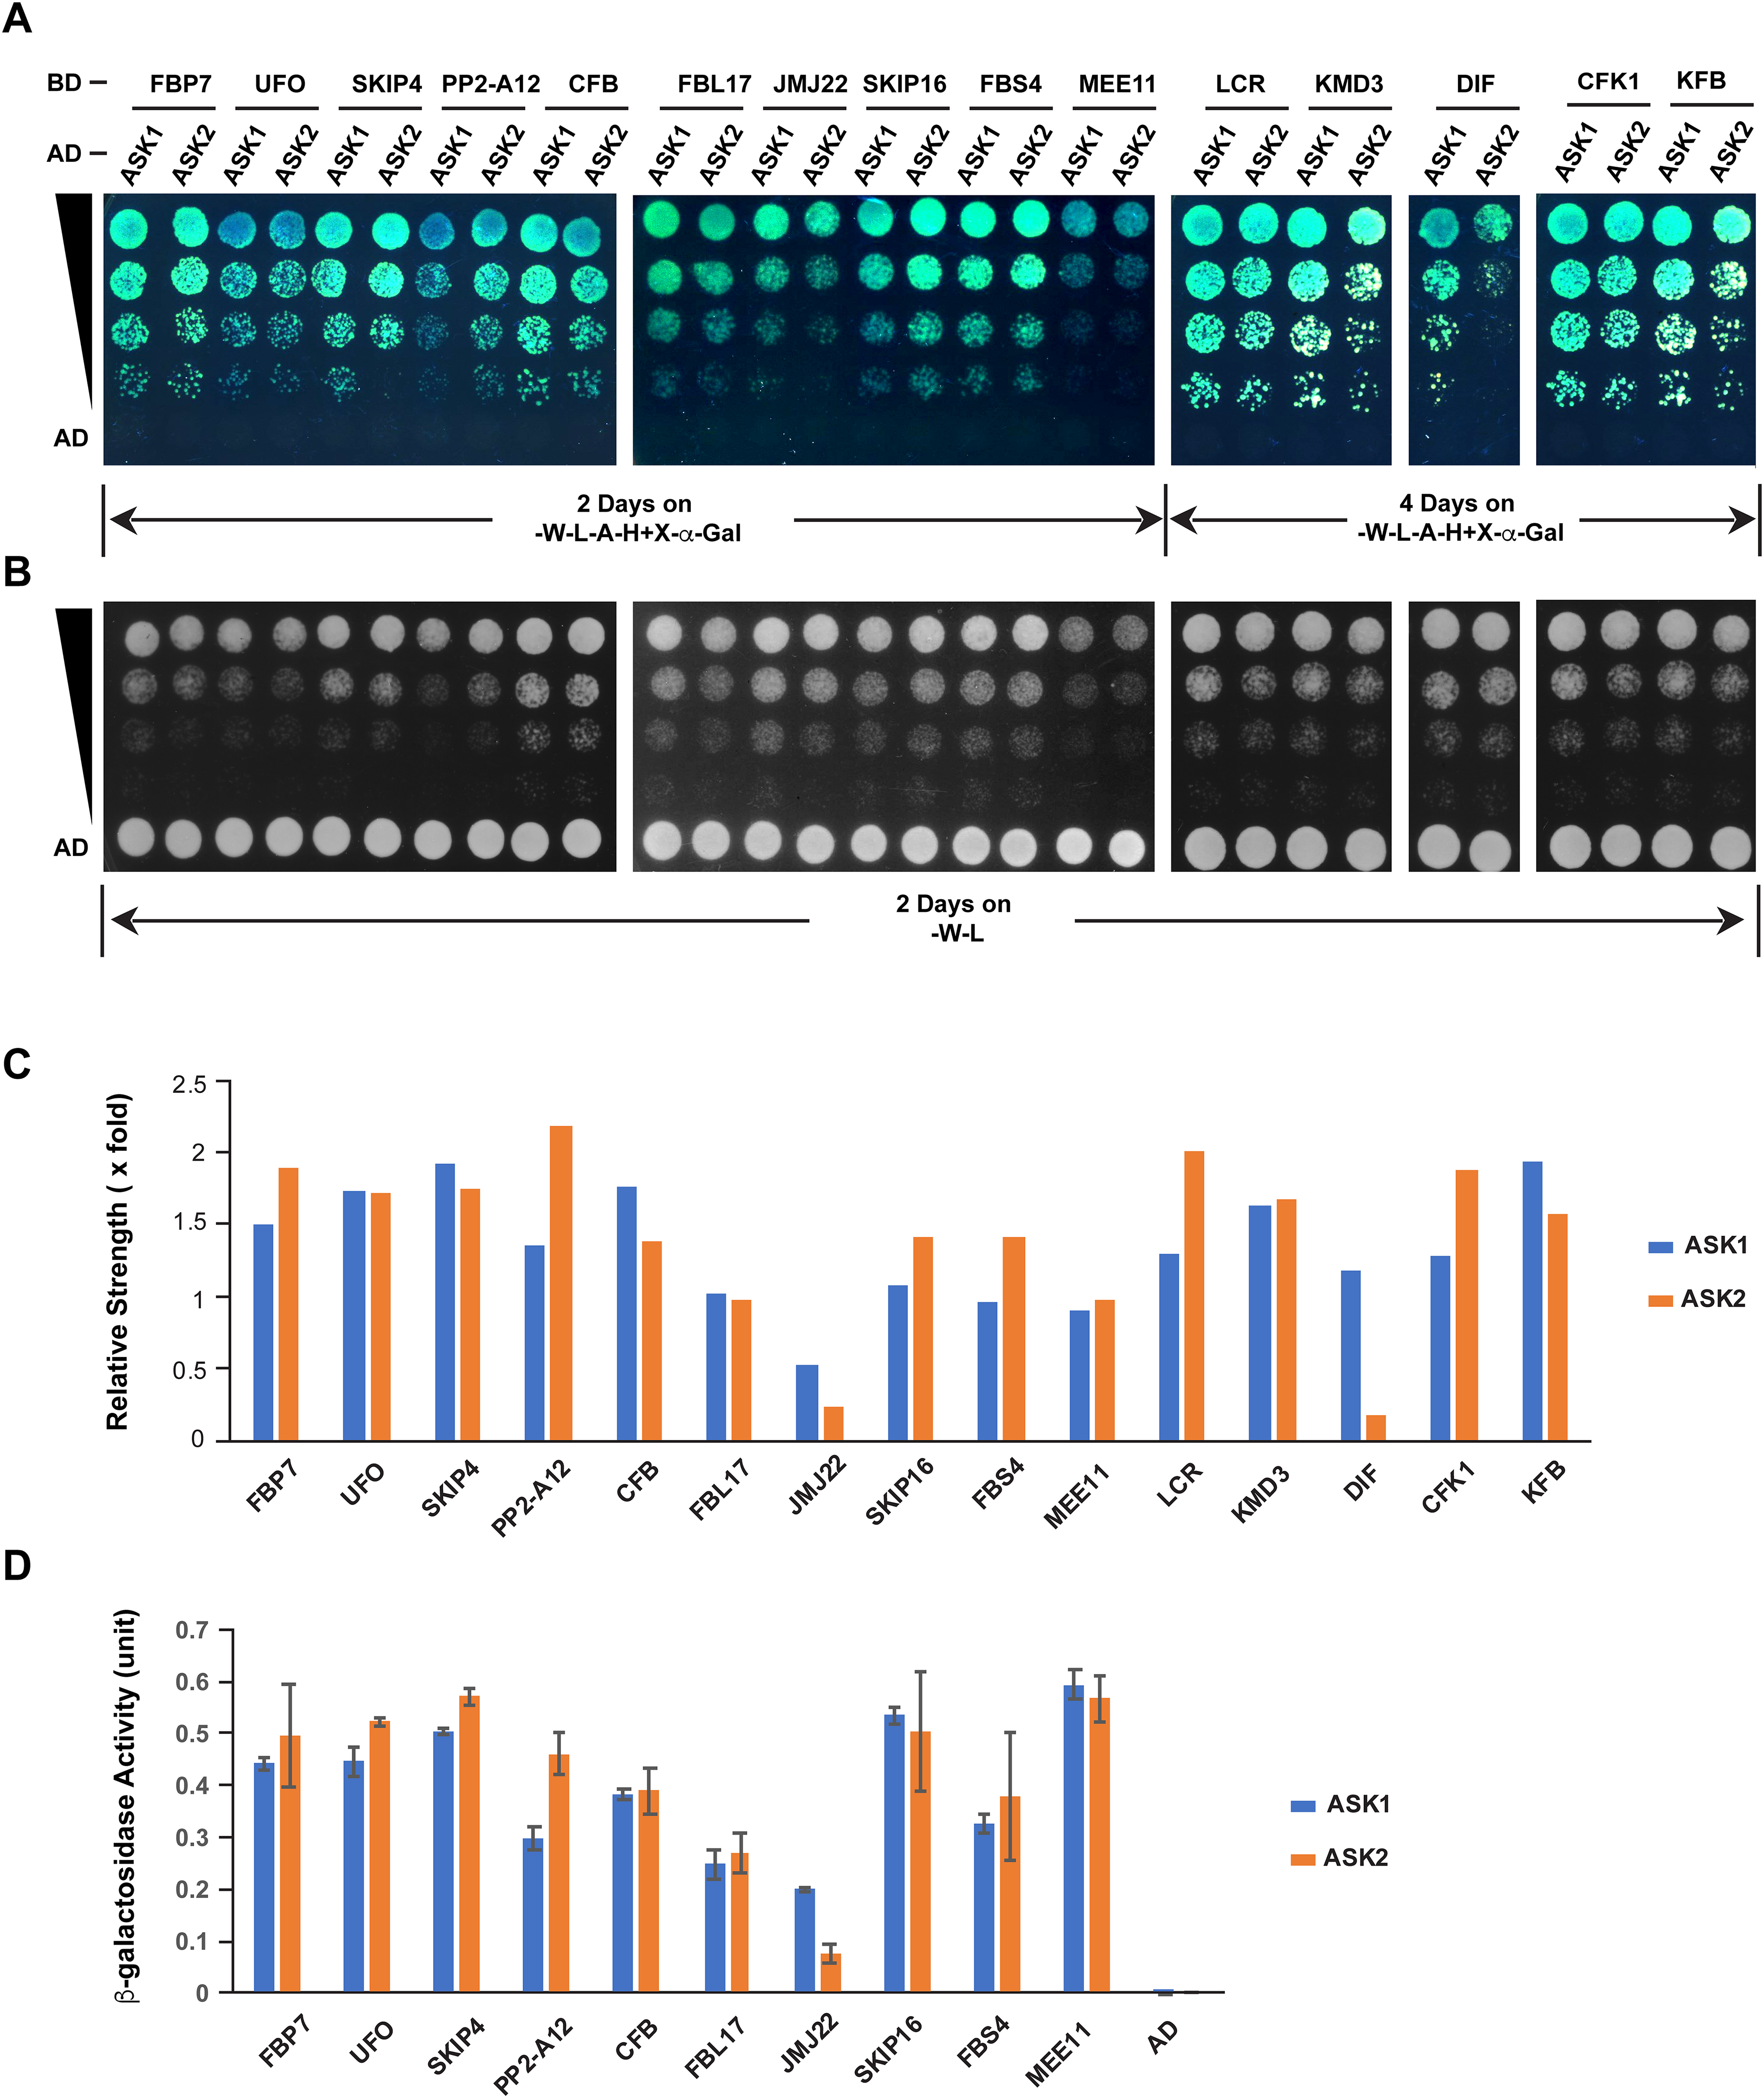
The different extent of sequence variation between ASK1 and ASK2 CDSs (Fig. 3C) led us to speculate that their encoded proteins might show differential strength of interaction with F-box proteins. To address this question, we tested the interactions of ASK1 and ASK2 by pair-wise yeast two-hybrid assay with 15 randomly-selected F-box proteins whose functions have been identified (Fig. 5; Table S2). Due to the identification of neutral polymorphic mutations in the ASK2 CDS and purifying selection in the ASK1 CDS, we hypothesized that ASK2 might have lost or reduced its interactions with a number of F-box proteins. To provide a starting point to examine the potential biochemical differences between ASK1 and ASK2, we performed both yeast growth assay on quadruple synthetic dropout medium (SD-Leu-Trp-Ade-His) containing X-α-gal (Figs. 5A–5C) and β-galactosidase activity analysis (Fig. 5D). Interestingly, we detected that two F-box proteins (JMJ22 and DIF) interacted with ASK1 with a strength >2-fold more than with ASK2 (Figs. 5C and 5D). However, the remaining F-box proteins showed an average of 15% variation in their interactions with ASK1 and ASK2, suggesting that the ASK2 protein, albeit carrying recently neutral mutations, still retains the capability in binding many functional F-box proteins. It is worth mentioning that the interaction strengths of ASK1 or ASK2 with different F-box proteins also vary dramatically. This is consistent with the high sequence divergence of F-box genes (Hua et al., 2013).
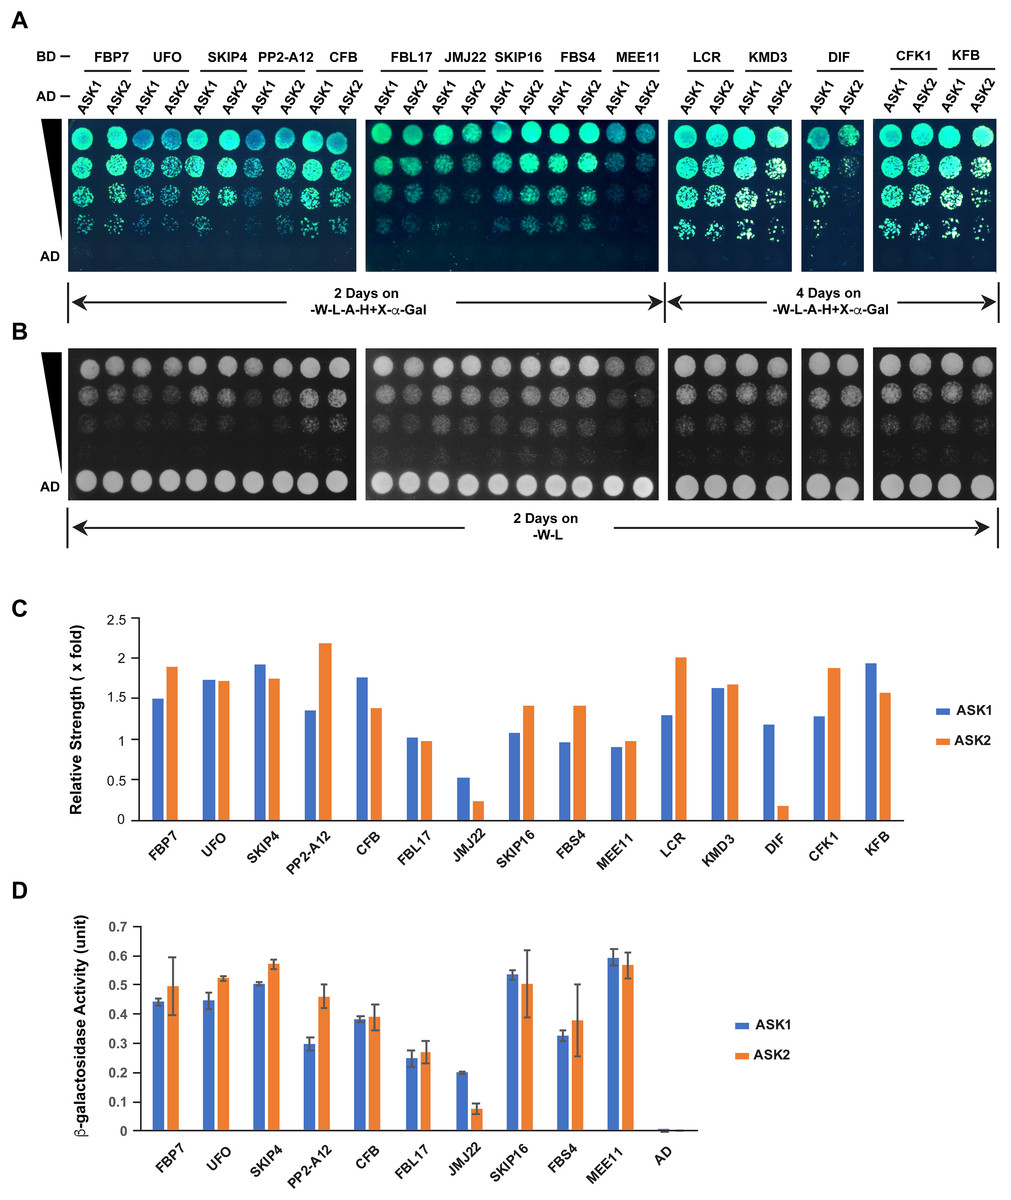
Figure 5: Quantitative interaction assay of ASK1 and ASK2 with 15 selected known F-box proteins.
The accession IDs of F-box proteins are listed in Table S2. (A) Growth of yeast cells expressing each indicated pair of bait and prey proteins on SD-Leu-Trp-Ade-His+X-alpha-gal medium. (B) Control growth of the corresponding yeast cells in (A) on SD-Leu-Trp medium. Yeast cells were grown on media at 30 °C for an indicated time period and their growth was subsequently recorded by scanning the plates with a Canon 9000F Mark II scanner. (C) Quantification of pairwise ASK1 and ASK2 interactions with 15 F-box proteins as shown in (A). The interaction strength of each pair of bait and prey proteins shown in (A) was normalized by the control growth strength of the corresponding yeast cells in (B). (D) ß-galactosidase activity assay. The mated yeast cells expressing the indicated pair of bait and prey proteins were grown on SD-Leu-Trp medium and used for the assay. The ß-galactosidase activities shown are mean values ± SD measured from two independent assays.Discussion
Gene duplication has been a long-standing topic of interest in genome evolution (Ohno, 1970). In eukaryotic genomes, this process plays an essential role in the expansion of many multi-gene families including those involved in the UPS (Hua et al., 2011, 2013; Hua, Doroodian & Vu, 2018; Hurles, 2004; Li et al., 2016; Panchy, Lehti-Shiu & Shiu, 2016). While gene duplication provides the raw genetic material for genome innovation, the large size of multi-gene families has been a hurdle in exploring genome function. For example, it is not yet clear whether and how multiple ASK members contributed to evolutionary innovation through sub-functionalization or neo-functionalization, or whether the expansion of the ASK family is simply due to the selective advantage of gene dosage or is a result of genomic drift. In this study, we applied several novel approaches to address these questions, as outlined below.
Retroposed ASK genes originated from one single ancestor locus
Instead of cross kingdom long-distant phylogenetic studies (Kong et al., 2004, 2007), we focused on a short evolutionary history within the Arabidopsis genus, so that the orthology relationships and duplication history of individual ASK members could be more clearly illustrated. In addition, more advanced sequence alignment tools have been adopted to improve the phylogenetic analysis (Fig. 1). For example, although Kong et al. (2007) discovered that ASK1 and ASK4 were duplicated through a segmental duplication event by comparing whole genome duplication blocks, their phylogenetic analysis did not reflect this duplication event. Here, we provided improved phylogenetic evidence not only showing the segmental duplication relationship between ASK1 and ASK4, but also demonstrating a single origin of all intronless ASK members from the ancestor of ASK1 through retroposition (Fig. 1). This new discovery is also consistent with the high expression of ASK1 (Fig. 2) and the short evolutionary history of intronless ASK members. Similarly, a previous study on the placental mammalian Gli-Kruppel type zinc finger transcription factor YY1 family revealed that two retroposed intronless subfamilies, YY2 and Reduced Expression 1, were separately clustered but not mingled with the intronic YY1 members (Kim, Faulk & Kim, 2007).
Degenerative processes of ASK genes
Since the first draft genome of A. thaliana was released, the evolutionary process of both the F-box and ASK families has been a hot topic in plant biology due to the importance of SCF-mediated protein ubiquitylation and the unequal expansion of the two families. Although it has been hypothesized that variant ASK proteins might contribute to interactions with a specific group of F-box proteins (Gagne et al., 2002; Kuroda et al., 2012), in vivo data is currently lacking. Indeed, most functionally characterized F-box proteins physically interact with ASK1 (Hua & Vierstra, 2011). Furthermore, recently evolutionary studies have suggested that the number of active F-box members is much fewer than the size of the family, due to a genomic drift evolutionary process (Hua et al., 2011; Nozawa, Kawahara & Nei, 2007; Xu et al., 2009). This raised a question as to whether all ASK proteins are involved in the assembly of active SCF complexes.
In this study, we integrated multiple levels of evidence to better describe the functional constraints of individual ASK members. Orthology comparisons revealed that 64% of intronless ASK genes were under neutral changes indicative of non-functionalization (Table 1). Both developmental and population expression comparisons suggested that most intronless ASK members have a very low expression level (Fig. 2). In addition, sequence polymorphism analysis showed a significant enrichment of intronless ASK members in the groups whose mutations were under neutral changes (Fig. 3C, clades I and II). Collectively, these data suggest that most, if not all, retroposed ASK members are under low functional constraints. This is indeed not surprising, since retroposed genes have a much high rate of pseudogenization, as suggested in the duplication studies of the human genome (Torrents et al., 2003). Consistently, our previous evolutionary studies of the F-box gene superfamily also discovered a significant enrichment of intronless genes in the pseudogene group (Hua et al., 2011). It will be of interest to explore the role of retroposition on the expansion of intronless F-box genes.
The large expression variance of ASK1 may indicate diverse functions of SCF complexes
Expression comparisons revealed a greater than 430 RPKM (∼10-fold) variance in ASK1 transcript levels among individual A. thaliana accessions (Fig. 2). Sequence analyses further suggested the presence of a putative transcriptional repressor that might contribute to such large variations in expression. Upstream sequences with more variable sites may prevent the binding of this transcriptional repressor, thus increasing expression. The finding that more polymorphic upstream sequences result in higher expression may support this model (Fig. 4). Such large variation in ASK1 expression among natural variants suggests that ASK1 is either very effective in promoting the assembly of SCF complexes or is involved in an as-yet-unknown-mechanism to regulate the polymorphic functions of SCF complexes. It will be noteworthy to further investigate the proteomic variance of SCF-mediated protein ubiquitylation in the future.
Conclusions
In this study, our improved phylogenetic analysis resolved the inconsistency between the phylogeny of ASK genes and the single origin of retroposed ASK members (Kong et al., 2007). Through evolutionary selection analysis and sequence polymorphism comparison, we discovered both adaptive and degenerative evolutionary processes in the ASK family. Yeast two-hybrid quantitative interaction assay and expression analysis across different accessions further indicated that recent neutral changes in the ASK2 CDS likely weakened its interactions with F-box proteins and that highly polymorphic upstream regions of ASK1 may contribute to adaptive roles of SCF complexes in Arabidopsis, respectively.
Supplemental Information
OrthoMCL groups of Skp1 proteins in Ath, Aly, and Aha species.
Gene identifications of 15 known F-box proteins selected for testing the differential interactions with ASK1 and ASK2.
Raw data for β-galactosidase activity assay.
β-galactosidase.
